Comparing Jacksonville, Florida to Lexington-Fayette, Kentucky involves analyzing various aspects including crime/safety, weather, cost of living, education, and work and economy, among others. Jacksonville, the most populous city in Florida, is known for its vibrant economy and warm year-round weather, while Lexington-Fayette, the horse capital of the world, boasts a blend of urban sophistication and southern charm. Both cities have unique cultural, geographical, and economical traits that make them appealing places to live or visit.
Distance between
Jacksonville, FL and
Lexington-Fayette, KY : 556.7 miles
Jacksonville's population is larger by 197%. Its population has grown by 218,997 people (29.8%) since 2000. The population of Lexington-Fayette has grown by 61,281 people (23.5%) during that time.
In regards to crime and safety, Jacksonville's crime rates are somewhat higher than the national average, although efforts are constantly made to deter criminal activity. On the other hand, Lexington-Fayette has lower-than-average crime rates, contributing to its reputation as a safe city. Tourists and potential residents can expect well-funded and proactive law enforcement in both cities, maintaining safe environments to the best of their abilities.
Cost of Living
In terms of cost of living, Jacksonville is relatively affordable compared to other major Florida cities. It boasts a slightly lower cost of living index than the national average. Lexington-Fayette, meanwhile, is also below the national average in cost of living, with housing being particularly affordable. Both cities offer less expensive options for living, dining, and entertainment compared to larger U.S cities.
Income Tax
As previously stated, Florida does not charge a state income tax, making Jacksonville an attractive option for workers. Lexington-Fayette residents are subject to Kentucky's state income tax, which ranges from 2% to 5%.
Property Tax
Both Jacksonville and Lexington-Fayette homeowners do pay property tax. Jacksonville has lower property tax rates than Lexington-Fayette, but this can vary depending on the specific area of residence within each city.
Sales Tax
Both Florida and Kentucky have state sales tax. However, Florida does not have a state income tax, which can be a big draw for people considering relocation. Lexington-Fayette, on the other hand, has a lower sales tax rate but does levy a state income tax.
Income
Type
Jacksonville
Lexington-Fayette
Estimated median household income
$58,621
$60,942
Estimated per capita income
$32,953
$37,011
Cost of living index (U.S. average is 100)
88.3
89.3
If you make $50,000 in Jacksonville, you will have to make $50,566 in Lexington-Fayette to maintain the same standard of living.
Geographical Conditions
Jacksonville's geographical traits include beautiful sandy beaches, the St. John's River, and large urban park systems. Lexington-Fayette is characterized by its rolling bluegrass-covered hills, horse farms, and close proximity to the Daniel Boone National Forest.
Education in both cities offers plenty of choices. Jacksonville has numerous public and private schools, as well as higher ed options that include the University of North Florida and Jacksonville University. Lexington-Fayette is home to the University of Kentucky, offering renowned educational and sporting programs, and a variety of high-rated public and private schools.
The work and economy of Jacksonville is centered around services, banking, healthcare, logistics, and tourism. On the other hand, Lexington-Fayette's economy is tied to education, healthcare, manufacturing, and the horse industry. Both cities have diverse economies with abundant job opportunities and different strengths.
Biggest Employers
In Jacksonville, the largest employers include Naval Air Station Jacksonville, Duval County Public Schools, and City of Jacksonville. In Lexington-Fayette, the University of Kentucky, Lexington-Fayette County Government, and the Federal Medical Center are the top employers.
There were 1,310 building permits issued in Jacksonville in 2012 (353 more than in 2011) compared to 792 building permits issued in Lexington-Fayette in 2012 (279 more than in 2011).
In Jacksonville (Duval County), 47.9% voted for Democrats and 51.5% for Republicans in 2012 Presidential Election. In Lexington-Fayette (Fayette County), 49.3% voted for Democrats and 48.3% for Republicans.
Elections
Type
Democrats
Republicans
Other
Year
Jacksonville
Lexington-Fayette
Jacksonville
Lexington-Fayette
Jacksonville
Lexington-Fayette
2020
51.3%
59.4%
47.5%
38.6%
1.2%
1.9%
2016
47.2%
51.3%
48.6%
41.8%
4.2%
6.9%
2012
47.9%
49.3%
51.5%
48.3%
0.6%
2.3%
2008
49.0%
51.7%
51.0%
46.9%
0.0%
1.3%
2004
41.7%
46.3%
57.9%
53.1%
0.3%
0.6%
2000
40.9%
45.0%
57.7%
51.8%
1.4%
3.2%
1996
44.2%
47.1%
50.0%
46.3%
5.8%
6.6%
Breakdown of population affiliated with a religious congregation
Type
Adherents
Congregations
Religion
Jacksonville
Lexington-Fayette
Jacksonville
Lexington-Fayette
SOUTHERN BAPTIST CONVENTION
15.8%
13.7%
22.3%
19.5%
CATHOLIC CHURCH
9.0%
8.8%
2.8%
3.0%
EPISCOPAL CHURCH
1.2%
0.9%
2.3%
2.3%
MUSLIM ESTIMATE
0.7%
0.2%
0.6%
0.8%
EVANGELICAL LUTHERAN CHURCH IN AMERICA
0.3%
0.4%
0.9%
1.1%
SEVENTH DAY ADVENTIST CHURCH
0.3%
0.3%
1.4%
1.5%
PRESBYTERIAN CHURCH IN AMERICA
0.1%
0.3%
0.9%
0.8%
VINEYARD USA
0.1%
0.4%
0.2%
0.4%
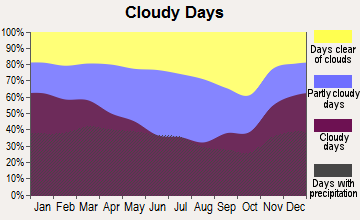
Weather
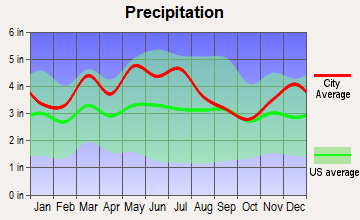
When it comes to weather, Jacksonville's subtropical climate offers hot summers and mild winters, attracting many snowbirds. Lexington-Fayette experiences a more variable climate, with warm, humid summers and moderately cold winters. Jacksonville's weather is usually more attractive to those seeking sun and warmth, while Lexington-Fayette offers a change in seasons that some people desire.
Weather and climate
Type
Jacksonville
Lexington-Fayette
Temperature - Average
68.3°F
55.3°F
Humidity - Average morning or afternoon humidity
78.4%
75.8%
Humidity - Differences between morning and afternoon humidity
44%
31%
Humidity - Maximum monthly morning or afternoon humidity
92%
85%
Humidity - Minimum monthly morning or afternoon humidity
48%
54%
Precipitation - Yearly average
51.8 in
45.9 in
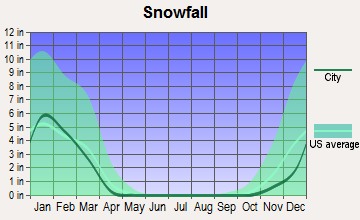
Snowfall - Yearly average
0 in
35.2 in
Clouds - Number of days clear of clouds
15.8%
14.9%
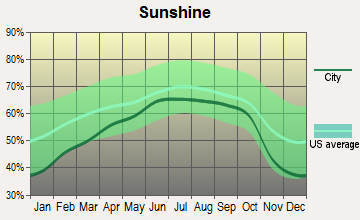
Sunshine amount - Average
69.6%
59.9%
Sunshine amount - Differences during a year
16%
25.5%
Sunshine amount - Maximum monthly
74%
66.2%
Sunshine amount - Minimum monthly
58%
40.7%
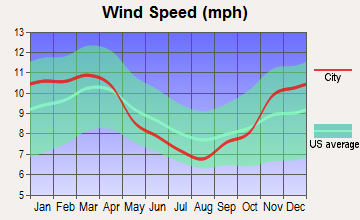
Wind speed - Average
7.2 mph
8.6 mph
Average climate in Jacksonville, Florida
Average climate in Lexington-Fayette, Kentucky
Air pollution
Type
AQI
CO
NO2
OZONE
PB
PM25
SO2
Year
Jacksonville
Lexington-Fayette
Jacksonville
Lexington-Fayette
Lexington-Fayette
Jacksonville
Lexington-Fayette
Jacksonville
Jacksonville
Lexington-Fayette
Jacksonville
Lexington-Fayette
2018
78
63
N/A
N/A
3.1
N/A
24.5
31.6
N/A
N/A
7.1
9.7
N/A
0.1
2017
74
64
N/A
N/A
4.9
N/A
24.7
32.1
N/A
N/A
5.8
7.2
0.7
0.1
2016
65
68
0.50
N/A
6.6
N/A
24.9
33.3
N/A
N/A
5.2
6.9
0.4
0.1
2015
63
71
0.35
N/A
6.7
N/A
25.4
31.4
N/A
N/A
4.9
7.3
0.3
0.1
2014
66
68
0.27
N/A
6.8
N/A
24.3
34.1
N/A
N/A
5.9
7.6
0.7
0.3
2013
68
69
0.18
N/A
7.3
N/A
23.0
31.7
N/A
N/A
5.3
10.0
0.7
0.2
2012
66
81
0.10
N/A
8.1
N/A
24.0
34.9
N/A
N/A
5.8
10.6
0.6
0.8
2011
88
78
0.28
N/A
8.3
N/A
26.6
34.6
N/A
N/A
8.1
11.3
0.8
2.1
2010
77
76
0.31
N/A
9.5
N/A
26.4
34.9
N/A
N/A
7.1
10.0
0.8
2.2
2009
72
75
0.16
N/A
8.5
N/A
25.0
31.1
N/A
N/A
8.5
9.2
0.6
2.7
2008
75
72
0.15
N/A
7.8
N/A
27.6
36.4
N/A
N/A
10.0
9.1
0.9
2.4
2007
92
92
0.29
N/A
10.9
N/A
28.4
37.9
N/A
N/A
11.4
12.9
1.2
4.0
2006
87
65
0.35
N/A
11.8
N/A
29.0
32.8
N/A
N/A
10.8
N/A
1.4
3.8
2005
93
77
0.42
N/A
12.1
N/A
26.5
34.0
N/A
N/A
12.2
N/A
1.8
4.4
2004
92
60
0.40
N/A
11.6
N/A
25.2
28.6
N/A
N/A
12.4
N/A
1.4
3.2
2003
55
67
0.43
N/A
12.2
N/A
21.6
30.3
N/A
N/A
N/A
N/A
1.6
3.5
2002
59
76
0.49
0.04
12.1
N/A
22.2
31.3
0.003
N/A
N/A
N/A
1.7
3.6
2001
74
69
0.49
0.07
13.2
N/A
24.0
30.9
0.009
N/A
N/A
N/A
2.5
4.4
2000
85
79
0.52
0.14
13.4
N/A
25.1
32.7
0.017
N/A
N/A
N/A
3.0
5.0
Natural disasters
Type
Jacksonville
Lexington-Fayette
Tornado activity compared to U.S. average
75.2%
126.8%
Earthquake activity compared to U.S. average
18.1%
171.6%
Natural disasters compared to U.S. average
24%
14%
Transportation
Jacksonville provides a larger transportation network, including an international airport, interstate highways, extensive public transit, and a burgeoning bike-share program. Lexington-Fayette, while smaller, also offers numerous transportation choices including Blue Grass Airport, inner city buses, and convenient biking and walking pathways. The average commute time in both cities is below the national average.
Transport
Type
Jacksonville
Lexington-Fayette
Amtrak stations
1
0
Amtrak stations nearby
1
0
FAA registered aircraft
566
0
FAA registered aircraft manufacturers and dealers
34
0
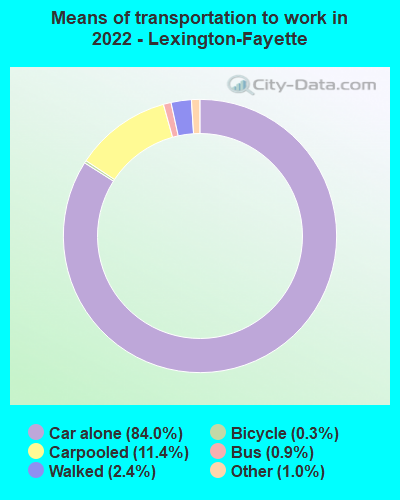
Means of transportation to work
Type
Jacksonville
Lexington-Fayette
Bicycle
0.2%
0.6%
Bus
1.1%
1.2%
Carpooled
9%
8.3%
Car alone
86.5%
86.5%
Motorcycle
0.2%
0.1%
Taxicab
0.2%
0.1%
Walked
1.2%
2.6%
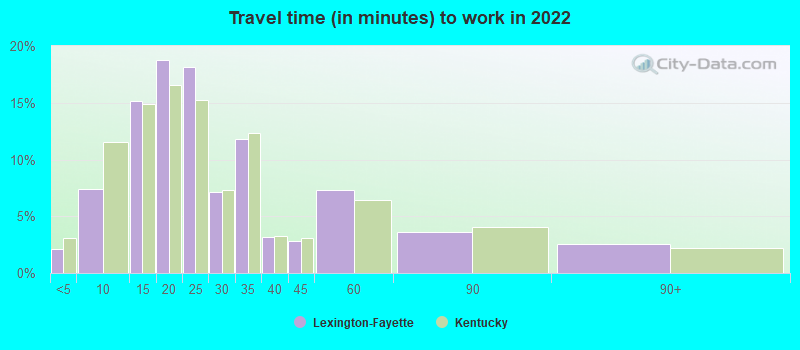
Average travel time to work
Type
Jacksonville
Lexington-Fayette
Average
27.5 min
26.5 min
Other means
25 min
20.2 min
Public transportation
43.7 min
35 min
Private vehicle occupancy
Type
Jacksonville
Lexington-Fayette
Average
1.1
1.1
Drove alone
89.4%
90.6%
In 2 person carpool
8%
7.7%
In 3 person carpool
1.7%
1.2%
In 4 person carpool
0.7%
0.3%
In 5-6 person carpool
0%
0.1%
In 7+ person carpool
0.2%
0.1%
How many people usually rode to work in the car, truck or van.
Real Estate
Both cities offer attractive real estate markets. Jacksonville boasts a mix of beachfront properties, condos, and suburban homes, while Lexington-Fayette is known for its beautiful horse farms and historic homes. Both cities have seen a consistent growth in property values over the years.
Neighborhoods
Jacksonville's neighborhoods range from beachfront communities like Jacksonville Beach to historic areas like Riverside. Lexington-Fayette offers a mix of urban living in Downtown, historic charm in the Gratz Park area, and rural beauty in the outlying horse farm districts. Each city offers a variety of lifestyle options based on neighborhood characteristics.
Houses and residents
Type
Jacksonville
Lexington-Fayette
Houses
422,315
147,590
Average household size (people)
2.5
2.3
Median year apartment built
1985
1983
Median year house/condo built
1987
1985
Length of stay in the house since moving in
12.5 years
12 years
Houses occupied
386,283 (91.5%)
139,303 (94.4%)
Houses occupied by owners
226,429 (58.6%)
75,129 (53.9%)
Houses occupied by renters
159,854 (41.4%)
64,174 (46.1%)
Median rent asked for vacant for-rent units
$1,444
$1,514
Median monthly housing costs
$1,154
$1,026
Median price asked for vacant for-sale houses and condos
$260,045
$229,178
Estimated median house or condo value
$239,400
$242,400
Median numbers of rooms
5.6
5.4
Median number of rooms in apartments
4.3
4
Median number of rooms in houses and condos
6.3
7
Median house price - detached houses
$282,276
$300,664
Median house price - in 2-unit structures
$177,341
$297,942
Median house price - in 3-to-4-unit structures
$144,947
$165,223
Median house price - in 5 or more unit structures
$220,508
$179,160
Median house price - mobile homes
$87,589
$37,529
Median house price - Townhouses or other attached units
$213,709
$232,720
Median house price - All housing units
$266,926
$289,099
Median house age
36
37
Renting percentage
38.3%
44.1%
Housing density (houses/condos per square mile)
557.4
518.7
House value disparities
33.2%
33%
Household income disparities
44.2%
46.3%
Median household income for houses/condes with a mortgage
$83,160
$95,171
Median household income for apartments without a mortgage
$59,777
$74,841
Housing units without a mortgage
2,439 (1.6%)
2,236 (4.2%)
Housing units with both a second mortgage and home equity loan
8,460 (5.5%)
6,457 (12.1%)
Housing units with a mortgage
150,468 (98.4%)
51,182 (95.8%)
Housing units with a home equity loan
255 (0.2%)
156 (0.3%)
Housing units with a second mortgage
11,378 (7.4%)
7,551 (14.1%)
House/condo owner moved in on average (years ago)
10
9
House/condo renter moved in on average (years ago)
1
1
Housing units lacking complete kitchen facilities
1.5%
1.3%
Housing units lacking complete plumbing facilities
1.4%
0.4%
Housing units in structures
Housing units in structures
Jacksonville
Lexington-Fayette
One, detached
59.4%
58.7%
One, attached
6.1%
6.4%
Two
2.1%
3.0%
3 or 4
5.3%
4.9%
5 to 9
5.0%
7.5%
10 to 19
7.9%
8.4%
20 to 49
4.9%
4.3%
50 or more
5.3%
5.6%
Mobile homes
3.8%
1.3%
Boats, RVs, vans, etc.
0.2%
0.0%
Median real estate property taxes paid for housing units
Self-employed workers in own not incorporated business
19,601
9,814
State government workers
13,692
15,501
Unpaid family workers
1,066
346
Industries and Occupations
Jacksonville is home to industries such as banking, healthcare, logistics, and tourism, while Lexington-Fayette is known for education, healthcare, manufacturing, and equine industries. Both cities provide diverse job opportunities based on their dominant industries.
Both cities have excellent healthcare systems. Jacksonville is home to the highly respected Mayo Clinic and UF Health Jacksonville. Lexington-Fayette houses the University of Kentucky Healthcare and the Baptist Health Lexington.
Health (county statistics)
Type
Jacksonville
Lexington-Fayette
General health status score of residents in this county from 1 (poor) to 5 (excellent)
Both cities have good infrastructure, but Jacksonville, being larger, boasts more developed transportation, healthcare, and educational facilities. Lexington-Fayette, while smaller, offers well-maintained roads, parks, and facilities, and efficient public utilities.
HMDA - Conventional home purchase loans - Applications denied
Year
Jacksonville
Lexington-Fayette
1999
5,422
756
2000
4,132
655
2001
3,038
568
2002
2,017
463
2003
3,563
529
2004
4,781
777
2005
7,134
997
2006
8,812
751
2007
5,298
517
2008
1,719
325
2009
676
230
Culture and Food
Both cities have rich cultural scenes. Jacksonville offers a broad variety of global cuisines, art galleries, music venues and museums, including notable sites like Cummer Museum of Art & Gardens. Lexington-Fayette boasts a thriving arts scene, southern food culture, and the renowned Kentucky Horse Park.
Sports Teams
For sports fans, Jacksonville is home to the Jacksonville Jaguars (NFL) and minor league baseball and soccer teams. Lexington-Fayette, while lacking professional teams, takes huge pride in the University of Kentucky's Wildcats basketball and football programs, which draw significant local and national attention.


 Jacksonville, FL
 Lexington-Fayette, KY