Jacksonville, FL vs Knoxville, TN - Advanced U.S. city comparison tool

Jacksonville, FL vs Knoxville, TN

Jacksonville, Florida, and Knoxville, Tennessee, are two vibrant US cities with varying degrees of appeal. While Jacksonville prides itself on subtropical climates, beautiful beaches, and a burgeoning economy, Knoxville offers a host of cultural, educational, and outdoor activities, set against the backdrop of the Great Smoky Mountains. This detailed comparison highlights all the essential factors like crime/safety, cost of living, education, and more, to provide an insightful view on the differences and similarities of living or visiting these two cities.
 
 
Distance between Jacksonville, FL and Knoxville, TN : 412.3 miles

Jacksonville's population is larger by 396%. Its population has grown by 218,997 people (29.8%) since 2000. The population of Knoxville has grown by 18,758 people (10.8%) during that time.

Population
Type Jacksonville Knoxville
Population 954,614 192,648
Female / male percentage 51.4% / 48.6%
51.4%
48.6%
50.8% / 49.2%
50.8%
49.2%
Racial makeup - percentage
Ethnicity JacksonvilleKnoxville
White Non-Hispanic 48.1% 71.7%
Black 29.7% 12.8%
Hispanic 11.6% 6.7%
Two or more 5.0% 6.5%
Asian 4.9% 1.7%
American Indian 0.1% 0.1%
Racial makeup - absolute values
Ethnicity JacksonvilleKnoxville
White Non-Hispanic 459,054 138,128
Black 283,190 24,571
Hispanic 110,306 12,977
Two or more 47,991 12,601
Asian 46,726 3,264
American Indian 1,019 162
Pacific Islander 544 0

Crime and Safety

Comparatively, Jacksonville has a higher crime rate than Knoxville. While the crime rate in Jacksonville is decreasing, it is still above the national average. On the other hand, Knoxville has a lower crime rate, making it slightly safer. However, it's important to note that safety can vary from neighborhood to neighborhood in both cities. Visitors and potential residents should research specific areas of interest to get a more accurate picture.

Cost of Living

The overall cost of living is higher in Jacksonville when compared to Knoxville. From housing to utility prices, residents in Jacksonville tend to pay more. On the other hand, Knoxville remains a cheaper alternative, with housing prices significantly lower than the national average. However, healthcare costs are a bit higher in Knoxville.

Income Tax

One of the financial perks of living in Jacksonville is Florida's lack of state income tax. Tennessee, too, does not impose state income tax, which is advantageous for Knoxville residents.

Property Tax

Property taxes in Jacksonville are higher compared to Knoxville. It's important to consider this while discussing the cost of living or thinking of buying property in either city.

Sales Tax

Florida has a statewide sales tax of 6%, and Jacksonville does not impose additional city sales tax. Tennessee's state sales tax is 7%, but Knoxville also charges an additional 2.25% city sales tax.
Income
Type Jacksonville Knoxville
Estimated median household income $58,621 $45,700
Estimated per capita income $32,953 $31,855
Cost of living index (U.S. average is 100) 88.3 86.5

If you make $50,000 in Knoxville, you will have to make $51,040 in Jacksonville to maintain the same standard of living.

Geographical Conditions

Being a coastal city, Jacksonville offers a variety of water-related recreational activities. Knoxville, situated in the Great Smoky Mountains, provides a variety of outdoor activities with beautiful hiking trails.
Geographical information
Type Jacksonville Knoxville
Land area 757.7 sq. miles 92.7 sq. miles
Population density 1,259.9 people per sq. mile 2,079.1 people per sq. mile
Elevation 12 feet 889 feet
Relative area comparison
Jacksonville, FL Knoxville, TN
First ancestry reported - percentage
Ancestry JacksonvilleKnoxville
English 4.5% 7.7%
Irish 4.1% 6.4%
German 3.7% 5.4%
Italian 2.2% 1.7%
Scottish 0.8% 1.3%
Scotch-Irish 0.7% 2.9%
Polish 0.6% 1.0%
French 0.5% 0.5%
Russian 0.4% 0.4%
Arab 0.3% 0.0%
Dutch 0.3% 0.5%
Ukrainian 0.3% 0.5%
French Canadian 0.2% 0.2%
Greek 0.2% 0.4%
Norwegian 0.2% 0.4%
Welsh 0.1% 0.5%
Population origin - absolute values
Ancestry JacksonvilleKnoxville
English 24,028 7,434
Irish 21,841 6,111
German 19,924 5,207
Italian 11,889 1,588
Scottish 4,351 1,238
Scotch-Irish 3,942 2,761
Polish 3,334 987
French 2,532 514
Russian 2,198 362
Dutch 1,581 437
Ukrainian 1,461 511
Arab 1,349 25
French Canadian 1,331 198
Norwegian 1,129 415
Greek 1,107 418
Swedish 945 84
West Indian 936 14
Welsh 744 499
Portuguese 658 37
Hungarian 609 126
Foreign born residents - absolute values
Type Count
Region JacksonvilleKnoxville
All 115,577 12,275
Africa 5,768 1,534
Asia 40,318 3,949
Europe 18,002 1,758
Latin America 48,096 4,874
North America 1,647 229
Oceania 393 35
Foreign born residents - percentage
Type Percentage
Region JacksonvilleKnoxville
All 12.1% 6.3%
Africa 0.6% 0.8%
Asia 4.2% 2.0%
Europe 1.9% 0.9%
Latin America 5.0% 2.5%
North America 0.2% 0.1%

Education

Jacksonville and Knoxville offer diverse educational opportunities. Jacksonville hosts several highly-rated schools and colleges, including the University of North Florida and Jacksonville University. Knoxville is the home of the University of Tennessee, and several well-regarded elementary, middle and high schools. For families with kids, the quality and availability of education could be a deciding factor.
School enrollment
Type Jacksonville Knoxville
Nursery, preschool 12,987 (5.9%) 1,837 (3.6%)
Kindergarten 12,436 (5.6%) 2,219 (4.3%)
Grade 1 to 4 49,038 (22.2%) 5,771 (11.3%)
Grade 5 to 8 44,676 (20.2%) 7,159 (14%)
Grade 9 to 12 47,624 (21.6%) 7,707 (15%)
College undergrad 44,825 (20.3%) 22,524 (44%)
Graduate or professional 9,213 (4.2%) 4,011 (7.8%)
Students in private schools - absolute values
Type Count
Grade JacksonvilleKnoxville
Grades 1 to 8 (elementary and middle school) 15,629 1,897
Grades 9 to 12 (high school) 5,824 528
Undergraduate colleges 10,300 2,024
Students in private schools - percentage
Type Percentage
Grade JacksonvilleKnoxville
Grades 1 to 8 (elementary and middle school) 16.7% 14.7%
Grades 9 to 12 (high school) 12.2% 6.9%
Undergraduate colleges 23.0% 9.0%
Educational attainment
Type Jacksonville Knoxville
Less than high school 9.2% 10.1%
High school or equiv. 27.5% 25%
Less than 1 year of college 7.2% 5.6%
1 or more years of college 14.4% 15.1%
Associate degree 9.5% 9%
Bachelor's degree 21.8% 21.7%
Master's degree 7.7% 8.2%
Profess. school degree 1.6% 3%
Doctorate degree 1.2% 2.3%
Education level (25-year-olds and older)
Type Jacksonville Knoxville
Bachelor's degree or higher 32.3% 35.2%
Graduate or professional degree 10.5% 13.5%
High school or higher 90.8% 89.9%

Work and Economy

Jacksonville's economy is diversely spread across different sectors such as finance, logistics, healthcare, and military. In contrast, Knoxville's economy revolves around a mix of manufacturing, services, retailing and wholesaling. Job growth in both markets is positive, with Jacksonville having a slightly higher job growth rate than Knoxville.

Biggest Employers

The largest employers in Jacksonville include Naval Air Station Jacksonville, Duval County Public Schools, and the City of Jacksonville. In Knoxville, the University of Tennessee, Covenant Health, and the US Department of Energy are among the major employers.
Employment and residency - absolute values
Kind JacksonvilleKnoxville
Work and live in this city 319,728 61,057
Work and live in this county 426,890 82,631
Workers who work outside the city they live in 415,889 112,833
Workers who work outside the county they live in 33,250 12,160
Working at home 73,598 10,446
Not working at home 386,542 84,345
Daytime population change due to commuting 62,223 80,035
Employment and residency - percentage
Kind JacksonvilleKnoxville
Work and live in this city 91.2% 77.2%
Work and live in this county 92.8% 87.2%
Workers who work outside the city they live in 8.8% 22.8%
Workers who work outside the county they live in 7.2% 12.8%
Working at home 16.0% 11.0%
Not working at home 84.0% 89.0%
Daytime population change due to commuting 8.5% 46.0%
Geographical mobility: all
Type all
Mobility JacksonvilleKnoxville
Same house 1 year ago 84.4% 80.9%
Moved from abroad 0.3% 0.3%
Moved within same county 9.4% 10.0%
Moved from different state 3.3% 3.8%
Moved within same state 2.6% 5.0%
Geographical mobility: Asian
Type Asian
Mobility JacksonvilleKnoxville
Same house 1 year ago 92.0% 67.3%
Moved from abroad 0.2% 7.1%
Moved within same county 4.1% 18.0%
Moved from different state 2.7% 7.6%
Moved within same state 1.0% 0%
Geographical mobility: Black
Type Black
Mobility JacksonvilleKnoxville
Same house 1 year ago 85.8% 93.6%
Moved from abroad 0.1% 0.1%
Moved within same county 9.9% 2.1%
Moved from different state 2.1% 2.5%
Moved within same state 2.1% 1.7%
Geographical mobility: White
Type White
Mobility JacksonvilleKnoxville
Same house 1 year ago 84.6% 80.9%
Moved from abroad 0.2% 0.1%
Moved within same county 8.3% 9.4%
Moved from different state 4.3% 3.9%
Moved within same state 2.6% 5.6%
Building permits
Type Average valueCount
City JacksonvilleKnoxvilleJacksonvilleKnoxville
1997 $111,100 $48,300 3,483 633
1998 $110,500 $58,800 3,796 523
1999 $119,800 $67,000 3,878 422
2000 $114,700 $67,200 3,497 423
2001 $120,300 $87,100 4,832 336
2002 $122,700 $76,400 5,397 327
2003 $126,700 $69,600 5,766 438
2004 $138,800 $87,400 6,067 728
2005 $152,600 $88,200 8,175 808
2006 $157,400 $106,800 6,291 702
2007 $159,100 $97,000 3,449 627
2008 $173,500 $105,300 2,592 241
2009 $179,500 $77,000 1,467 194
2010 $175,800 $100,500 1,397 192
2011 $181,500 $114,600 957 167
2012 $192,500 $128,800 1,310 143
2013 $0 $125,400 0 212
2014 $0 $122,500 0 181
2015 $0 $154,000 0 240
2016 $0 $187,600 0 321
2017 $0 $168,300 0 235
2018 $0 $155,400 0 335
2019 $0 $164,000 0 430
2020 $0 $197,200 0 310
2021 $0 $199,100 0 261

There were 1,310 building permits issued in Jacksonville in 2012 (353 more than in 2011) compared to 261 building permits issued in Knoxville in 2012 (94 more than in 2011).

In Jacksonville (Duval County), 47.9% voted for Democrats and 51.5% for Republicans in 2012 Presidential Election. In Knoxville (Knox County), 34.5% voted for Democrats and 63.7% for Republicans.

Elections
Type DemocratsRepublicansOther
Year JacksonvilleKnoxvilleJacksonvilleKnoxvilleJacksonvilleKnoxville
2020 51.3% 41.8% 47.5% 56.9% 1.2% 1.3%
2016 47.2% 34.9% 48.6% 58.8% 4.2% 6.3%
2012 47.9% 34.5% 51.5% 63.7% 0.6% 1.8%
2008 49.0% 37.8% 51.0% 60.9% 0.0% 1.3%
2004 41.7% 37.0% 57.9% 62.1% 0.3% 0.9%
2000 40.9% 40.6% 57.7% 57.9% 1.4% 1.5%
1996 44.2% 22.6% 50.0% 74.4% 5.8% 3.0%
Breakdown of population affiliated with a religious congregation
Type AdherentsCongregations
Religion JacksonvilleKnoxvilleJacksonvilleKnoxville
SOUTHERN BAPTIST CONVENTION 15.8% 29.7% 22.3% 32.9%
CATHOLIC CHURCH 9.0% 5.1% 2.8% 1.3%
EPISCOPAL CHURCH 1.2% 1.0% 2.3% 1.4%
MUSLIM ESTIMATE 0.7% 0.2% 0.6% 0.5%
EVANGELICAL LUTHERAN CHURCH IN AMERICA 0.3% 0.5% 0.9% 0.9%
LUTHERAN CHURCH 0.3% 0.4% 0.7% 0.5%
SEVENTH DAY ADVENTIST CHURCH 0.3% 0.3% 1.4% 1.3%
PRESBYTERIAN CHURCH IN AMERICA 0.1% 0.4% 0.9% 0.7%

Weather

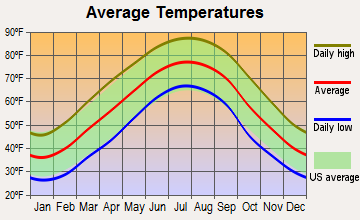
Weather is one of the biggest contrasts between Jacksonville and Knoxville. Jacksonville boasts a subtropical climate, boasting warm, humid summers and mild winters which is great for beach-lovers. However, it does experience more severe weather, including hurricanes. Knoxville, on the other hand, has a humid subtropical climate with four distinct seasons, including relatively mild summers and cooler winters. However, it's worth noting that Knoxville is considerably less prone to severe weather.
Weather and climate
Type Jacksonville Knoxville
Temperature - Average 68.3°F 57.4°F
Humidity - Average morning or afternoon humidity 78.4% 76.7%
Humidity - Differences between morning and afternoon humidity 44% 39%
Humidity - Maximum monthly morning or afternoon humidity 92% 90%
Humidity - Minimum monthly morning or afternoon humidity 48% 51%
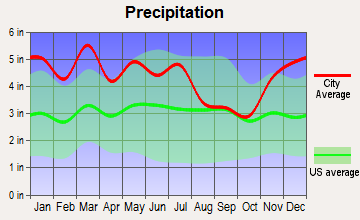
Precipitation - Yearly average 51.8 in 52.1 in
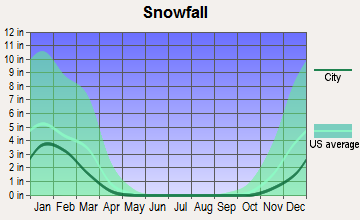
Snowfall - Yearly average 0 in 18 in
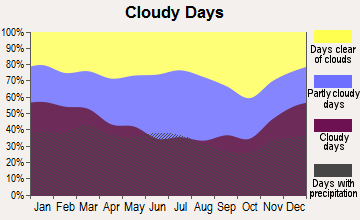
Clouds - Number of days clear of clouds 15.8% 16.8%
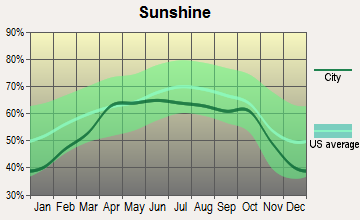
Sunshine amount - Average 69.6% 62.4%
Sunshine amount - Differences during a year 16% 26%
Sunshine amount - Maximum monthly 74% 67%
Sunshine amount - Minimum monthly 58% 41%
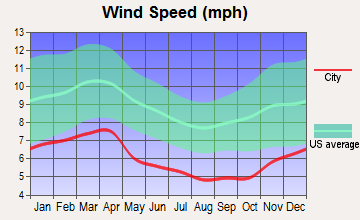
Wind speed - Average 7.2 mph 6.5 mph

Average climate in Jacksonville, Florida

Chicago, Illinois average temperatures Chicago, Illinois average precipitation Chicago, Illinois humidity Chicago, Illinois wind speed Chicago, Illinois snowfall Chicago, Illinois sunshine Chicago, Illinois clear and cloudy days
 

Average climate in Knoxville, Tennessee

Chicago, Illinois average temperatures Chicago, Illinois average precipitation Chicago, Illinois humidity Chicago, Illinois wind speed Chicago, Illinois snowfall Chicago, Illinois sunshine Chicago, Illinois clear and cloudy days
 

Air pollution
Type AQICONO2OZONEPBPM10PM25SO2
Year JacksonvilleKnoxvilleJacksonvilleKnoxvilleKnoxville JacksonvilleKnoxvilleJacksonvilleKnoxvilleKnoxville JacksonvilleKnoxvilleJacksonvilleKnoxville
2018 78 71 N/A 0.17 0.6 N/A 24.5 28.8 N/A N/A 17.0 N/A 7.1 9.4 N/A 0.6
2017 74 68 N/A 0.16 0.6 N/A 24.7 30.6 N/A N/A 16.5 N/A 5.8 8.5 0.7 0.2
2016 65 71 0.50 0.18 0.8 N/A 24.9 32.7 N/A N/A 19.1 N/A 5.2 N/A 0.4 0.5
2015 63 68 0.35 0.17 0.8 N/A 25.4 28.8 N/A 0.009 26.0 N/A 4.9 N/A 0.3 1.8
2014 66 62 0.27 0.14 N/A N/A 24.3 29.2 N/A 0.011 23.7 N/A 5.9 N/A 0.7 1.6
2013 68 60 0.18 0.14 N/A N/A 23.0 28.9 N/A N/A 22.3 N/A 5.3 N/A 0.7 0.6
2012 66 92 0.10 0.16 N/A N/A 24.0 32.1 N/A N/A 24.9 N/A 5.8 N/A 0.6 0.4
2011 88 91 0.28 0.20 N/A N/A 26.6 34.0 N/A N/A 28.1 N/A 8.1 N/A 0.8 0.6
2010 77 94 0.31 0.18 0.9 N/A 26.4 32.3 N/A N/A 29.2 N/A 7.1 N/A 0.8 0.9
2009 72 66 0.16 0.17 0.7 N/A 25.0 28.7 N/A 0.018 23.6 N/A 8.5 N/A 0.6 0.7
2008 75 96 0.15 0.18 N/A N/A 27.6 33.2 N/A 0.023 32.5 N/A 10.0 N/A 0.9 1.5
2007 92 105 0.29 0.16 N/A N/A 28.4 35.5 N/A 0.017 36.0 N/A 11.4 N/A 1.2 1.6
2006 87 98 0.35 N/A N/A N/A 29.0 30.2 N/A 0.024 36.3 N/A 10.8 N/A 1.4 2.3
2005 93 108 0.42 N/A N/A N/A 26.5 27.7 N/A N/A 34.6 N/A 12.2 N/A 1.8 N/A
2004 92 103 0.40 N/A N/A N/A 25.2 24.9 N/A 0.015 41.2 N/A 12.4 N/A 1.4 N/A
2003 55 112 0.43 N/A N/A N/A 21.6 23.4 N/A 0.010 40.7 N/A N/A N/A 1.6 2.8
2002 59 112 0.49 N/A N/A N/A 22.2 28.3 0.003 N/A 35.1 N/A N/A N/A 1.7 3.4
2001 74 109 0.49 N/A N/A N/A 24.0 28.9 0.009 N/A 35.6 N/A N/A N/A 2.5 3.3
2000 85 122 0.52 N/A 11.8 N/A 25.1 25.2 0.017 N/A 34.2 N/A N/A N/A 3.0 2.5
Natural disasters
Type Jacksonville Knoxville
Tornado activity compared to U.S. average 75.2% 64.8%
Earthquake activity compared to U.S. average 18.1% 177.6%
Natural disasters compared to U.S. average 24% 13%

Transportation

Jacksonville is served by the Jacksonville Transportation Authority which provides buses, trolley-replica buses, and a monorail system. Knoxville's public transportation is handled by Knoxville Area Transit (KAT), offering buses, trolleys, and paratransit services.
Transport
Type Jacksonville Knoxville
Amtrak stations 1 0
Amtrak stations nearby 1 0
FAA registered aircraft 566 366
FAA registered aircraft manufacturers and dealers 34 19
Means of transportation to work
Type Jacksonville Knoxville
Bicycle 0.2% 0%
Bus 1.1% 0.6%
Carpooled 9% 5.5%
Car alone 86.5% 91.4%
Motorcycle 0.2% 0.1%
Taxicab 0.2% 0.1%
Walked 1.2% 1.5%
Means of transportation to work
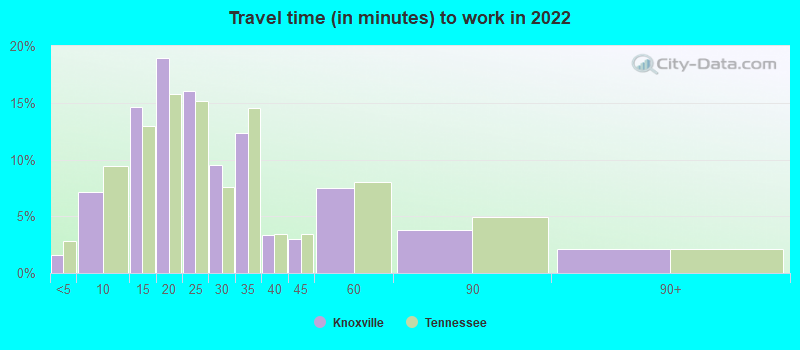
Average travel time to work
Type Jacksonville Knoxville
Average 27.5 min 26.5 min
Other means 25 min 20.9 min
Public transportation 43.7 min 33.4 min
Travel time to work
Time leaving to work
Travel time to work
Time leaving to work
Private vehicle occupancy
Type Jacksonville Knoxville
Average 1.1 1.1
Drove alone 89.4% 91.4%
In 2 person carpool 8% 6.8%
In 3 person carpool 1.7% 0.7%
In 4 person carpool 0.7% 0.5%
In 5-6 person carpool 0% 0.2%
In 7+ person carpool 0.2% 0%

How many people usually rode to work in the car, truck or van.

Real Estate

In Jacksonville, the real estate market is bustling, characterized by a mix of traditional neighborhoods, luxury waterfront properties, and urban condo living. Conversely, in Knoxville, the housing market is more affordable, with diverse options, from historic homes to new construction.

Neighborhoods

Jacksonville and Knoxville feature a variety of neighborhoods catering to different lifestyles. Riverside and San Marco are trendy spots in Jacksonville with a bustling arts scene, while West Knoxville and Old City are known for their shopping and dining facilities in Knoxville.
Houses and residents
Type Jacksonville Knoxville
Houses 422,315 94,457
Average household size (people) 2.5 2.2
Median year apartment built 1985 1978
Median year house/condo built 1987 1964
Length of stay in the house since moving in 12.5 years 13.2 years
Houses occupied 386,283 (91.5%) 85,151 (90.1%)
Houses occupied by owners 226,429 (58.6%) 40,535 (47.6%)
Houses occupied by renters 159,854 (41.4%) 44,616 (52.4%)
Median rent asked for vacant for-rent units $1,444 $882.25
Median monthly housing costs $1,154 $945
Median price asked for vacant for-sale houses and condos $260,045 $134,979
Estimated median house or condo value $239,400 $193,600
Median numbers of rooms 5.6 5
Median number of rooms in apartments 4.3 4.1
Median number of rooms in houses and condos 6.3 6.2
Median house price - detached houses $282,276 $261,152
Median house price - in 2-unit structures $177,341 $185,738
Median house price - in 3-to-4-unit structures $144,947 $206,216
Median house price - in 5 or more unit structures $220,508 $237,681
Median house price - mobile homes $87,589 $92,571
Median house price - Townhouses or other attached units $213,709 $225,200
Median house price - All housing units $266,926 $256,619
Median house age 36 49
Renting percentage 38.3% 50.8%
Housing density (houses/condos per square mile) 557.4 1,019.4
House value disparities 33.2% 34.8%
Household income disparities 44.2% 47.9%
Median household income for houses/condes with a mortgage $83,160 $76,198
Median household income for apartments without a mortgage $59,777 $58,442
Housing units without a mortgage 2,439 (1.6%) 497 (1.9%)
Housing units with both a second mortgage and home equity loan 8,460 (5.5%) 1,206 (4.7%)
Housing units with a mortgage 150,468 (98.4%) 25,330 (98.1%)
Housing units with a home equity loan 255 (0.2%) 167 (0.6%)
Housing units with a second mortgage 11,378 (7.4%) 1,649 (6.4%)
House/condo owner moved in on average (years ago) 10 10
House/condo renter moved in on average (years ago) 1 1
Housing units lacking complete kitchen facilities 1.5% 2.6%
Housing units lacking complete plumbing facilities 1.4% 1.8%
Housing units in structures
Housing units in structures JacksonvilleKnoxville
One, detached 59.4% 54.1%
One, attached 6.1% 5.2%
Two 2.1% 3.2%
3 or 4 5.3% 4.2%
5 to 9 5.0% 8.3%
10 to 19 7.9% 9.2%
20 to 49 4.9% 6.5%
50 or more 5.3% 8.7%
Mobile homes 3.8% 0.7%
Boats, RVs, vans, etc. 0.2% 0.0%
Median real estate property taxes paid for housing units
Type Jacksonville Knoxville
With mortgages $1,976 (0.8%) $1,375 (0.7%)
With no mortgages $1,563 (0.7%) $1,501 (0.8%)
Marital status
Type Jacksonville Knoxville
Divorced 14.3% 13.6%
Never married 35.3% 45.7%
Now married 43.3% 33.5%
Separated 1.9% 1.3%
Widowed 5.1% 5.9%
Class of workers - percentage
Class of Workers JacksonvilleKnoxville
Employee of private company 69.3% 69.2%
Private not-for-profit wage and salary workers 9.4% 8.6%
Local government workers 6.3% 4.2%
Self-employed workers in own not incorporated business 4.3% 6.6%
Self-employed in own incorporated business 4.1% 1.9%
Federal government workers 3.3% 1.8%
State government workers 3.0% 7.5%
Unpaid family workers 0.2% 0.2%
Class of workers - absolute values
Class of Workers JacksonvilleKnoxville
Employee of private company 314,902 66,776
Federal government workers 15,074 1,744
Local government workers 28,766 4,038
Private not-for-profit wage and salary workers 42,775 8,262
Self-employed in own incorporated business 18,575 1,875
Self-employed workers in own not incorporated business 19,601 6,351
State government workers 13,692 7,257
Unpaid family workers 1,066 197

Industries and Occupations

Jacksonville houses multiple thriving industries such as healthcare, financial services, aerospace, and defense. Conversely, Knoxville's significant industries comprise advanced manufacturing, retail, and health care with numerous opportunities in administration and sales.
Most common male industries
Industry JacksonvilleKnoxville
Retail trade 12.8% 11.5%
Construction 10.4% 13.9%
Transportation and warehousing 10.3% 5.5%
Finance and insurance 8.0% 3.7%
Accommodation and food services 7.9% 8.2%
Professional, scientific, and technical services 7.7% 7.5%
Manufacturing 7.4% 9.9%
Administrative and support and waste management services 6.8% 4.9%
Other services, except public administration 5.6% 4.9%
Public administration 5.1% 2.7%
Health care and social assistance 5.0% 7.9%
Educational services 3.7% 9.1%
Wholesale trade 3.2% 2.9%
Real estate and rental and leasing 1.8% 1.8%
Arts, entertainment, and recreation 1.8% 2.3%
Utilities 1.3% 1.1%
Information 0.8% 1.1%
Management of companies and enterprises 0.2% 0.3%
Agriculture, forestry, fishing and hunting 0.2% 0.6%
Mining, quarrying, and oil and gas extraction 0.0% 0.3%
Most common female industries
Industry JacksonvilleKnoxville
Health care and social assistance 22.6% 20.0%
Finance and insurance 11.4% 6.3%
Retail trade 11.1% 15.1%
Educational services 8.6% 12.3%
Accommodation and food services 8.4% 11.7%
Professional, scientific, and technical services 7.3% 7.6%
Public administration 4.6% 2.1%
Other services, except public administration 4.5% 4.4%
Administrative and support and waste management services 4.4% 5.2%
Manufacturing 3.9% 5.4%
Transportation and warehousing 3.5% 3.0%
Construction 2.4% 1.4%
Arts, entertainment, and recreation 1.9% 0.6%
Real estate and rental and leasing 1.7% 0.9%
Wholesale trade 1.5% 1.2%
Information 1.4% 2.2%
Utilities 0.7% 0.4%
Most common male occupations
Occupation JacksonvilleKnoxville
Management occupations 11.4% 10.9%
Sales and related occupations 9.5% 7.2%
Office and administrative support occupations 8.9% 7.1%
Transportation occupations 8.4% 6.3%
Construction and extraction occupations 7.4% 9.3%
Installation, maintenance, and repair occupations 6.3% 4.0%
Material moving occupations 5.9% 5.2%
Food preparation and serving related occupations 5.6% 6.6%
Computer and mathematical occupations 5.5% 3.6%
Business and financial operations occupations 5.4% 4.2%
Production occupations 4.4% 6.9%
Building and grounds cleaning and maintenance occupations 4.2% 3.8%
Architecture and engineering occupations 2.6% 2.6%
Educational instruction, and library occupations 2.3% 3.8%
Health diagnosing and treating practitioners and other technical occupations 1.8% 3.3%
Law enforcement workers including supervisors 1.7% 0.4%
Arts, design, entertainment, sports, and media occupations 1.5% 3.7%
Firefighting and prevention, and other protective service workers including supervisors 1.4% 1.6%
Health technologists and technicians 1.4% 0.5%
Personal care and service occupations 1.0% 1.6%
Most common female occupations
Occupation JacksonvilleKnoxville
Office and administrative support occupations 19.3% 15.0%
Management occupations 10.2% 10.5%
Sales and related occupations 8.7% 9.7%
Health diagnosing and treating practitioners and other technical occupations 7.9% 7.9%
Educational instruction, and library occupations 7.4% 7.3%
Business and financial operations occupations 6.2% 6.4%
Food preparation and serving related occupations 5.8% 7.6%
Healthcare support occupations 4.6% 5.8%
Building and grounds cleaning and maintenance occupations 3.7% 2.8%
Community and social service occupations 3.1% 1.5%
Personal care and service occupations 2.9% 3.5%
Arts, design, entertainment, sports, and media occupations 2.8% 3.4%
Production occupations 2.7% 4.3%
Material moving occupations 2.6% 2.2%
Health technologists and technicians 2.5% 2.9%
Computer and mathematical occupations 2.3% 1.7%
Legal occupations 1.5% 1.7%
Firefighting and prevention, and other protective service workers including supervisors 1.3% 0.6%
Transportation occupations 1.3% 2.7%
Life, physical, and social science occupations 0.9% 1.4%
Food environment data per 10,000 residents
Food environment statistics JacksonvilleKnoxville
Number of convenience stores (no gas) 3.3 3.8
Number of convenience stores (with gas) 1.5 1.4
Number of full-service restaurants 7.3 7.4
Number of grocery stores 2.7 1.8
Number of supercenters and club stores 0.1 0.1
Food environment - absolute values
Food environment statistics JacksonvilleKnoxville
Number of convenience stores (no gas) 281 162
Number of convenience stores (with gas) 130 58
Number of full-service restaurants 614 313
Number of grocery stores 225 74
Number of supercenters and club stores 10 5
Obesity and diabetes
Food environment statistics rate JacksonvilleKnoxville
Adult diabetes rate 10.4% 12.0%
Adult obesity rate 27.5% 27.5%
Low-income preschool obesity rate 10.9% 13.7%

Health Care

Both cities have numerous healthcare facilities. Jacksonville homes world-renowned healthcare facilities like Mayo Clinic and Wolfson Children's Hospital. Knoxville's healthcare is anchored by the University of Tennessee Medical Center and East Tennessee Children's Hospital.
Health (county statistics)
Type Jacksonville Knoxville
General health status score of residents in this county from 1 (poor) to 5 (excellent) 3.4 3.3
Average weight of females (lbs) 163.1 lbs 165.4 lbs
Average weight of males (lbs) 198.5 lbs 203.3 lbs
Residents visited a dentist within the past year 64.1% 62.9%
Residents exercised in the past month 69.2% 69.1%
Adult residents drank alcohol in the past 30 days 52.3% 43.4%
Residents smoked 100+ cigarettes in their lives 46.4% 48%

Fatal vehicle accidents per 100,000 residents
Type Total count per 100,000Drunk per 100,000Fatal count per 100,000Pedestrian count per 100,000Person count per 100,000Vehicle count per 100,000
Year JacksonvilleKnoxvilleJacksonvilleKnoxvilleJacksonvilleKnoxvilleJacksonvilleKnoxvilleJacksonvilleKnoxvilleJacksonvilleKnoxville
2021 18.4 26.0 0.0 0.0 19.8 27.5 5.3 6.7 37.8 65.4 29.4 50.9
2020 18.1 16.3 4.7 4.7 19.5 16.3 6.1 3.1 35.1 33.1 27.8 25.7
2019 16.5 22.4 4.2 5.9 17.0 24.0 5.9 4.8 33.7 56.5 25.4 40.5
2018 14.2 21.9 4.2 5.3 15.5 22.4 5.2 3.7 31.9 60.2 22.2 38.9
2017 16.2 15.0 4.1 3.2 16.6 17.6 5.3 6.9 36.4 33.7 26.1 24.1
2016 16.2 14.0 4.9 3.2 17.2 16.7 5.3 2.2 34.7 29.7 25.4 23.2
2015 13.6 13.6 4.2 3.8 14.7 13.6 4.8 3.8 27.2 39.1 20.9 21.2
2014 12.3 15.7 4.7 1.1 13.0 17.9 4.2 3.8 29.5 54.3 18.9 28.2
2013 14.6 20.7 5.2 6.5 15.5 21.8 4.9 2.2 28.0 41.5 20.9 31.1
2012 13.3 18.1 5.0 6.6 13.7 20.3 4.8 2.2 26.8 36.8 19.6 27.4
2011 9.9 18.3 3.4 7.7 10.3 19.4 3.1 3.3 20.1 38.7 15.6 27.7
2010 12.4 17.9 4.7 5.6 13.0 18.4 3.3 2.2 25.1 30.7 18.4 25.2
2009 12.4 13.5 4.2 0.5 13.5 14.0 4.1 1.6 33.4 29.7 17.8 19.4
2008 14.2 12.5 5.9 0.5 14.7 12.5 2.5 1.6 35.7 25.4 21.7 20.0
2007 18.3 16.4 8.2 8.2 19.6 16.9 5.1 3.3 45.3 37.1 28.8 25.1
2006 16.3 19.8 5.4 4.9 17.0 22.0 3.8 3.3 45.2 51.1 27.2 34.6
2005 17.2 21.1 7.0 4.4 19.1 22.8 5.1 0.0 47.9 51.1 29.6 33.3
2004 15.0 21.3 5.7 4.5 15.8 23.0 4.4 1.7 37.9 55.0 22.5 32.6
2003 14.7 18.0 4.3 1.7 15.4 20.8 2.6 3.9 38.8 52.4 23.4 27.6
2002 13.6 21.5 4.5 8.5 15.4 25.4 3.0 1.1 36.8 54.8 20.9 35.0
2001 14.4 19.8 7.2 2.8 15.9 20.3 3.9 3.4 40.1 43.5 22.3 27.7
2000 13.5 22.4 5.7 9.2 13.9 23.0 3.5 2.9 33.7 57.5 19.3 35.7
1999 14.3 19.4 6.2 7.4 15.6 20.0 4.0 5.1 43.7 56.0 23.2 32.0
1998 12.2 14.5 3.6 2.9 13.7 16.2 4.8 1.2 36.6 38.7 18.3 24.3
1997 12.3 13.3 2.7 4.6 14.4 15.1 3.6 1.7 31.1 36.5 18.6 20.3
1996 14.4 20.3 3.8 4.7 15.8 22.1 3.9 3.5 40.5 54.6 21.4 33.7
1995 14.6 15.8 4.0 5.3 15.5 16.9 2.8 1.2 35.8 49.1 22.3 29.8
1994 13.6 23.4 4.7 10.5 15.5 25.7 3.7 3.5 39.1 58.4 22.5 33.9
1993 11.9 14.0 4.9 5.3 12.7 15.2 3.3 4.1 37.3 40.3 21.0 20.5
1992 11.4 17.5 5.8 9.9 12.0 17.5 2.9 3.5 30.9 55.3 16.2 33.8
1991 10.9 17.4 5.6 8.7 12.7 20.3 2.4 6.4 27.2 49.3 16.5 27.8
1990 14.0 17.9 7.3 8.1 15.2 19.1 0.0 0.0 36.3 50.3 20.8 33.0
1989 17.2 15.7 8.9 6.0 18.1 16.3 0.0 0.0 45.3 33.7 25.7 21.7
1988 14.7 23.9 6.6 13.8 16.1 25.7 0.0 0.0 40.6 65.2 22.5 40.7
1987 13.2 17.8 6.5 5.9 15.6 18.4 0.0 0.0 38.6 36.9 21.8 29.2
1986 18.7 16.6 6.5 7.7 20.2 18.9 0.0 0.0 50.8 31.3 28.0 22.5
1985 13.3 19.4 4.7 8.2 14.1 22.3 0.0 0.0 36.3 50.6 21.4 29.4
1984 15.4 11.7 6.4 7.6 17.3 13.4 0.0 0.0 39.4 26.3 23.9 18.1
1983 19.1 9.9 8.0 5.8 21.4 10.5 0.0 0.0 48.7 19.8 26.3 12.2
1982 18.8 14.4 5.9 3.5 19.4 15.6 0.0 0.0 46.8 32.4 25.0 20.2
1981 17.9 12.6 3.1 5.7 18.8 15.5 0.0 0.0 45.8 35.6 24.4 19.0
1980 19.6 16.0 4.2 5.7 21.2 16.6 0.0 0.0 51.0 36.0 25.9 22.3
1979 22.1 19.4 5.8 12.6 24.3 21.7 0.0 0.0 53.8 45.1 28.4 29.1
1978 18.3 23.4 4.8 8.0 19.9 26.3 0.0 0.0 52.8 56.0 24.7 33.2
1977 16.8 12.6 4.7 4.0 17.7 14.9 0.0 0.0 44.4 38.3 22.7 23.4
1976 18.8 22.3 1.4 6.9 19.9 26.9 0.0 0.0 48.5 62.3 24.4 32.0
1975 18.9 22.3 1.5 6.9 20.0 26.9 0.0 0.0 48.9 62.4 24.5 32.0

Fatal vehicle accidents
Type Total countDrunkFatal countPedestrian countPerson countVehicle count
Year JacksonvilleKnoxvilleJacksonvilleKnoxvilleJacksonvilleKnoxvilleJacksonvilleKnoxvilleJacksonvilleKnoxvilleJacksonvilleKnoxville
1975 104 39 8 12 110 47 0 0 269 109 135 56
1976 104 39 8 12 110 47 0 0 269 109 135 56
1977 94 22 26 7 99 26 0 0 248 67 127 41
1978 103 41 27 14 112 46 0 0 297 98 139 58
1979 125 34 33 22 138 38 0 0 305 79 161 51
1980 112 28 24 10 121 29 0 0 291 63 148 39
1981 104 22 18 10 109 27 0 0 266 62 142 33
1982 111 25 35 6 115 27 0 0 277 56 148 35
1983 115 17 48 10 129 18 0 0 293 34 158 21
1984 94 20 39 13 106 23 0 0 241 45 146 31
1985 83 33 29 14 88 38 0 0 226 86 133 50
1986 118 28 41 13 128 32 0 0 321 53 177 38
1987 85 30 42 10 100 31 0 0 248 62 140 49
1988 96 40 43 23 105 43 0 0 265 109 147 68
1989 114 26 59 10 120 27 0 0 300 56 170 36
1990 94 31 49 14 102 33 0 0 244 87 140 57
1991 74 30 38 15 86 35 16 11 185 85 112 48
1992 78 30 40 17 82 30 20 6 212 95 111 58
1993 82 24 34 9 88 26 23 7 258 69 145 35
1994 95 40 33 18 108 44 26 6 273 100 157 58
1995 103 27 28 9 109 29 20 2 252 84 157 51
1996 102 35 27 8 112 38 28 6 288 94 152 58
1997 88 23 19 8 103 26 26 3 223 63 133 35
1998 88 25 26 5 99 28 35 2 265 67 132 42
1999 104 34 45 13 114 35 29 9 319 98 169 56
2000 99 39 42 16 102 40 26 5 248 100 142 62
2001 108 35 54 5 119 36 29 6 300 77 167 49
2002 103 38 34 15 117 45 23 2 279 97 159 62
2003 113 32 33 3 118 37 20 7 298 93 180 49
2004 117 38 44 8 123 41 34 3 295 98 175 58
2005 135 38 55 8 150 41 40 0 377 92 233 60
2006 130 36 43 9 136 40 30 6 361 93 217 63
2007 147 30 66 15 158 31 41 6 365 68 232 46
2008 115 23 48 1 119 23 20 3 289 47 176 37
2009 101 25 34 1 110 26 33 3 272 55 145 36
2010 102 32 39 10 107 33 27 4 206 55 151 45
2011 82 33 28 14 85 35 26 6 166 70 129 50
2012 111 33 42 12 115 37 40 4 224 67 164 50
2013 123 38 44 12 131 40 41 4 236 76 176 57
2014 105 29 40 2 111 33 36 7 252 100 161 52
2015 118 25 36 7 127 25 42 7 236 72 181 39
2016 143 26 43 6 152 31 47 4 306 55 224 43
2017 145 28 37 6 148 33 47 13 325 63 233 45
2018 128 41 38 10 140 42 47 7 288 113 201 73
2019 151 42 38 11 155 45 54 9 308 106 232 76
2020 172 31 45 9 185 31 58 6 334 63 264 49
2021 176 50 0 0 189 53 51 13 361 126 281 98
Local government: full-time employees
Job JacksonvilleKnoxville
Airports 289 0
Correction 870 0
Financial administration 693 83
Firefighters 1,283 319
Fire - other 92 14
Health 122 0
Judicial and legal 102 27
Local libraries 319 0
Other and unallocable 814 124
Other government administration 577 48
Parks and recreation 220 42
Police - other 572 95
Police protection - officers 1,681 386
Sewerage 350 224
Solid waste management 179 184
Streets and highways 18 121
Totals for government 9,314 2,521
Water supply 146 133
Water transport and terminals 146 0
Welfare 142 0
Local government: part-time employees
Job JacksonvilleKnoxville
Airports 1 0
Financial administration 3 1
Gas supply 1 7
Natural resources 0 1
Other and unallocable 0 1
Other government administration 0 10
Parks and recreation 0 89
Police - other 0 25
Sewerage 0 9
Streets and highways 0 1
Totals for government 9 170
Water supply 0 5
Water transport and terminals 4 0
Place of birth - Foreign born
Residents JacksonvilleKnoxville
All residents 12.3% 6.2%
American Indian / Alaska Native residents 3.4% 26.2%
Asian residents 73.5% 73.8%
Black or African American residents 5.7% 8.0%
Native Hawaiian / Pacific Islander residents 24.9% 0.0%
Other race residents 35.6% 38.1%
Two or more races residents 16.7% 16.1%
White residents 6.9% 1.8%
White alone, not Hispanic / Latino residents 5.9% 2.5%
Place of birth - Native, outside of US
Residents JacksonvilleKnoxville
All residents 2.6% 0.8%
American Indian / Alaska Native residents 7.0% 0.0%
Asian residents 1.0% 5.6%
Black or African American residents 1.3% 0.3%
Native Hawaiian / Pacific Islander residents 10.5% 0.0%
Other race residents 15.2% 6.1%
Two or more races residents 7.6% 1.9%
White residents 1.4% 0.4%
White alone, not Hispanic / Latino residents 1.3% 0.6%
Place of birth - Born in state of residence
Residents JacksonvilleKnoxville
All residents 46.9% 58.8%
American Indian / Alaska Native residents 47.8% 25.6%
Asian residents 14.5% 12.6%
Black or African American residents 62.0% 76.2%
Native Hawaiian / Pacific Islander residents 13.0% 0.0%
Other race residents 27.6% 39.1%
Two or more races residents 45.1% 53.9%
White residents 43.9% 58.0%
White alone, not Hispanic / Latino residents 45.7% 58.3%
Place of birth - Born in other state
Residents JacksonvilleKnoxville
All residents 38.2% 34.2%
American Indian / Alaska Native residents 41.8% 48.2%
Asian residents 10.9% 8.0%
Black or African American residents 30.9% 15.5%
Native Hawaiian / Pacific Islander residents 51.5% 100.0%
Other race residents 21.6% 16.8%
Two or more races residents 30.6% 28.1%
White residents 47.8% 39.8%
White alone, not Hispanic / Latino residents 47.0% 38.7%
English speakers (speaking English at home)
Type Jacksonville Knoxville
Born in the United States residents 94.4% 97.3%
Foreign born residents 22.4% 27.3%
Native, born elsewhere residents 47.2% 78.4%
Total residents 84.3% 92.4%
Mechanisms of homicide
Mechanism JacksonvilleKnoxville
Homicides from 2000 to 2006 721 181
Cut / Pierce 76 28
Firearm 492 116
Struck by / against 22 0
Suffocation 31 0
Mechanisms of homicide per 1,000,000 residents
Mechanism JacksonvilleKnoxville
Homicides from 2000 to 2006 126.9 64.8
Cut / Pierce 13.4 10.0
Firearm 86.6 41.5
Struck by / against 3.9 0
Suffocation 5.5 0
Mechanisms of suicide per 1,000,000 residents
Mechanism JacksonvilleKnoxville
Suicides from 2000 to 2006 140.7 130.4
Firearm 79.2 76.6
Poisoning 27.5 21.8
Suffocation 22.7 22.2

Infrastructure

Jacksonville boasts a plethora of modern infrastructure and amenities. As the largest city area-wise in the US, it has varied residential, commercial and industrial spaces. Meanwhile, Knoxville, while smaller, has a compact city design featuring a blend of historical and modern architecture, lending it a unique charm.
Infrastructure
Type Jacksonville Knoxville
Hospitals 25 20
TV stations 17 15
Arenas or stadiums 2 2
Bank branches located here 191 152
Bank institutions located here 31 38
Main business address for public companies 23 6
Drinking water stations with no reported violations in the past 20 6
Drinking water stations with reported violations in the past 20 14

Schools

School facilities
Type Jacksonville Knoxville
Private elementary/middle schools 38 21
Private high schools 56 14
Public elementary/middle schools 145 56
Public high schools 55 20
Colleges/Universities 30 13
HMDA - Conventional home purchase loans - Applications denied
Year JacksonvilleKnoxville
1999 5,422 1,372
2000 4,132 1,152
2001 3,038 886
2002 2,017 1,367
2003 3,563 1,014
2004 4,781 1,080
2005 7,134 1,218
2006 8,812 1,159
2007 5,298 701
2008 1,719 329
2009 676 222

Culture and Food

Both cities offer an eclectic cultural scene. Jacksonville is known for its flourishing arts scene, featuring numerous galleries and a vibrant street-art scene. Meanwhile, Knoxville is home to a thriving live music and food scene. In terms of food, both cities boast a mix of local and international cuisine, but seafood is especially prominent in Jacksonville, while Knoxville is known for southern BBQ.

Sports Teams

Sports fans will find plenty to cheer for in both cities. Jacksonville hosts the NFL's Jacksonville Jaguars, and minor league baseball’s Jacksonville Jumbo Shrimp. Knoxville doesn't have major league teams, but the University of Tennessee's Volunteers teams have a dedicated fan base.
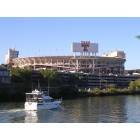
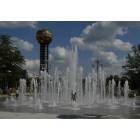