Jacksonville, Florida and Kansas City, Missouri are two dynamic cities, each with a distinct ambiance and unique opportunities. Jacksonville, the largest city in the continental U.S., offers a blend of urban and beach life, while Kansas City is renowned for its jazz music, barbecue culture, and vibrant art scene. Here's an elaborate comparison of these two cities considering key factors like crime and safety, weather, cost of living, education, and more.
Distance between
Jacksonville, FL and
Kansas City, MO : 948.3 miles
Jacksonville's population is larger by 88%. Its population has grown by 218,997 people (29.8%) since 2000. The population of Kansas City has grown by 66,849 people (15.1%) during that time.
In terms of safety, both cities have crime rates higher than the national average, with precautions recommended in certain areas. Jacksonville, due to its large size, has varied crime rates depending on the neighborhood. Conversely, Kansas City has seen a steady decline in crime rates over the years however, some areas are still considered risky. Special measures are taken by both city authorities to ensure safety in major tourist spots.
Cost of Living
The cost of living varies significantly between the two cities. Jacksonville is generally more affordable than Kansas City, especially in terms of housing. However, goods and services tend to be slightly more expensive in Jacksonville than in Kansas City, balancing overall costs.
Income Tax
There is no state income tax in Florida, which can be a significant advantage for Jacksonville residents. Missouri imposes a state income tax that varies from 1.5% to 5.9%, depending on the income level.
Property Tax
Property tax rates are relatively low in both cities, with Jacksonville having an average rate of 0.93% and Kansas City having an average rate of 1.02%.
Sales Tax
Florida doesn't have a state sales tax, but Jacksonville has a 7% city sales tax. Missouri has a state sales tax of 4.23%, and Kansas City has a city sales tax of 7.35%, making consumer goods generally more expensive.
Income
Type
Jacksonville
Kansas City
Estimated median household income
$58,621
$63,396
Estimated per capita income
$32,953
$36,456
Cost of living index (U.S. average is 100)
88.3
87.3
If you make $50,000 in Kansas City, you will have to make $50,573 in Jacksonville to maintain the same standard of living.
Geographical Conditions
While Jacksonville is located on Florida's East Coast, offering beachfront living, Kansas City enjoys the charm of being in the heartland, with rolling hills and rivers.
Both cities boast of strong educational systems. Jacksonville houses top-notch schools and universities such as the University of North Florida and Jacksonville University. Kansas City also has a strong education sector, with notable institutions like the University of Missouri–Kansas City and Rockhurst University.
Jacksonville's economy is heavily dependent on military and defense, healthcare, logistics, and banking sectors. On the other hand, Kansas City has a diverse economy with sectors like telecommunications, agriculture, manufacturing and service playing significant roles.
Biggest Employers
In Jacksonville, some of the biggest employers include Naval Air Station Jacksonville, Bank of America, and Baptist Health. Kansas City is home to several large employers as well, including Sprint Corporation, Hallmark Cards, and H&R Block.
In Jacksonville (Duval County), 47.9% voted for Democrats and 51.5% for Republicans in 2012 Presidential Election. In Kansas City (Jackson County), 58.9% voted for Democrats and 39.3% for Republicans.
Elections
Type
Democrats
Republicans
Other
Year
Jacksonville
Kansas City
Jacksonville
Kansas City
Jacksonville
Kansas City
2020
51.3%
60.1%
47.5%
38.1%
1.2%
1.8%
2016
47.2%
55.5%
48.6%
38.1%
4.2%
6.4%
2012
47.9%
58.9%
51.5%
39.3%
0.6%
1.7%
2008
49.0%
62.1%
51.0%
36.8%
0.0%
1.1%
2004
41.7%
58.2%
57.9%
41.4%
0.3%
0.4%
2000
40.9%
59.0%
57.7%
38.4%
1.4%
2.5%
1996
44.2%
56.2%
50.0%
34.3%
5.8%
9.5%
Breakdown of population affiliated with a religious congregation
Type
Adherents
Congregations
Religion
Jacksonville
Kansas City
Jacksonville
Kansas City
SOUTHERN BAPTIST CONVENTION
15.8%
9.5%
22.3%
13.7%
CATHOLIC CHURCH
9.0%
10.3%
2.8%
6.4%
EPISCOPAL CHURCH
1.2%
0.8%
2.3%
1.7%
MUSLIM ESTIMATE
0.7%
0.4%
0.6%
1.1%
LUTHERAN CHURCH
0.3%
1.4%
0.7%
1.8%
SEVENTH DAY ADVENTIST CHURCH
0.3%
0.5%
1.4%
1.0%
AMERICAN BAPTIST CHURCHES IN THE USA
0.1%
0.3%
0.2%
1.4%
SALVATION ARMY
0.0%
0.4%
0.1%
0.6%
Weather
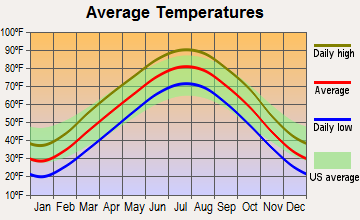
Weather-wise, Jacksonville enjoys a subtropical climate, with mild winters and hot, humid summers. It's an ideal location for those who enjoy beach-life, warm weather and want to escape the cold. Kansas City experiences more extreme temperatures with a humid continental climate. It has hot, humid summers and cold winters, sometimes with heavy snowfall, which could be appealing to people who appreciate seasonal changes.
Weather and climate
Type
Jacksonville
Kansas City
Temperature - Average
68.3°F
56.2°F
Humidity - Average morning or afternoon humidity
78.4%
76.3%
Humidity - Differences between morning and afternoon humidity
44%
30.1%
Humidity - Maximum monthly morning or afternoon humidity
92%
86%
Humidity - Minimum monthly morning or afternoon humidity
48%
56%
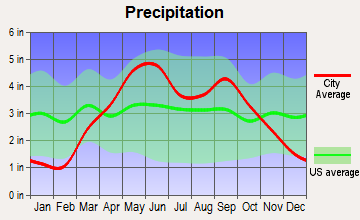
Precipitation - Yearly average
51.8 in
36.3 in
Snowfall - Yearly average
0 in
38 in
Clouds - Number of days clear of clouds
15.8%
20.1%
Sunshine amount - Average
69.6%
67.3%
Sunshine amount - Differences during a year
16%
25.9%
Sunshine amount - Maximum monthly
74%
74%
Sunshine amount - Minimum monthly
58%
48%
Wind speed - Average
7.2 mph
11.2 mph
Average climate in Jacksonville, Florida
Average climate in Kansas City, Missouri
Air pollution
Type
AQI
CO
NO2
OZONE
PB
PM10
PM25
SO2
Year
Jacksonville
Kansas City
Jacksonville
Kansas City
Kansas City
Jacksonville
Kansas City
Jacksonville
Kansas City
Jacksonville
Kansas City
Jacksonville
Kansas City
2018
78
89
N/A
0.29
11.1
N/A
24.5
29.6
N/A
N/A
24.5
N/A
7.1
7.4
N/A
0.9
2017
74
88
N/A
0.29
11.6
N/A
24.7
30.4
N/A
N/A
26.7
N/A
5.8
10.0
0.7
1.4
2016
65
85
0.50
0.30
12.0
N/A
24.9
28.9
N/A
N/A
24.9
N/A
5.2
9.0
0.4
1.5
2015
63
90
0.35
0.30
12.9
N/A
25.4
28.9
N/A
N/A
33.6
N/A
4.9
8.3
0.3
4.6
2014
66
90
0.27
0.28
13.0
N/A
24.3
28.6
N/A
N/A
28.5
N/A
5.9
9.3
0.7
5.0
2013
68
88
0.18
0.41
13.2
N/A
23.0
29.3
N/A
N/A
30.8
N/A
5.3
10.3
0.7
5.6
2012
66
105
0.10
0.52
14.2
N/A
24.0
31.9
N/A
N/A
N/A
N/A
5.8
10.3
0.6
6.4
2011
88
108
0.28
0.45
15.0
N/A
26.6
29.9
N/A
N/A
N/A
N/A
8.1
10.9
0.8
4.8
2010
77
97
0.31
0.40
15.0
N/A
26.4
27.4
N/A
N/A
N/A
N/A
7.1
11.9
0.8
5.4
2009
72
96
0.16
0.29
14.8
N/A
25.0
28.3
N/A
N/A
N/A
N/A
8.5
9.6
0.6
6.1
2008
75
89
0.15
0.40
17.0
N/A
27.6
25.7
N/A
N/A
N/A
N/A
10.0
11.5
0.9
6.0
2007
92
104
0.29
0.42
18.4
N/A
28.4
29.1
N/A
N/A
N/A
N/A
11.4
13.1
1.2
4.2
2006
87
104
0.35
0.36
18.5
N/A
29.0
29.2
N/A
N/A
N/A
N/A
10.8
12.4
1.4
5.1
2005
93
105
0.42
0.55
18.3
N/A
26.5
28.4
N/A
N/A
N/A
N/A
12.2
N/A
1.8
4.5
2004
92
83
0.40
0.45
11.6
N/A
25.2
26.2
N/A
N/A
N/A
N/A
12.4
N/A
1.4
4.0
2003
55
99
0.43
0.41
10.9
N/A
21.6
28.0
N/A
N/A
N/A
N/A
N/A
N/A
1.6
3.0
2002
59
100
0.49
0.40
8.9
N/A
22.2
27.0
0.003
N/A
N/A
N/A
N/A
N/A
1.7
2.5
2001
74
88
0.49
0.52
7.9
N/A
24.0
27.0
0.009
N/A
N/A
N/A
N/A
N/A
2.5
1.2
2000
85
102
0.52
0.75
8.8
N/A
25.1
29.2
0.017
N/A
N/A
N/A
N/A
N/A
3.0
2.2
Natural disasters
Type
Jacksonville
Kansas City
Tornado activity compared to U.S. average
75.2%
200.4%
Earthquake activity compared to U.S. average
18.1%
598.9%
Natural disasters compared to U.S. average
24%
24%
Transportation
Public transit options in Jacksonville include buses, a monorail system in the downtown area, and taxis. Kansas City offers bus service, a tram system, and ride-sharing options. It is generally easier to commute in Kansas City due to its compact size.
Transport
Type
Jacksonville
Kansas City
Amtrak stations
1
1
Amtrak stations nearby
1
3
FAA registered aircraft
566
0
FAA registered aircraft manufacturers and dealers
34
0
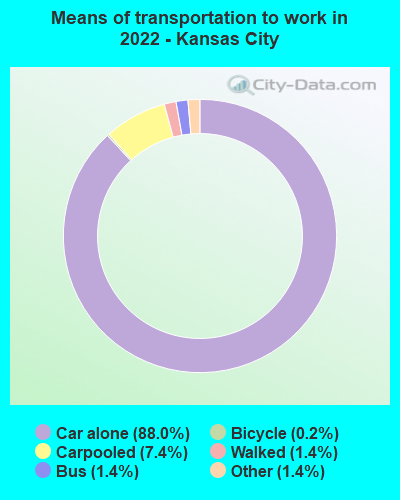
Means of transportation to work
Type
Jacksonville
Kansas City
Bicycle
0.2%
0.4%
Bus
1.1%
1.5%
Carpooled
9%
8.7%
Car alone
86.5%
86.8%
Motorcycle
0.2%
0.1%
Taxicab
0.2%
0.2%
Walked
1.2%
1.3%
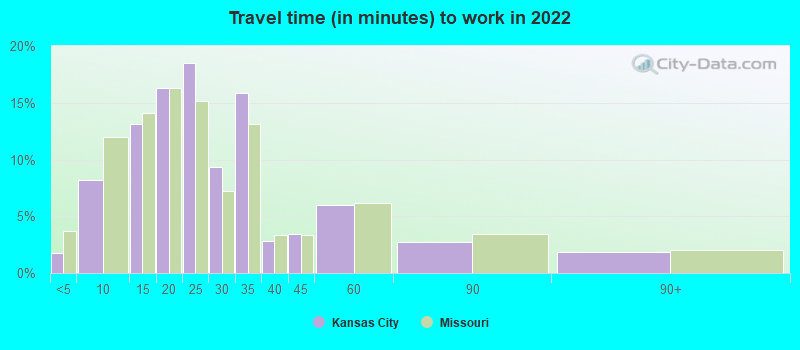
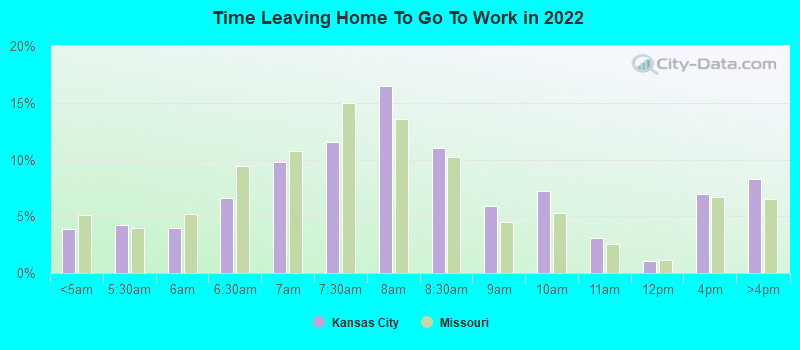
Average travel time to work
Type
Jacksonville
Kansas City
Average
27.5 min
25.5 min
Other means
25 min
21.7 min
Public transportation
43.7 min
38.9 min
Private vehicle occupancy
Type
Jacksonville
Kansas City
Average
1.1
1.1
Drove alone
89.4%
89.4%
In 2 person carpool
8%
8%
In 3 person carpool
1.7%
2.1%
In 4 person carpool
0.7%
0.3%
In 5-6 person carpool
0%
0.2%
In 7+ person carpool
0.2%
0%
How many people usually rode to work in the car, truck or van.
Real Estate
The real estate market in Jacksonville is more affordable than that in Kansas City. One will find a diverse range of properties in both cities, from beachfront properties in Jacksonville to affordable housing options in Kansas City.
Neighborhoods
Jacksonville's neighborhoods range from the historic Riverside to the upscale Ponte Vedra, while Kansas City features trendy Crossroads, along with the historic West Side. Both cities provide neighborhoods that cater to different lifestyle preferences.
Houses and residents
Type
Jacksonville
Kansas City
Houses
422,315
243,950
Average household size (people)
2.5
2.3
Median year apartment built
1985
1975
Median year house/condo built
1987
1967
Length of stay in the house since moving in
12.5 years
12 years
Houses occupied
386,283 (91.5%)
219,020 (89.8%)
Houses occupied by owners
226,429 (58.6%)
118,384 (54.1%)
Houses occupied by renters
159,854 (41.4%)
100,636 (45.9%)
Median rent asked for vacant for-rent units
$1,444
$933.71
Median monthly housing costs
$1,154
$1,092
Median price asked for vacant for-sale houses and condos
$260,045
$71,644
Estimated median house or condo value
$239,400
$213,400
Median numbers of rooms
5.6
5.5
Median number of rooms in apartments
4.3
4.3
Median number of rooms in houses and condos
6.3
6.6
Median house price - detached houses
$282,276
$250,072
Median house price - in 2-unit structures
$177,341
$212,485
Median house price - in 3-to-4-unit structures
$144,947
$147,015
Median house price - in 5 or more unit structures
$220,508
$274,597
Median house price - mobile homes
$87,589
$19,650
Median house price - Townhouses or other attached units
$213,709
$203,232
Median house price - All housing units
$266,926
$247,285
Median house age
36
52
Renting percentage
38.3%
43.8%
Housing density (houses/condos per square mile)
557.4
778
House value disparities
33.2%
36%
Household income disparities
44.2%
43.9%
Median household income for houses/condes with a mortgage
$83,160
$96,255
Median household income for apartments without a mortgage
$59,777
$64,961
Housing units without a mortgage
2,439 (1.6%)
1,566 (2%)
Housing units with both a second mortgage and home equity loan
8,460 (5.5%)
5,650 (7.2%)
Housing units with a mortgage
150,468 (98.4%)
77,422 (98%)
Housing units with a home equity loan
255 (0.2%)
403 (0.5%)
Housing units with a second mortgage
11,378 (7.4%)
6,848 (8.7%)
House/condo owner moved in on average (years ago)
10
9
House/condo renter moved in on average (years ago)
1
1
Housing units lacking complete kitchen facilities
1.5%
3.8%
Housing units lacking complete plumbing facilities
1.4%
2.2%
Housing units in structures
Housing units in structures
Jacksonville
Kansas City
One, detached
59.4%
60.7%
One, attached
6.1%
3.9%
Two
2.1%
3.1%
3 or 4
5.3%
4.4%
5 to 9
5.0%
5.8%
10 to 19
7.9%
6.2%
20 to 49
4.9%
5.8%
50 or more
5.3%
9.3%
Mobile homes
3.8%
0.6%
Boats, RVs, vans, etc.
0.2%
0.1%
Median real estate property taxes paid for housing units
Self-employed workers in own not incorporated business
19,601
13,035
State government workers
13,692
6,835
Unpaid family workers
1,066
197
Industries and Occupations
In Jacksonville, the key industries are healthcare, military and defense, banking and finance, and logistics. Kansas City's economy features a broader variety of sectors, from telecommunications and service to manufacturing and healthcare.
Both Jacksonville and Kansas City host high-quality healthcare facilities. Mayo Clinic in Jacksonville is one of the leading healthcare centers in the nation. Kansas City has an extensive network of hospitals and clinics, like the University of Kansas Hospital.
Health (county statistics)
Type
Jacksonville
Kansas City
General health status score of residents in this county from 1 (poor) to 5 (excellent)
Jacksonville, due to its large size, has an extensive infrastructure with numerous highways and bridges. Kansas City also has a robust infrastructure that includes highways, bridges, and a city-wide tram system.
Infrastructure
Type
Jacksonville
Kansas City
Hospitals
25
30
TV stations
17
14
Arenas or stadiums
2
2
Bank branches located here
191
140
Bank institutions located here
31
41
Main business address for public companies
23
27
Drinking water stations with no reported violations in the past
20
0
Drinking water stations with reported violations in the past
HMDA - Conventional home purchase loans - Applications denied
Year
Jacksonville
Kansas City
1999
5,422
1,565
2000
4,132
1,758
2001
3,038
1,494
2002
2,017
1,380
2003
3,563
1,975
2004
4,781
3,011
2005
7,134
3,470
2006
8,812
3,499
2007
5,298
2,228
2008
1,719
742
2009
676
447
Culture and Food
Jacksonville is popular for its beach culture, arts scene, and diverse food options influenced by southern and coastal cuisine. Kansas City is world-renowned for its jazz music, arts, and unique barbecue culture, offering a variety of culinary experiences.
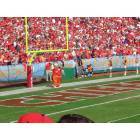
Sports Teams
Both cities have a lively sports scene. Jacksonville is home to the Jaguars (NFL), while Kansas City boasts the Chiefs (NFL) and the Royals (MLB).


 Jacksonville, FL
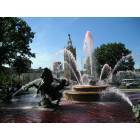
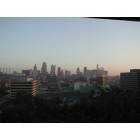
 Kansas City, MO