Jacksonville, FL vs Fort Wayne, IN - Advanced U.S. city comparison tool

Jacksonville, FL vs Fort Wayne, IN

In comparing Jacksonville, FL, and Fort Wayne, IN, different aspects will meet residents' desires or requirements variedly. Jacksonville offers a larger city feel with a diverse culture and subtropical climate, while Fort Wayne provides a more family-oriented, small-town environment with continental climate. Both cities provide distinct options in terms of lifestyle and opportunities.
 
 
Distance between Jacksonville, FL and Fort Wayne, IN : 768.2 miles

Jacksonville's population is larger by 259%. Its population has grown by 218,997 people (29.8%) since 2000. The population of Fort Wayne has grown by 60,247 people (29.3%) during that time.

Population
Type Jacksonville Fort Wayne
Population 954,614 265,974
Female / male percentage 51.4% / 48.6%
51.4%
48.6%
50.8% / 49.2%
50.8%
49.2%
Racial makeup - percentage
Ethnicity JacksonvilleFort Wayne
White Non-Hispanic 48.1% 64.3%
Black 29.7% 12.7%
Hispanic 11.6% 10.2%
Two or more 5.0% 5.9%
Asian 4.9% 6.1%
American Indian 0.1% 0.3%
Racial makeup - absolute values
Ethnicity JacksonvilleFort Wayne
White Non-Hispanic 459,054 169,659
Black 283,190 33,467
Hispanic 110,306 26,945
Two or more 47,991 15,696
Asian 46,726 16,150
American Indian 1,019 731
Pacific Islander 544 57

Crime and Safety

It's essential to mention that Jacksonville has a higher crime rate compared to Fort Wayne. While both cities have strategies in place to combat crime, a potential resident or visitor might feel safer in Fort Wayne. Fort Wayne's lower crime rate is often attributed to its strong community fabric and smaller population compared to Jacksonville. However, safety can vary significantly between different neighborhoods within each city.

Cost of Living

Overall, the cost of living in Jacksonville is considerably higher than in Fort Wayne. Housing stands out as the most significant difference between the two. Essential items like groceries, healthcare, and utilities also tend to be higher in Jacksonville. Fort Wayne residents generally experience a lower cost-of-living index, making it more attractive for those seeking affordability.

Income Tax

One of Jacksonville's biggest financial advantages is Florida's lack of state income tax, which can save residents a significant amount of money. In contrast, Fort Wayne residents need to account for Indiana's flat state income tax of 3.23%.

Property Tax

Property taxes in both Jacksonville and Fort Wayne are relatively similar. In Jacksonville, the average property tax rate is about 0.94%, and in Fort Wayne, the average rate is approximately 0.86%.

Sales Tax

Florida, including Jacksonville, has no state income tax, which can be a significant draw. However, it does have a state sales tax rate of 6%. Indiana's state sales tax rate is 7%, slightly higher than Florida's, and it also has a state income tax, which isn't the case in Florida.
Income
Type Jacksonville Fort Wayne
Estimated median household income $58,621 $54,737
Estimated per capita income $32,953 $29,282
Cost of living index (U.S. average is 100) 88.3 82.8

If you make $50,000 in Fort Wayne, you will have to make $53,321 in Jacksonville to maintain the same standard of living.

Geographical Conditions

Jacksonville's geographically advantageous with its coastal location, providing access to beautiful beaches and water activities. On the other hand, Fort Wayne centrally located in the Midwest offers abundance green spaces and rivers and easy access to larger cities like Chicago and Indianapolis.
Geographical information
Type Jacksonville Fort Wayne
Land area 757.7 sq. miles 79 sq. miles
Population density 1,259.9 people per sq. mile 3,368.8 people per sq. mile
Elevation 12 feet 781 feet
Relative area comparison
Jacksonville, FL Fort Wayne, IN
First ancestry reported - percentage
Ancestry JacksonvilleFort Wayne
English 4.5% 5.4%
Irish 4.1% 3.6%
German 3.7% 18.7%
Italian 2.2% 1.3%
Scottish 0.8% 0.8%
Scotch-Irish 0.7% 0.4%
Polish 0.6% 1.3%
French 0.5% 0.9%
Russian 0.4% 0.1%
Arab 0.3% 0.0%
Dutch 0.3% 0.6%
Ukrainian 0.3% 0.1%
Norwegian 0.2% 0.3%
Greek 0.2% 0.2%
French Canadian 0.2% 0.3%
Swedish 0.2% 0.2%
Hungarian 0.1% 0.2%
Swiss 0.0% 0.4%
Population origin - absolute values
Ancestry JacksonvilleFort Wayne
English 24,028 7,107
Irish 21,841 4,798
German 19,924 24,716
Italian 11,889 1,686
Scottish 4,351 1,103
Scotch-Irish 3,942 504
Polish 3,334 1,761
French 2,532 1,229
Russian 2,198 196
Dutch 1,581 807
Ukrainian 1,461 143
Arab 1,349 59
French Canadian 1,331 378
Norwegian 1,129 388
Greek 1,107 302
Swedish 945 290
West Indian 936 56
Welsh 744 223
Portuguese 658 43
Hungarian 609 273
Foreign born residents - absolute values
Type Count
Region JacksonvilleFort Wayne
All 115,577 23,427
Africa 5,768 1,603
Asia 40,318 11,543
Europe 18,002 1,645
Latin America 48,096 7,828
North America 1,647 364
Oceania 393 0
Foreign born residents - percentage
Type Percentage
Region JacksonvilleFort Wayne
All 12.1% 8.8%
Africa 0.6% 0.6%
Asia 4.2% 4.3%
Europe 1.9% 0.6%
Latin America 5.0% 2.9%
North America 0.2% 0.1%

Education

Educationally, both cities host a variety of schools, colleges, and universities. Fort Wayne boasts notable institutions like Indiana University–Purdue University Fort Wayne, and Jacksonville is home to the University of North Florida. However, Jacksonville, housing more institutions, offers more diverse programs and opportunities for students.
School enrollment
Type Jacksonville Fort Wayne
Nursery, preschool 12,987 (5.9%) 4,009 (6.3%)
Kindergarten 12,436 (5.6%) 3,299 (5.2%)
Grade 1 to 4 49,038 (22.2%) 12,674 (20%)
Grade 5 to 8 44,676 (20.2%) 14,443 (22.8%)
Grade 9 to 12 47,624 (21.6%) 14,860 (23.5%)
College undergrad 44,825 (20.3%) 11,545 (18.2%)
Graduate or professional 9,213 (4.2%) 2,477 (3.9%)
Students in private schools - absolute values
Type Count
Grade JacksonvilleFort Wayne
Grades 1 to 8 (elementary and middle school) 15,629 4,659
Grades 9 to 12 (high school) 5,824 3,251
Undergraduate colleges 10,300 3,427
Students in private schools - percentage
Type Percentage
Grade JacksonvilleFort Wayne
Grades 1 to 8 (elementary and middle school) 16.7% 17.2%
Grades 9 to 12 (high school) 12.2% 21.9%
Undergraduate colleges 23.0% 29.7%
Educational attainment
Type Jacksonville Fort Wayne
Less than high school 9.2% 11.8%
High school or equiv. 27.5% 28.1%
Less than 1 year of college 7.2% 7.5%
1 or more years of college 14.4% 15.7%
Associate degree 9.5% 9.2%
Bachelor's degree 21.8% 19.2%
Master's degree 7.7% 6.6%
Profess. school degree 1.6% 1.3%
Doctorate degree 1.2% 0.7%
Education level (25-year-olds and older)
Type Jacksonville Fort Wayne
Bachelor's degree or higher 32.3% 27.8%
Graduate or professional degree 10.5% 8.6%
High school or higher 90.8% 88.2%

Work and Economy

Jacksonville has a strong and diverse economic base, with prominent sectors being logistics, finance, healthcare, and military, while Fort Wayne's economy is robust, primarily focusing on manufacturing, health care, and retail sectors. Salaries might be higher in Jacksonville, but so is the cost of living.

Biggest Employers

In Jacksonville, the largest employers are Naval Air Station Jacksonville, Duval County Public Schools, and the City of Jacksonville. Fort Wayne's largest employers include Parkview Health System, Lincoln Financial Group, and Fort Wayne Community Schools.
Employment and residency - absolute values
Kind JacksonvilleFort Wayne
Work and live in this city 319,728 74,212
Work and live in this county 426,890 105,982
Workers who work outside the city they live in 415,889 131,515
Workers who work outside the county they live in 33,250 15,698
Working at home 73,598 10,491
Not working at home 386,542 111,189
Daytime population change due to commuting 62,223 31,827
Employment and residency - percentage
Kind JacksonvilleFort Wayne
Work and live in this city 91.2% 75.1%
Work and live in this county 92.8% 87.1%
Workers who work outside the city they live in 8.8% 24.9%
Workers who work outside the county they live in 7.2% 12.9%
Working at home 16.0% 8.6%
Not working at home 84.0% 91.4%
Daytime population change due to commuting 8.5% 15.5%
Geographical mobility: all
Type all
Mobility JacksonvilleFort Wayne
Same house 1 year ago 84.4% 83.1%
Moved from abroad 0.3% 0.5%
Moved within same county 9.4% 11.9%
Moved from different state 3.3% 2.1%
Moved within same state 2.6% 2.4%
Geographical mobility: Asian
Type Asian
Mobility JacksonvilleFort Wayne
Same house 1 year ago 92.0% 85.5%
Moved from abroad 0.2% 0.4%
Moved within same county 4.1% 10.6%
Moved from different state 2.7% 1.9%
Moved within same state 1.0% 1.6%
Geographical mobility: Black
Type Black
Mobility JacksonvilleFort Wayne
Same house 1 year ago 85.8% 82.8%
Moved within same county 9.9% 12.4%
Moved from different state 2.1% 1.7%
Moved within same state 2.1% 3.1%
Geographical mobility: White
Type White
Mobility JacksonvilleFort Wayne
Same house 1 year ago 84.6% 82.9%
Moved from abroad 0.2% 0.5%
Moved within same county 8.3% 11.7%
Moved from different state 4.3% 2.4%
Moved within same state 2.6% 2.5%
Building permits
Type Average valueCount
City JacksonvilleFort WayneJacksonvilleFort Wayne
1997 $111,100 $112,100 3,483 145
1998 $110,500 $103,600 3,796 205
1999 $119,800 $113,400 3,878 184
2000 $114,700 $120,900 3,497 133
2001 $120,300 $98,700 4,832 265
2002 $122,700 $117,000 5,397 312
2003 $126,700 $136,000 5,766 312
2004 $138,800 $147,500 6,067 315
2005 $152,600 $144,600 8,175 331
2006 $157,400 $151,700 6,291 231
2007 $159,100 $159,100 3,449 173
2008 $173,500 $141,700 2,592 138
2009 $179,500 $170,000 1,467 86
2010 $175,800 $141,700 1,397 8
2011 $181,500 $0 957 0
2012 $192,500 $0 1,310 0

There were 1,310 building permits issued in Jacksonville in 2012 (353 more than in 2011) compared to 8 building permits issued in Fort Wayne in 2012 (8 more than in 2011).

In Jacksonville (Duval County), 47.9% voted for Democrats and 51.5% for Republicans in 2012 Presidential Election. In Fort Wayne (Allen County), 40.9% voted for Democrats and 57.6% for Republicans.

Elections
Type DemocratsRepublicansOther
Year JacksonvilleFort WayneJacksonvilleFort WayneJacksonvilleFort Wayne
2020 51.3% 43.3% 47.5% 54.5% 1.2% 2.2%
2016 47.2% 37.3% 48.6% 56.6% 4.2% 6.1%
2012 47.9% 40.9% 51.5% 57.6% 0.6% 1.5%
2008 49.0% 47.5% 51.0% 51.8% 0.0% 0.7%
2004 41.7% 36.1% 57.9% 63.4% 0.3% 0.6%
2000 40.9% 36.4% 57.7% 61.6% 1.4% 2.0%
1996 44.2% 37.8% 50.0% 54.1% 5.8% 8.0%
Breakdown of population affiliated with a religious congregation
Type AdherentsCongregations
Religion JacksonvilleFort WayneJacksonvilleFort Wayne
SOUTHERN BAPTIST CONVENTION 15.8% 1.2% 22.3% 3.8%
CATHOLIC CHURCH 9.0% 16.0% 2.8% 5.6%
EPISCOPAL CHURCH 1.2% 0.2% 2.3% 0.8%
MUSLIM ESTIMATE 0.7% 0.3% 0.6% 0.5%
EVANGELICAL LUTHERAN CHURCH IN AMERICA 0.3% 2.3% 0.9% 3.5%
LUTHERAN CHURCH 0.3% 6.8% 0.7% 8.9%
SEVENTH DAY ADVENTIST CHURCH 0.3% 0.2% 1.4% 0.8%
AMERICAN BAPTIST CHURCHES IN THE USA 0.1% 1.1% 0.2% 2.0%

Weather

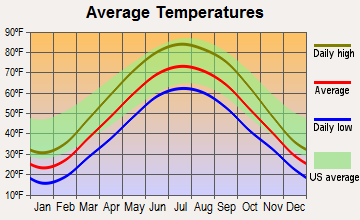
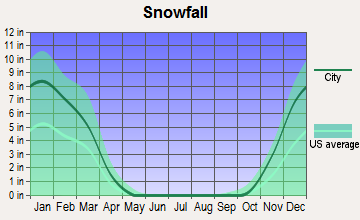
The climate in these two cities differs considerably. Jacksonville experiences a subtropical climate with hot, humid summers and mild winters, whereas Fort Wayne exhibits a continental climate with hot, humid summers and cold winters with snowfall. Jacksonville's weather can be more appealing to those interested in year-round outdoor activities or beach access, while Fort Wayne may appeal to those who enjoy a climate variation with defined seasons.
Weather and climate
Type Jacksonville Fort Wayne
Temperature - Average 68.3°F 49.9°F
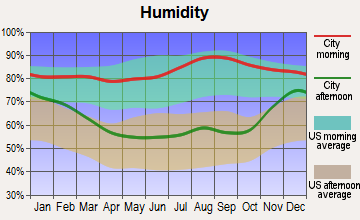
Humidity - Average morning or afternoon humidity 78.4% 77.5%
Humidity - Differences between morning and afternoon humidity 44% 33%
Humidity - Maximum monthly morning or afternoon humidity 92% 87%
Humidity - Minimum monthly morning or afternoon humidity 48% 54%
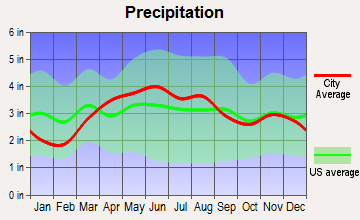
Precipitation - Yearly average 51.8 in 36.5 in
Snowfall - Yearly average 0 in 64.8 in
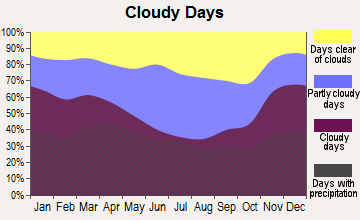
Clouds - Number of days clear of clouds 15.8% 13.1%
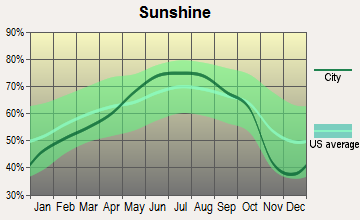
Sunshine amount - Average 69.6% 65.2%
Sunshine amount - Differences during a year 16% 40%
Sunshine amount - Maximum monthly 74% 76%
Sunshine amount - Minimum monthly 58% 36%
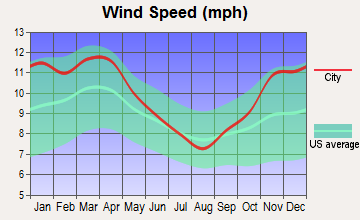
Wind speed - Average 7.2 mph 9.9 mph

Average climate in Jacksonville, Florida

Chicago, Illinois average temperatures Chicago, Illinois average precipitation Chicago, Illinois humidity Chicago, Illinois wind speed Chicago, Illinois snowfall Chicago, Illinois sunshine Chicago, Illinois clear and cloudy days
 

Average climate in Fort Wayne, Indiana

Chicago, Illinois average temperatures Chicago, Illinois average precipitation Chicago, Illinois humidity Chicago, Illinois wind speed Chicago, Illinois snowfall Chicago, Illinois sunshine Chicago, Illinois clear and cloudy days
 

Air pollution
Type AQICOOZONEPBPM25SO2
Year JacksonvilleFort WayneJacksonvilleFort WayneJacksonvilleFort WayneJacksonville JacksonvilleFort WayneJacksonville 
2018 78 74 N/A N/A 24.5 27.2 N/A N/A 7.1 8.8 N/A N/A
2017 74 68 N/A N/A 24.7 28.3 N/A N/A 5.8 8.2 0.7 N/A
2016 65 78 0.50 N/A 24.9 N/A N/A N/A 5.2 8.8 0.4 N/A
2015 63 85 0.35 N/A 25.4 N/A N/A N/A 4.9 10.8 0.3 N/A
2014 66 93 0.27 N/A 24.3 N/A N/A N/A 5.9 13.1 0.7 N/A
2013 68 74 0.18 0.45 23.0 N/A N/A N/A 5.3 9.9 0.7 N/A
2012 66 91 0.10 0.64 24.0 N/A N/A N/A 5.8 13.9 0.6 N/A
2011 88 87 0.28 0.37 26.6 N/A N/A N/A 8.1 12.2 0.8 N/A
2010 77 98 0.31 0.34 26.4 N/A N/A N/A 7.1 15.8 0.8 N/A
2009 72 96 0.16 0.62 25.0 N/A N/A N/A 8.5 16.5 0.6 N/A
2008 75 96 0.15 0.79 27.6 N/A N/A N/A 10.0 15.7 0.9 N/A
2007 92 103 0.29 0.47 28.4 N/A N/A N/A 11.4 13.4 1.2 N/A
2006 87 81 0.35 0.61 29.0 N/A N/A N/A 10.8 11.8 1.4 N/A
2005 93 107 0.42 0.67 26.5 N/A N/A N/A 12.2 14.4 1.8 N/A
2004 92 75 0.40 0.85 25.2 N/A N/A N/A 12.4 N/A 1.4 N/A
2003 55 101 0.43 0.70 21.6 N/A N/A N/A N/A 12.2 1.6 N/A
2002 59 101 0.49 0.71 22.2 N/A 0.003 N/A N/A 13.2 1.7 N/A
2001 74 65 0.49 0.65 24.0 N/A 0.009 N/A N/A N/A 2.5 N/A
2000 85 73 0.52 0.83 25.1 N/A 0.017 N/A N/A N/A 3.0 N/A
Natural disasters
Type Jacksonville Fort Wayne
Tornado activity compared to U.S. average 75.2% 174.8%
Earthquake activity compared to U.S. average 18.1% 101.2%
Natural disasters compared to U.S. average 24% 14%

Transportation

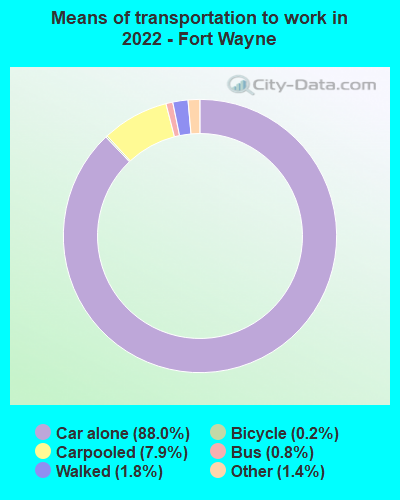
Considering Jacksonville's size, public transportation is more prevalent, including a Skyway monorail system. However, most residents still depend on cars due to the city's spread-out nature. Fort Wayne is smaller, so many residents find it easier to commute using cars, though public buses are also available.
Transport
Type Jacksonville Fort Wayne
Amtrak stations 1 0
Amtrak stations nearby 1 0
FAA registered aircraft 566 209
FAA registered aircraft manufacturers and dealers 34 1
Means of transportation to work
Type Jacksonville Fort Wayne
Bicycle 0.2% 0.4%
Bus 1.1% 0.4%
Carpooled 9% 7.4%
Car alone 86.5% 89.6%
Motorcycle 0.2% 0.1%
Taxicab 0.2% 0%
Walked 1.2% 1.4%
Means of transportation to work
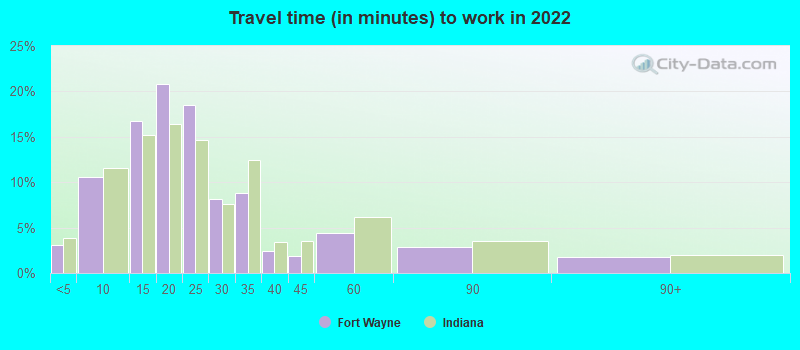
Average travel time to work
Type Jacksonville Fort Wayne
Average 27.5 min 23.9 min
Other means 25 min 20.5 min
Public transportation 43.7 min 38.1 min
Travel time to work
Time leaving to work
Travel time to work
Time leaving to work
Private vehicle occupancy
Type Jacksonville Fort Wayne
Average 1.1 1.1
Drove alone 89.4% 91.1%
In 2 person carpool 8% 7.4%
In 3 person carpool 1.7% 0.4%
In 4 person carpool 0.7% 0.3%
In 5-6 person carpool 0% 0.6%
In 7+ person carpool 0.2% 0.2%

How many people usually rode to work in the car, truck or van.

Real Estate

Real estate prices are much higher in Jacksonville compared to Fort Wayne. As a result, homeownership is more attainable in Fort Wayne, especially for first-time homebuyers, due to the lower cost of housing. Jacksonville offers a more diverse real estate market, including waterfront properties, which come at a premium.

Neighborhoods

Both cities have an array of different neighborhoods to choose from. Jacksonville showcases diverse options, from beachfront neighborhoods like Atlantic Beach to urban environments such as Downtown. Fort Wayne also offers a variety of neighborhoods from downtown areas to more suburban, family-oriented zones like Pine Valley.
Houses and residents
Type Jacksonville Fort Wayne
Houses 422,315 117,245
Average household size (people) 2.5 2.4
Median year apartment built 1985 1976
Median year house/condo built 1987 1972
Length of stay in the house since moving in 12.5 years 12.2 years
Houses occupied 386,283 (91.5%) 109,640 (93.5%)
Houses occupied by owners 226,429 (58.6%) 68,004 (62%)
Houses occupied by renters 159,854 (41.4%) 41,636 (38%)
Median rent asked for vacant for-rent units $1,444 $729.05
Median monthly housing costs $1,154 $844
Median price asked for vacant for-sale houses and condos $260,045 $135,711
Estimated median house or condo value $239,400 $155,600
Median numbers of rooms 5.6 5.9
Median number of rooms in apartments 4.3 4.2
Median number of rooms in houses and condos 6.3 6.8
Median house price - detached houses $282,276 $167,457
Median house price - in 2-unit structures $177,341 $66,481
Median house price - in 3-to-4-unit structures $144,947 $136,033
Median house price - in 5 or more unit structures $220,508 $154,215
Median house price - mobile homes $87,589 $54,382
Median house price - Townhouses or other attached units $213,709 $138,742
Median house price - All housing units $266,926 $164,476
Median house age 36 48
Renting percentage 38.3% 36.7%
Housing density (houses/condos per square mile) 557.4 1,485
House value disparities 33.2% 31.9%
Household income disparities 44.2% 42.5%
Median household income for houses/condes with a mortgage $83,160 $72,350
Median household income for apartments without a mortgage $59,777 $59,128
Housing units without a mortgage 2,439 (1.6%) 811 (1.8%)
Housing units with both a second mortgage and home equity loan 8,460 (5.5%) 3,282 (7.3%)
Housing units with a mortgage 150,468 (98.4%) 43,922 (98.2%)
Housing units with a home equity loan 255 (0.2%) 0 (0%)
Housing units with a second mortgage 11,378 (7.4%) 3,996 (8.9%)
House/condo owner moved in on average (years ago) 10 10
House/condo renter moved in on average (years ago) 1 1
Housing units lacking complete kitchen facilities 1.5% 1%
Housing units lacking complete plumbing facilities 1.4% 0.5%
Housing units in structures
Housing units in structures JacksonvilleFort Wayne
One, detached 59.4% 69.2%
One, attached 6.1% 2.6%
Two 2.1% 2.4%
3 or 4 5.3% 5.3%
5 to 9 5.0% 6.3%
10 to 19 7.9% 5.6%
20 to 49 4.9% 2.8%
50 or more 5.3% 3.7%
Mobile homes 3.8% 2.1%
Boats, RVs, vans, etc. 0.2% 0.0%
Median real estate property taxes paid for housing units
Type Jacksonville Fort Wayne
With mortgages $1,976 (0.8%) $1,295 (0.8%)
With no mortgages $1,563 (0.7%) $1,337 (0.9%)
Marital status
Type Jacksonville Fort Wayne
Divorced 14.3% 13.2%
Never married 35.3% 34.7%
Now married 43.3% 44.9%
Separated 1.9% 1.3%
Widowed 5.1% 5.9%
Class of workers - percentage
Class of Workers JacksonvilleFort Wayne
Employee of private company 69.3% 73.5%
Private not-for-profit wage and salary workers 9.4% 10.7%
Local government workers 6.3% 5.4%
Self-employed workers in own not incorporated business 4.3% 4.8%
Self-employed in own incorporated business 4.1% 2.1%
Federal government workers 3.3% 1.4%
State government workers 3.0% 1.9%
Unpaid family workers 0.2% 0.3%
Class of workers - absolute values
Class of Workers JacksonvilleFort Wayne
Employee of private company 314,902 92,384
Federal government workers 15,074 1,699
Local government workers 28,766 6,757
Private not-for-profit wage and salary workers 42,775 13,482
Self-employed in own incorporated business 18,575 2,629
Self-employed workers in own not incorporated business 19,601 6,040
State government workers 13,692 2,352
Unpaid family workers 1,066 430

Industries and Occupations

In Jacksonville, the biggest industries are trade, transportation, and utilities, while professional and business services also play a vital role. Fort Wayne is more centered around manufacturing but also has a significant presence in healthcare and social services. Many residents in both cities work in sales and office occupations.
Most common male industries
Industry JacksonvilleFort Wayne
Retail trade 12.8% 10.9%
Construction 10.4% 9.9%
Transportation and warehousing 10.3% 9.1%
Finance and insurance 8.0% 3.4%
Accommodation and food services 7.9% 7.2%
Professional, scientific, and technical services 7.7% 4.2%
Manufacturing 7.4% 22.6%
Administrative and support and waste management services 6.8% 2.8%
Other services, except public administration 5.6% 5.3%
Public administration 5.1% 2.5%
Health care and social assistance 5.0% 6.8%
Educational services 3.7% 4.3%
Wholesale trade 3.2% 3.2%
Real estate and rental and leasing 1.8% 3.7%
Arts, entertainment, and recreation 1.8% 0.9%
Utilities 1.3% 0.5%
Information 0.8% 2.0%
Agriculture, forestry, fishing and hunting 0.2% 0.7%
Management of companies and enterprises 0.2% 0.1%
Most common female industries
Industry JacksonvilleFort Wayne
Health care and social assistance 22.6% 26.4%
Finance and insurance 11.4% 5.2%
Retail trade 11.1% 10.1%
Educational services 8.6% 9.4%
Accommodation and food services 8.4% 9.0%
Professional, scientific, and technical services 7.3% 5.4%
Public administration 4.6% 1.9%
Other services, except public administration 4.5% 7.8%
Administrative and support and waste management services 4.4% 2.2%
Manufacturing 3.9% 11.7%
Transportation and warehousing 3.5% 3.8%
Construction 2.4% 0.7%
Arts, entertainment, and recreation 1.9% 2.1%
Real estate and rental and leasing 1.7% 1.4%
Wholesale trade 1.5% 1.6%
Information 1.4% 1.1%
Utilities 0.7% 0.0%
Most common male occupations
Occupation JacksonvilleFort Wayne
Management occupations 11.4% 10.1%
Sales and related occupations 9.5% 9.2%
Office and administrative support occupations 8.9% 5.0%
Transportation occupations 8.4% 6.3%
Construction and extraction occupations 7.4% 6.9%
Installation, maintenance, and repair occupations 6.3% 5.4%
Material moving occupations 5.9% 8.2%
Food preparation and serving related occupations 5.6% 6.3%
Computer and mathematical occupations 5.5% 2.6%
Business and financial operations occupations 5.4% 4.6%
Production occupations 4.4% 13.7%
Building and grounds cleaning and maintenance occupations 4.2% 3.4%
Architecture and engineering occupations 2.6% 3.8%
Educational instruction, and library occupations 2.3% 2.8%
Health diagnosing and treating practitioners and other technical occupations 1.8% 2.0%
Law enforcement workers including supervisors 1.7% 0.7%
Arts, design, entertainment, sports, and media occupations 1.5% 1.1%
Firefighting and prevention, and other protective service workers including supervisors 1.4% 1.6%
Health technologists and technicians 1.4% 1.1%
Personal care and service occupations 1.0% 1.3%
Most common female occupations
Occupation JacksonvilleFort Wayne
Office and administrative support occupations 19.3% 16.2%
Management occupations 10.2% 7.6%
Sales and related occupations 8.7% 9.2%
Health diagnosing and treating practitioners and other technical occupations 7.9% 8.1%
Educational instruction, and library occupations 7.4% 9.2%
Business and financial operations occupations 6.2% 5.3%
Food preparation and serving related occupations 5.8% 7.2%
Healthcare support occupations 4.6% 5.6%
Building and grounds cleaning and maintenance occupations 3.7% 2.3%
Community and social service occupations 3.1% 3.2%
Personal care and service occupations 2.9% 6.0%
Arts, design, entertainment, sports, and media occupations 2.8% 1.6%
Production occupations 2.7% 6.7%
Material moving occupations 2.6% 3.6%
Health technologists and technicians 2.5% 3.6%
Computer and mathematical occupations 2.3% 1.3%
Legal occupations 1.5% 0.3%
Firefighting and prevention, and other protective service workers including supervisors 1.3% 0.7%
Transportation occupations 1.3% 1.4%
Food environment data per 10,000 residents
Food environment statistics JacksonvilleFort Wayne
Number of convenience stores (no gas) 3.3 3.3
Number of convenience stores (with gas) 1.5 0.2
Number of full-service restaurants 7.3 6.7
Number of grocery stores 2.7 1.6
Number of supercenters and club stores 0.1 0.2
Food environment - absolute values
Food environment statistics JacksonvilleFort Wayne
Number of convenience stores (no gas) 281 116
Number of convenience stores (with gas) 130 7
Number of full-service restaurants 614 232
Number of grocery stores 225 57
Number of supercenters and club stores 10 7
Obesity and diabetes
Food environment statistics rate JacksonvilleFort Wayne
Adult diabetes rate 10.4% 8.9%
Adult obesity rate 27.5% 28.9%
Low-income preschool obesity rate 10.9% 12.8%

Health Care

Jacksonville is renowned for its robust healthcare system, housing major medical centers such as Mayo Clinic and Baptist Medical Center. Meanwhile, Fort Wayne also offers good healthcare, with facilities like Parkview Health and Lutheran Health Network, but doesn't have the same level of recognition.
Health (county statistics)
Type Jacksonville Fort Wayne
General health status score of residents in this county from 1 (poor) to 5 (excellent) 3.4 3.4
Average weight of females (lbs) 163.1 lbs 165 lbs
Average weight of males (lbs) 198.5 lbs 199.9 lbs
Residents visited a dentist within the past year 64.1% 72.2%
Residents exercised in the past month 69.2% 71.5%
Adult residents drank alcohol in the past 30 days 52.3% 50.6%
Residents smoked 100+ cigarettes in their lives 46.4% 43.8%

Fatal vehicle accidents per 100,000 residents
Type Total count per 100,000Drunk per 100,000Fatal count per 100,000Pedestrian count per 100,000Person count per 100,000Vehicle count per 100,000
Year JacksonvilleFort WayneJacksonvilleFort WayneJacksonvilleFort WayneJacksonvilleFort WayneJacksonvilleFort WayneJacksonvilleFort Wayne
2021 18.4 11.3 0.0 0.0 19.8 12.4 5.3 4.1 37.8 28.6 29.4 17.7
2020 18.1 6.1 4.7 2.3 19.5 6.8 6.1 0.4 35.1 12.5 27.8 10.2
2019 16.5 10.0 4.2 4.1 17.0 10.7 5.9 1.9 33.7 22.2 25.4 15.2
2018 14.2 9.0 4.2 2.6 15.5 10.1 5.2 1.9 31.9 25.4 22.2 15.0
2017 16.2 12.8 4.1 4.1 16.6 13.6 5.3 1.5 36.4 27.5 26.1 21.9
2016 16.2 9.5 4.9 4.2 17.2 10.6 5.3 1.5 34.7 22.8 25.4 17.1
2015 13.6 8.8 4.2 3.1 14.7 9.5 4.8 1.1 27.2 18.3 20.9 13.3
2014 12.3 9.3 4.7 2.7 13.0 9.7 4.2 2.7 29.5 19.0 18.9 15.1
2013 14.6 7.4 5.2 3.9 15.5 8.6 4.9 2.7 28.0 17.2 20.9 12.9
2012 13.3 9.4 5.0 3.5 13.7 11.0 4.8 1.6 26.8 22.8 19.6 16.1
2011 9.9 4.7 3.4 2.0 10.3 4.7 3.1 1.2 20.1 7.4 15.6 7.0
2010 12.4 4.3 4.7 1.2 13.0 4.3 3.3 0.4 25.1 11.8 18.4 8.3
2009 12.4 6.6 4.2 4.7 13.5 7.8 4.1 0.4 33.4 12.5 17.8 8.6
2008 14.2 7.5 5.9 1.6 14.7 8.3 2.5 1.6 35.7 17.3 21.7 11.0
2007 18.3 4.7 8.2 1.2 19.6 4.7 5.1 1.2 45.3 14.2 28.8 7.9
2006 16.3 6.0 5.4 2.8 17.0 6.0 3.8 1.6 45.2 11.9 27.2 8.4
2005 17.2 5.6 7.0 2.8 19.1 5.6 5.1 0.4 47.9 13.2 29.6 12.0
2004 15.0 6.0 5.7 1.6 15.8 6.0 4.4 1.6 37.9 12.4 22.5 8.4
2003 14.7 4.0 4.3 0.8 15.4 4.0 2.6 0.0 38.8 10.7 23.4 8.0
2002 13.6 3.2 4.5 1.6 15.4 4.0 3.0 0.0 36.8 9.1 20.9 5.9
2001 14.4 4.3 7.2 2.8 15.9 4.3 3.9 0.4 40.1 9.1 22.3 6.3
2000 13.5 5.3 5.7 4.4 13.9 5.3 3.5 1.0 33.7 13.1 19.3 7.8
1999 14.3 8.6 6.2 3.6 15.6 8.6 4.0 1.5 43.7 19.8 23.2 12.2
1998 12.2 7.1 3.6 2.6 13.7 7.1 4.8 2.0 36.6 16.3 18.3 9.2
1997 12.3 4.6 2.7 2.5 14.4 5.1 3.6 0.5 31.1 13.7 18.6 9.6
1996 14.4 6.0 3.8 3.0 15.8 6.0 3.9 1.0 40.5 16.1 21.4 10.1
1995 14.6 7.5 4.0 3.0 15.5 7.5 2.8 2.0 35.8 19.1 22.3 11.5
1994 13.6 6.5 4.7 2.0 15.5 6.5 3.7 2.0 39.1 16.5 22.5 9.0
1993 11.9 6.0 4.9 2.0 12.7 6.5 3.3 1.5 37.3 12.0 21.0 10.0
1992 11.4 7.4 5.8 4.0 12.0 8.4 2.9 1.5 30.9 22.8 16.2 12.4
1991 10.9 7.9 5.6 5.9 12.7 7.9 2.4 2.0 27.2 17.8 16.5 9.9
1990 14.0 9.4 7.3 3.9 15.2 9.4 0.0 0.0 36.3 23.2 20.8 13.8
1989 17.2 11.0 8.9 5.2 18.1 11.0 0.0 0.0 45.3 28.9 25.7 17.3
1988 14.7 12.7 6.6 6.4 16.1 12.7 0.0 0.0 40.6 28.3 22.5 18.5
1987 13.2 15.0 6.5 13.3 15.6 15.0 0.0 0.0 38.6 34.1 21.8 22.0
1986 18.7 8.7 6.5 3.5 20.2 9.3 0.0 0.0 50.8 20.8 28.0 12.7
1985 13.3 9.8 4.7 6.9 14.1 10.4 0.0 0.0 36.3 22.6 21.4 16.8
1984 15.4 10.4 6.4 7.0 17.3 10.4 0.0 0.0 39.4 22.0 23.9 14.5
1983 19.1 8.1 8.0 3.5 21.4 10.4 0.0 0.0 48.7 16.8 26.3 10.4
1982 18.8 10.4 5.9 7.5 19.4 11.0 0.0 0.0 46.8 34.2 25.0 18.5
1981 17.9 17.4 3.1 8.1 18.8 18.0 0.0 0.0 45.8 40.6 24.4 24.4
1980 19.6 12.8 4.2 4.1 21.2 13.3 0.0 0.0 51.0 28.4 25.9 17.4
1979 22.1 14.5 5.8 2.9 24.3 15.0 0.0 0.0 53.8 31.8 28.4 23.1
1978 18.3 12.7 4.8 5.8 19.9 12.7 0.0 0.0 52.8 36.3 24.7 21.3
1977 16.8 12.6 4.7 4.6 17.7 13.2 0.0 0.0 44.4 31.0 22.7 17.8
1976 18.8 8.0 1.4 0.0 19.9 8.6 0.0 0.0 48.5 22.9 24.4 12.0
1975 18.9 8.0 1.5 0.0 20.0 8.6 0.0 0.0 48.9 22.8 24.5 12.0

Fatal vehicle accidents
Type Total countDrunkFatal countPedestrian countPerson countVehicle count
Year JacksonvilleFort WayneJacksonvilleFort WayneJacksonvilleFort WayneJacksonvilleFort WayneJacksonvilleFort WayneJacksonvilleFort Wayne
1975 104 14 8 0 110 15 0 0 269 40 135 21
1976 104 14 8 0 110 15 0 0 269 40 135 21
1977 94 22 26 8 99 23 0 0 248 54 127 31
1978 103 22 27 10 112 22 0 0 297 63 139 37
1979 125 25 33 5 138 26 0 0 305 55 161 40
1980 112 22 24 7 121 23 0 0 291 49 148 30
1981 104 30 18 14 109 31 0 0 266 70 142 42
1982 111 18 35 13 115 19 0 0 277 59 148 32
1983 115 14 48 6 129 18 0 0 293 29 158 18
1984 94 18 39 12 106 18 0 0 241 38 146 25
1985 83 17 29 12 88 18 0 0 226 39 133 29
1986 118 15 41 6 128 16 0 0 321 36 177 22
1987 85 26 42 23 100 26 0 0 248 59 140 38
1988 96 22 43 11 105 22 0 0 265 49 147 32
1989 114 19 59 9 120 19 0 0 300 50 170 30
1990 94 19 49 8 102 19 0 0 244 47 140 28
1991 74 16 38 12 86 16 16 4 185 36 112 20
1992 78 15 40 8 82 17 20 3 212 46 111 25
1993 82 12 34 4 88 13 23 3 258 24 145 20
1994 95 13 33 4 108 13 26 4 273 33 157 18
1995 103 15 28 6 109 15 20 4 252 38 157 23
1996 102 12 27 6 112 12 28 2 288 32 152 20
1997 88 9 19 5 103 10 26 1 223 27 133 19
1998 88 14 26 5 99 14 35 4 265 32 132 18
1999 104 17 45 7 114 17 29 3 319 39 169 24
2000 99 11 42 9 102 11 26 2 248 27 142 16
2001 108 11 54 7 119 11 29 1 300 23 167 16
2002 103 8 34 4 117 10 23 0 279 23 159 15
2003 113 10 33 2 118 10 20 0 298 27 180 20
2004 117 15 44 4 123 15 34 4 295 31 175 21
2005 135 14 55 7 150 14 40 1 377 33 233 30
2006 130 15 43 7 136 15 30 4 361 30 217 21
2007 147 12 66 3 158 12 41 3 365 36 232 20
2008 115 19 48 4 119 21 20 4 289 44 176 28
2009 101 17 34 12 110 20 33 1 272 32 145 22
2010 102 11 39 3 107 11 27 1 206 30 151 21
2011 82 12 28 5 85 12 26 3 166 19 129 18
2012 111 24 42 9 115 28 40 4 224 58 164 41
2013 123 19 44 10 131 22 41 7 236 44 176 33
2014 105 24 40 7 111 25 36 7 252 49 161 39
2015 118 23 36 8 127 25 42 3 236 48 181 35
2016 143 25 43 11 152 28 47 4 306 60 224 45
2017 145 34 37 11 148 36 47 4 325 73 233 58
2018 128 24 38 7 140 27 47 5 288 68 201 40
2019 151 27 38 11 155 29 54 5 308 60 232 41
2020 172 16 45 6 185 18 58 1 334 33 264 27
2021 176 30 0 0 189 33 51 11 361 76 281 47
Local government: full-time employees
Job JacksonvilleFort Wayne
Airports 289 0
Correction 870 0
Financial administration 693 35
Firefighters 1,283 349
Fire - other 92 21
Health 122 47
Judicial and legal 102 4
Local libraries 319 0
Other and unallocable 814 114
Other government administration 577 55
Parks and recreation 220 128
Police - other 572 163
Police protection - officers 1,681 464
Sewerage 350 164
Solid waste management 179 11
Streets and highways 18 186
Totals for government 9,314 1,915
Water supply 146 125
Water transport and terminals 146 0
Welfare 142 0
Local government: part-time employees
Job JacksonvilleFort Wayne
Airports 1 0
Financial administration 3 1
Gas supply 1 0
Other government administration 0 3
Parks and recreation 0 61
Police - other 0 44
Sewerage 0 9
Solid waste management 0 1
Streets and highways 0 2
Totals for government 9 134
Water supply 0 3
Water transport and terminals 4 0
Place of birth - Foreign born
Residents JacksonvilleFort Wayne
All residents 12.3% 9.2%
American Indian / Alaska Native residents 3.4% 12.5%
Asian residents 73.5% 70.9%
Black or African American residents 5.7% 4.5%
Native Hawaiian / Pacific Islander residents 24.9% 0.0%
Other race residents 35.6% 37.7%
Two or more races residents 16.7% 9.4%
White residents 6.9% 1.7%
White alone, not Hispanic / Latino residents 5.9% 1.4%
Place of birth - Native, outside of US
Residents JacksonvilleFort Wayne
All residents 2.6% 1.5%
American Indian / Alaska Native residents 7.0% 2.9%
Asian residents 1.0% 1.5%
Black or African American residents 1.3% 0.7%
Native Hawaiian / Pacific Islander residents 10.5% 13.6%
Other race residents 15.2% 4.4%
Two or more races residents 7.6% 3.3%
White residents 1.4% 0.7%
White alone, not Hispanic / Latino residents 1.3% 0.5%
Place of birth - Born in state of residence
Residents JacksonvilleFort Wayne
All residents 46.9% 63.5%
American Indian / Alaska Native residents 47.8% 56.6%
Asian residents 14.5% 20.6%
Black or African American residents 62.0% 60.4%
Native Hawaiian / Pacific Islander residents 13.0% 52.6%
Other race residents 27.6% 42.2%
Two or more races residents 45.1% 70.3%
White residents 43.9% 70.0%
White alone, not Hispanic / Latino residents 45.7% 71.4%
Place of birth - Born in other state
Residents JacksonvilleFort Wayne
All residents 38.2% 25.8%
American Indian / Alaska Native residents 41.8% 28.0%
Asian residents 10.9% 7.0%
Black or African American residents 30.9% 34.4%
Native Hawaiian / Pacific Islander residents 51.5% 33.8%
Other race residents 21.6% 15.7%
Two or more races residents 30.6% 17.0%
White residents 47.8% 27.6%
White alone, not Hispanic / Latino residents 47.0% 26.7%
English speakers (speaking English at home)
Type Jacksonville Fort Wayne
Born in the United States residents 94.4% 93.9%
Foreign born residents 22.4% 13.3%
Native, born elsewhere residents 47.2% 58.5%
Total residents 84.3% 86.5%
Mechanisms of homicide
Mechanism JacksonvilleFort Wayne
Homicides from 2000 to 2006 721 155
Cut / Pierce 76 0
Firearm 492 105
Struck by / against 22 0
Suffocation 31 0
Mechanisms of homicide per 1,000,000 residents
Mechanism JacksonvilleFort Wayne
Homicides from 2000 to 2006 126.9 65.3
Cut / Pierce 13.4 0
Firearm 86.6 44.3
Struck by / against 3.9 0
Suffocation 5.5 0
Mechanisms of suicide per 1,000,000 residents
Mechanism JacksonvilleFort Wayne
Suicides from 2000 to 2006 140.7 116.3
Firearm 79.2 56.5
Poisoning 27.5 27.4
Suffocation 22.7 24.4

Infrastructure

Jacksonville boasts a more extensive infrastructure, given its size, catering to a larger population and offering a variety of amenities, from extensive shopping centers to sporting complexes. Fort Wayne, while smaller, provides adequate infrastructure to meet residents' needs and is continuously working on development projects to enhance the city's attractiveness.
Infrastructure
Type Jacksonville Fort Wayne
Hospitals 25 21
TV stations 17 11
Arenas or stadiums 2 1
Bank branches located here 191 93
Bank institutions located here 31 20
Main business address for public companies 23 3
Drinking water stations with no reported violations in the past 20 1
Drinking water stations with reported violations in the past 20 14

Schools

School facilities
Type Jacksonville Fort Wayne
Private elementary/middle schools 38 17
Private high schools 56 5
Public elementary/middle schools 145 61
Public high schools 55 11
Colleges/Universities 30 12
HMDA - Conventional home purchase loans - Applications denied
Year JacksonvilleFort Wayne
1999 5,422 1,000
2000 4,132 865
2001 3,038 592
2002 2,017 355
2003 3,563 476
2004 4,781 748
2005 7,134 940
2006 8,812 1,055
2007 5,298 614
2008 1,719 234
2009 676 113

Culture and Food

As for culture and food, Jacksonville boasts a diverse food scene with many restaurants influenced by the city's coastal location and Southern tradition. In comparison, Fort Wayne's food culture is more home-style, heavily influenced by the Midwest's agricultural industry, offering comfort foods like hotdogs, craft beer, and barbecue.

Sports Teams

Jacksonville is home to the NFL's Jacksonville Jaguars, making it attractive for football fans. Fort Wayne, while not housing any major league teams, has a vibrant local sports scene, hosting minor league baseball, basketball, and hockey teams, like the Fort Wayne TinCaps, Komets and Mad Ants.