Jacksonville, FL vs Columbus, GA - Advanced U.S. city comparison tool

Jacksonville, FL vs Columbus, GA

Jacksonville, Florida, and Columbus, Georgia both provide interesting and diverse experiences for both residents and tourists. Jacksonville, the most populous city in Florida, is known for its live music, art scene, and beach lifestyle, while Columbus, Georgia, blends the charm of the old South with modernity and the presence of a military base. This article offers a comparative exploration of both cities, diving into factors like crime safety, cost of living, education, work and economy, and beyond, providing a comprehensive understanding of what each city offers.
 
 
Distance between Jacksonville, FL and Columbus, GA : 244.7 miles

Jacksonville's population is larger by 414%. Its population has grown by 218,997 people (29.8%) since 2000.

Population
Type Jacksonville Columbus
Population 954,614 185,888
Female / male percentage 51.4% / 48.6%
51.4%
48.6%
51.4% / 48.6%
51.4%
48.6%
Racial makeup - percentage
Ethnicity JacksonvilleColumbus
White Non-Hispanic 48.1% 48.6%
Black 29.7% 43.4%
Hispanic 11.6% 4.5%
Two or more 5.0% 1.4%
Asian 4.9% 1.5%
American Indian 0.1% 0.3%
Pacific Islander 0.1% 0.1%
Racial makeup - absolute values
Ethnicity JacksonvilleColumbus
White Non-Hispanic 459,054 90,200
Black 283,190 80,698
Hispanic 110,306 8,368
Two or more 47,991 2,568
Asian 46,726 2,788
American Indian 1,019 614
Pacific Islander 544 248

Crime and Safety

Jacksonville has a higher crime rate than Columbus, although, like any city, some neighborhoods are safer than others. Among tourists, petty thefts are the most common crime in both cities. In Columbus, crime rates have been decreasing over the years and its proximity to the Fort Benning military base adds a layer of law enforcement presence, which can foster feelings of safety.

Cost of Living

The cost of living in Columbus, GA, is generally lower than in Jacksonville, FL. This is mainly due to the cost of housing, which is significantly lower in Columbus. While the median home cost in Jacksonville is around $180,000, in Columbus it is approximately $105,000. The overall living cost including utilities, transportation, and groceries are also typically lower in Columbus than in Jacksonville.

Income Tax

Florida does not have a state income tax, so Jacksonville residents are not subject to it. Georgia, on the other hand, imposes a state income tax, which ranges from 1% to 5.75%. Columbus residents, therefore, have to pay state income tax.

Property Tax

On average, property taxes are higher in Jacksonville than in Columbus. In Jacksonville, the average property tax rate is about 0.98% of the property's assessed fair market value, while it is approximately 0.87% in Columbus.

Sales Tax

Jacksonville’s sales tax rate is 7%, which is the combined state and city rate. Columbus’ combined rate is slightly higher at 8%, given Georgia's state sales tax rate of 4% and an additional 4% county and city tax.
Income
Type Jacksonville Columbus
Estimated median household income $58,621 $52,817
Estimated per capita income $32,953 $29,689
Cost of living index (U.S. average is 100) 88.3 86.8

If you make $50,000 in Columbus, you will have to make $50,864 in Jacksonville to maintain the same standard of living.

Geographical Conditions

Jacksonville is a coastal city, a factor that brings both advantages like beautiful beaches and the disadvantage of being more prone to hurricanes. Columbus is landlocked and characterized by rolling hills and the Chattahoochee River, providing a variety of outdoor recreational opportunities.
Geographical information
Type Jacksonville Columbus
Land area 757.7 sq. miles 216.1 sq. miles
Population density 1,259.9 people per sq. mile 860.2 people per sq. mile
Elevation 12 feet 300 feet
Relative area comparison
Jacksonville, FL Columbus, GA
First ancestry reported - percentage
Ancestry JacksonvilleColumbus
English 4.5% 6.2%
Irish 4.1% 6.6%
German 3.7% 6.7%
Italian 2.2% 1.6%
Scottish 0.8% 1.3%
Scotch-Irish 0.7% 1.5%
Polish 0.6% 0.8%
French 0.5% 1.4%
Russian 0.4% 0.2%
Arab 0.3% 0.0%
Ukrainian 0.3% 0.0%
Dutch 0.3% 0.7%
Swedish 0.2% 0.3%
Norwegian 0.2% 0.4%
Greek 0.2% 0.1%
French Canadian 0.2% 0.3%
West Indian 0.2% 0.5%
Hungarian 0.1% 0.2%
Welsh 0.1% 0.3%
Subsaharan African 0.0% 1.4%
Population origin - absolute values
Ancestry JacksonvilleColumbus
English 24,028 11,560
Irish 21,841 12,223
German 19,924 12,529
Italian 11,889 3,008
Scottish 4,351 2,328
Scotch-Irish 3,942 2,742
Polish 3,334 1,567
French 2,532 2,527
Russian 2,198 284
Dutch 1,581 1,258
Ukrainian 1,461 79
Arab 1,349 79
French Canadian 1,331 567
Norwegian 1,129 762
Greek 1,107 210
Swedish 945 508
West Indian 936 979
Welsh 744 547
Portuguese 658 289
Hungarian 609 386
Foreign born residents - absolute values
Type Count
Region JacksonvilleColumbus
All 115,577 8,632
Africa 5,768 228
Asia 40,318 2,213
Europe 18,002 2,653
Latin America 48,096 3,270
North America 1,647 130
Oceania 393 138
Foreign born residents - percentage
Type Percentage
Region JacksonvilleColumbus
All 12.1% 4.6%
Africa 0.6% 0.1%
Asia 4.2% 1.2%
Europe 1.9% 1.4%
Latin America 5.0% 1.8%
North America 0.2% 0.1%

Education

Both cities have strong education systems. Jacksonville is home to the University of North Florida, education institutions, and a thriving community college system, while Columbus offers Columbus State University and various technical colleges. Public school systems in both cities have strengths and weaknesses, and there are numerous private school options in each city as well.
School enrollment
Type Jacksonville Columbus
Nursery, preschool 12,987 (5.9%) 4,090 (8%)
Kindergarten 12,436 (5.6%) 3,084 (6.1%)
Grade 1 to 4 49,038 (22.2%) 11,260 (22.1%)
Grade 5 to 8 44,676 (20.2%) 11,183 (22%)
Grade 9 to 12 47,624 (21.6%) 11,192 (22%)
College undergrad 44,825 (20.3%) 8,414 (16.6%)
Graduate or professional 9,213 (4.2%) 1,615 (3.2%)
Students in private schools - absolute values
Type Count
Grade JacksonvilleColumbus
Grades 1 to 8 (elementary and middle school) 15,629 2,100
Grades 9 to 12 (high school) 5,824 880
Undergraduate colleges 10,300 694
Students in private schools - percentage
Type Percentage
Grade JacksonvilleColumbus
Grades 1 to 8 (elementary and middle school) 16.7% 9.4%
Grades 9 to 12 (high school) 12.2% 7.9%
Undergraduate colleges 23.0% 8.2%
Educational attainment
Type Jacksonville Columbus
Less than high school 9.2% 21%
High school or equiv. 27.5% 28.2%
Less than 1 year of college 7.2% 8%
1 or more years of college 14.4% 16.1%
Associate degree 9.5% 6.4%
Bachelor's degree 21.8% 12.4%
Master's degree 7.7% 5.8%
Profess. school degree 1.6% 1.7%
Doctorate degree 1.2% 0.5%
Education level (25-year-olds and older)
Type Jacksonville Columbus
Bachelor's degree or higher 32.3% 20.4%
Graduate or professional degree 10.5% 8%
High school or higher 90.8% 79%

Work and Economy

The job market in both cities has opportunities in various fields. Jacksonville's economy is largely driven by banking, insurance, healthcare, logistics, and military bases. Columbus’s economy, on the other hand, is heavily boosted by the military, specifically the Army’s Fort Benning. Columbus also has a presence of manufacturing and healthcare industries.

Biggest Employers

In Jacksonville, the largest employers are the military, especially the Naval Air Station and Mayport Naval Station, followed by healthcare providers like Baptist Health and UF Health Jacksonville. In Columbus, the United States Army’s Fort Benning and the Muskogee County School District are among the largest employers.
Employment and residency - absolute values
Kind JacksonvilleColumbus
Work and live in this city 319,728 71,631
Work and live in this county 426,890 N/A
Workers who work outside the city they live in 415,889 114,150
Workers who work outside the county they live in 33,250 N/A
Working at home 73,598 N/A
Not working at home 386,542 N/A
Daytime population change due to commuting 62,223 18,456
Employment and residency - percentage
Kind JacksonvilleColumbus
Work and live in this city 91.2% 86.5%
Work and live in this county 92.8% N/A
Workers who work outside the city they live in 8.8% 13.5%
Workers who work outside the county they live in 7.2% N/A
Working at home 16.0% N/A
Not working at home 84.0% N/A
Daytime population change due to commuting 8.5% 9.9%
Building permits
Type Average valueCount
City JacksonvilleColumbusJacksonvilleColumbus
1997 $111,100 $80,500 3,483 633
1998 $110,500 $104,600 3,796 622
1999 $119,800 $97,700 3,878 574
2000 $114,700 $94,900 3,497 556
2001 $120,300 $103,300 4,832 506
2002 $122,700 $99,400 5,397 615
2003 $126,700 $112,400 5,766 704
2004 $138,800 $104,100 6,067 701
2005 $152,600 $106,300 8,175 846
2006 $157,400 $105,700 6,291 710
2007 $159,100 $105,900 3,449 488
2008 $173,500 $105,800 2,592 286
2009 $179,500 $105,900 1,467 223
2010 $175,800 $105,900 1,397 224
2011 $181,500 $105,900 957 217
2012 $192,500 $105,900 1,310 262
2013 $0 $105,900 0 318
2014 $0 $105,900 0 333
2015 $0 $204,200 0 290
2016 $0 $191,900 0 270
2017 $0 $195,300 0 311
2018 $0 $194,500 0 326
2019 $0 $188,600 0 293
2020 $0 $96,300 0 901
2021 $0 $198,900 0 296

There were 1,310 building permits issued in Jacksonville in 2012 (353 more than in 2011) compared to 296 building permits issued in Columbus in 2012 (79 more than in 2011).

In Jacksonville (Duval County), 47.9% voted for Democrats and 51.5% for Republicans in 2012 Presidential Election. In Columbus (Muscogee County), 60.3% voted for Democrats and 39.0% for Republicans.

Elections
Type DemocratsRepublicansOther
Year JacksonvilleColumbusJacksonvilleColumbusJacksonvilleColumbus
2020 51.3% 61.4% 47.5% 37.4% 1.2% 1.2%
2016 47.2% 57.4% 48.6% 38.9% 4.2% 3.7%
2012 47.9% 60.3% 51.5% 39.0% 0.6% 0.7%
2008 49.0% 59.7% 51.0% 40.0% 0.0% 0.4%
2004 41.7% 51.4% 57.9% 48.2% 0.3% 0.4%
2000 40.9% 54.3% 57.7% 45.2% 1.4% 0.5%
1996 44.2% 53.8% 50.0% 41.9% 5.8% 4.4%
Breakdown of population affiliated with a religious congregation
Type AdherentsCongregations
Religion JacksonvilleColumbusJacksonvilleColumbus
SOUTHERN BAPTIST CONVENTION 15.8% 22.8% 22.3% 16.6%
CATHOLIC CHURCH 9.0% 4.6% 2.8% 1.5%
EPISCOPAL CHURCH 1.2% 0.6% 2.3% 1.2%
MUSLIM ESTIMATE 0.7% 1.2% 0.6% 1.2%
SEVENTH DAY ADVENTIST CHURCH 0.3% 0.5% 1.4% 0.8%
AMERICAN BAPTIST CHURCHES IN THE USA 0.1% 0.5% 0.2% 0.8%

Weather

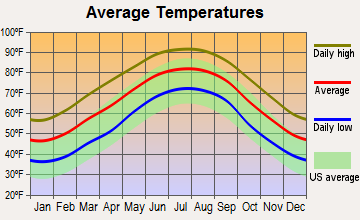
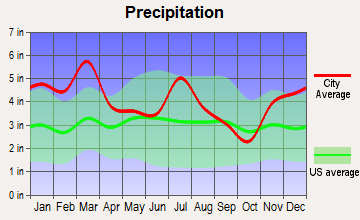
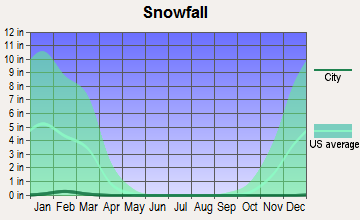
Jacksonville has a hot semi-tropical climate with a long, hot summer and a mild to cool winter. Columbus also experiences a southern subtropical climate, but temperatures are slightly cooler in comparison since it's away from the coast. Both cities can expect higher than average rainfall throughout the year.
Weather and climate
Type Jacksonville Columbus
Temperature - Average 68.3°F 65.1°F
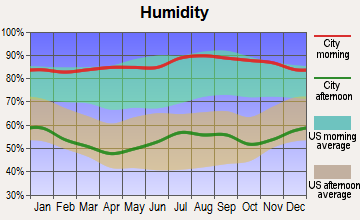
Humidity - Average morning or afternoon humidity 78.4% 74.6%
Humidity - Differences between morning and afternoon humidity 44% 42%
Humidity - Maximum monthly morning or afternoon humidity 92% 89%
Humidity - Minimum monthly morning or afternoon humidity 48% 47%
Precipitation - Yearly average 51.8 in 48.6 in
Snowfall - Yearly average 0 in 1 in
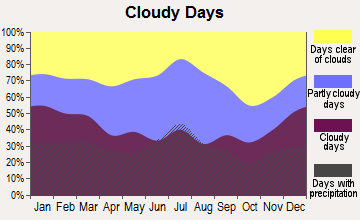
Clouds - Number of days clear of clouds 15.8% 18.3%
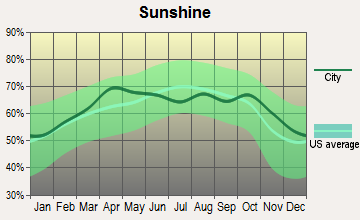
Sunshine amount - Average 69.6% 66.5%
Sunshine amount - Differences during a year 16% 17.4%
Sunshine amount - Maximum monthly 74% 68%
Sunshine amount - Minimum monthly 58% 50.6%
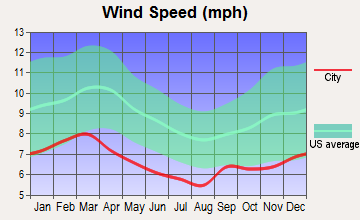
Wind speed - Average 7.2 mph 6.6 mph

Average climate in Jacksonville, Florida

Chicago, Illinois average temperatures Chicago, Illinois average precipitation Chicago, Illinois humidity Chicago, Illinois wind speed Chicago, Illinois snowfall Chicago, Illinois sunshine Chicago, Illinois clear and cloudy days
 

Average climate in Columbus, Georgia

Chicago, Illinois average temperatures Chicago, Illinois average precipitation Chicago, Illinois humidity Chicago, Illinois wind speed Chicago, Illinois snowfall Chicago, Illinois sunshine Chicago, Illinois clear and cloudy days
 

Air pollution
Type AQICOOZONEPBPM25SO2
Year JacksonvilleColumbusJacksonville JacksonvilleColumbusJacksonvilleColumbusJacksonvilleColumbusJacksonvilleColumbus
2018 78 61 N/A N/A 24.5 28.3 N/A N/A 7.1 6.8 N/A N/A
2017 74 71 N/A N/A 24.7 28.8 N/A N/A 5.8 8.4 0.7 N/A
2016 65 76 0.50 N/A 24.9 30.8 N/A N/A 5.2 8.1 0.4 N/A
2015 63 70 0.35 N/A 25.4 26.9 N/A N/A 4.9 8.1 0.3 N/A
2014 66 78 0.27 N/A 24.3 28.0 N/A N/A 5.9 9.2 0.7 N/A
2013 68 72 0.18 N/A 23.0 28.5 N/A N/A 5.3 8.4 0.7 N/A
2012 66 79 0.10 N/A 24.0 30.6 N/A N/A 5.8 9.5 0.6 1.1
2011 88 86 0.28 N/A 26.6 32.0 N/A N/A 8.1 11.6 0.8 1.2
2010 77 81 0.31 N/A 26.4 31.5 N/A N/A 7.1 10.9 0.8 1.2
2009 72 75 0.16 N/A 25.0 28.8 N/A N/A 8.5 10.0 0.6 1.3
2008 75 81 0.15 N/A 27.6 33.2 N/A 0.004 10.0 11.7 0.9 1.7
2007 92 103 0.29 N/A 28.4 35.7 N/A 0.004 11.4 14.8 1.2 N/A
2006 87 99 0.35 N/A 29.0 34.6 N/A 0.004 10.8 14.1 1.4 N/A
2005 93 104 0.42 N/A 26.5 30.6 N/A 0.004 12.2 13.3 1.8 2.0
2004 92 94 0.40 N/A 25.2 28.9 N/A 0.005 12.4 13.3 1.4 N/A
2003 55 84 0.43 N/A 21.6 26.9 N/A 0.004 N/A N/A 1.6 N/A
2002 59 62 0.49 N/A 22.2 27.9 0.003 N/A N/A N/A 1.7 1.9
2001 74 88 0.49 N/A 24.0 30.1 0.009 N/A N/A N/A 2.5 N/A
2000 85 110 0.52 N/A 25.1 34.2 0.017 N/A N/A N/A 3.0 N/A
Natural disasters
Type Jacksonville Columbus
Tornado activity compared to U.S. average 75.2% 137.4%
Earthquake activity compared to U.S. average 18.1% 132.7%
Natural disasters compared to U.S. average 24% 7%

Transportation

Jacksonville’s transportation system includes the Jacksonville Transportation Authority which operates bus, trolley, and monorail services, but most residents prefer using cars due to the city's size. Columbus Metropolitan Area Transit System operates buses in Columbus but the majority of residents also rely on personal vehicles for transportation.
Transport
Type Jacksonville Columbus
Amtrak stations 1 1
Amtrak stations nearby 1 1
FAA registered aircraft 566 85
FAA registered aircraft manufacturers and dealers 34 3
Means of transportation to work
Type Jacksonville Columbus
Bicycle 0.2% 0.1%
Bus 1.1% 1.1%
Carpooled 9% 14.6%
Car alone 86.5% 75.5%
Motorcycle 0.2% 0%
Taxicab 0.2% 0.3%
Walked 1.2% 4.7%
Means of transportation to work
Average travel time to work
Type Jacksonville Columbus
Average 27.5 min 20.5 min
Travel time to work
Time leaving to work
Travel time to work
Time leaving to work

Real Estate

The real estate market in both cities caters to a variety of budgets and preferences. Jacksonville’s real estate is more expensive, offering a mix of condos, suburban homes, and beachfront properties. Columbus provides a more affordable housing market, with a variety of single-family homes and condo options in a range of neighborhoods.

Neighborhoods

Jacksonville offers diverse neighborhoods from beachfront areas like Jacksonville Beach, to urban, historic neighborhoods such as Riverside and Avondale. Columbus is home to charming neighborhoods like Midtown, which blends historic homes with contemporary shopping and dining choices.
Houses and residents
Type Jacksonville Columbus
Houses 422,315 75,938
Average household size (people) 2.5 2.5
Houses occupied 386,283 (91.5%) 69,597 (91.7%)
Houses occupied by owners 226,429 (58.6%) 39,266 (56.4%)
Houses occupied by renters 159,854 (41.4%) 30,331 (43.6%)
Median rent asked for vacant for-rent units $1,444 $599.09
Median price asked for vacant for-sale houses and condos $260,045 $61,168
Estimated median house or condo value $239,400 $171,106
Median number of rooms in apartments 4.3 4.8
Median number of rooms in houses and condos 6.3 6.6
Housing density (houses/condos per square mile) 557.4 351.4
Household income disparities 44.2% 46.6%
Housing units without a mortgage 2,439 (1.6%) 9,803 (27%)
Housing units with both a second mortgage and home equity loan 8,460 (5.5%) 91 (0.3%)
Housing units with a mortgage 150,468 (98.4%) 26,511 (73%)
Housing units with a home equity loan 255 (0.2%) 2,477 (6.8%)
Housing units with a second mortgage 11,378 (7.4%) 3,939 (10.8%)
Housing units lacking complete kitchen facilities 1.5% 0.8%
Housing units lacking complete plumbing facilities 1.4% 0.5%
Housing units in structures
Housing units in structures JacksonvilleColumbus
One, detached 59.4% 65.5%
One, attached 6.1% 3.1%
Two 2.1% 3.4%
3 or 4 5.3% 6.8%
5 to 9 5.0% 7.5%
10 to 19 7.9% 4.0%
20 to 49 4.9% 2.3%
50 or more 5.3% 3.6%
Mobile homes 3.8% 3.8%
Boats, RVs, vans, etc. 0.2% 0.0%
Marital status
Type Jacksonville Columbus
Divorced 14.3% 11.9%
Never married 35.3% 29%
Now married 43.3% 47.6%
Separated 1.9% 3.7%
Widowed 5.1% 7.8%
Class of workers - percentage
Class of Workers JacksonvilleColumbus
Employee of private company 69.3% 67.4%
Private not-for-profit wage and salary workers 9.4% 5.3%
Local government workers 6.3% 7.6%
Self-employed workers in own not incorporated business 4.3% 5.3%
Self-employed in own incorporated business 4.1% 2.6%
Federal government workers 3.3% 6.4%
State government workers 3.0% 5.0%
Unpaid family workers 0.2% 0.3%
Class of workers - absolute values
Class of Workers JacksonvilleColumbus
Employee of private company 314,902 50,903
Federal government workers 15,074 4,836
Local government workers 28,766 5,760
Private not-for-profit wage and salary workers 42,775 4,010
Self-employed in own incorporated business 18,575 1,958
Self-employed workers in own not incorporated business 19,601 3,992
State government workers 13,692 3,806
Unpaid family workers 1,066 211

Industries and Occupations

Jacksonville's industries are quite diverse, including healthcare, financial services, and logistics. Columbus also has a diversified economy with manufacturing, healthcare, and retail trade, significantly supplemented by Fort Benning’s presence.
Food environment data per 10,000 residents
Food environment statistics JacksonvilleColumbus
Number of convenience stores (no gas) 3.3 4.8
Number of convenience stores (with gas) 1.5 0.1
Number of full-service restaurants 7.3 6.5
Number of grocery stores 2.7 1.9
Number of supercenters and club stores 0.1 0.1
Food environment - absolute values
Food environment statistics JacksonvilleColumbus
Number of convenience stores (no gas) 281 90
Number of convenience stores (with gas) 130 2
Number of full-service restaurants 614 121
Number of grocery stores 225 36
Number of supercenters and club stores 10 1
Obesity and diabetes
Food environment statistics rate JacksonvilleColumbus
Adult diabetes rate 10.4% 12.5%
Adult obesity rate 27.5% 30.6%
Low-income preschool obesity rate 10.9% 12.7%

Health Care

Both cities are well-equipped in health care. Jacksonville is home to numerous hospitals, including the Mayo Clinic, which is nationally recognised. Columbus also offers excellent healthcare resources including the Columbus Regional Health system and St. Francis Hospital.

Fatal vehicle accidents per 100,000 residents
Type Total count per 100,000Drunk per 100,000Fatal count per 100,000Pedestrian count per 100,000Person count per 100,000Vehicle count per 100,000
Year JacksonvilleColumbusJacksonvilleColumbusJacksonvilleColumbusJacksonvilleColumbusJacksonvilleColumbusJacksonvilleColumbus
2021 18.4 14.0 0.0 0.0 19.8 14.5 5.3 4.8 37.8 26.9 29.4 19.9
2020 18.1 10.8 4.7 1.6 19.5 10.8 6.1 5.4 35.1 23.7 27.8 17.8
2019 16.5 10.8 4.2 1.6 17.0 10.8 5.9 4.8 33.7 17.8 25.4 14.0
2018 14.2 9.7 4.2 2.2 15.5 11.3 5.2 2.7 31.9 20.5 22.2 14.0
2017 16.2 12.9 4.1 4.8 16.6 14.0 5.3 3.8 36.4 36.1 26.1 21.0
2016 16.2 14.0 4.9 3.2 17.2 14.5 5.3 3.2 34.7 35.0 25.4 21.5
2015 13.6 7.5 4.2 2.7 14.7 7.5 4.8 1.6 27.2 21.5 20.9 13.5
2014 12.3 9.2 4.7 1.6 13.0 9.2 4.2 1.6 29.5 18.8 18.9 16.7
2013 14.6 7.5 5.2 2.2 15.5 7.5 4.9 0.5 28.0 16.7 20.9 11.8
2012 13.3 9.7 5.0 2.7 13.7 10.8 4.8 3.2 26.8 20.5 19.6 15.1
2011 9.9 6.5 3.4 2.2 10.3 6.5 3.1 1.6 20.1 11.8 15.6 8.1
2010 12.4 7.0 4.7 1.1 13.0 7.0 3.3 1.1 25.1 17.2 18.4 12.4
2009 12.4 10.2 4.2 2.7 13.5 10.2 4.1 2.2 33.4 19.4 17.8 15.1
2008 14.2 10.2 5.9 3.2 14.7 10.8 2.5 1.1 35.7 30.7 21.7 19.4
2007 18.3 12.4 8.2 4.3 19.6 12.4 5.1 3.8 45.3 27.5 28.8 15.1
2006 16.3 14.0 5.4 5.4 17.0 14.5 3.8 2.7 45.2 35.0 27.2 22.6
2005 17.2 14.0 7.0 1.6 19.1 14.0 5.1 2.7 47.9 46.8 29.6 22.6
2004 15.0 7.0 5.7 0.0 15.8 8.1 4.4 1.1 37.9 16.7 22.5 10.8
2003 14.7 9.2 4.3 3.8 15.4 9.2 2.6 1.6 38.8 19.4 23.4 13.5
2002 13.6 9.2 4.5 2.2 15.4 10.8 3.0 1.1 36.8 24.2 20.9 14.0
2001 14.4 12.4 7.2 4.8 15.9 14.0 3.9 3.8 40.1 31.8 22.3 17.2
2000 13.5 9.2 5.7 2.2 13.9 9.7 3.5 1.6 33.7 24.8 19.3 16.1
1999 14.3 7.7 6.2 2.2 15.6 7.7 4.0 0.6 43.7 19.3 23.2 12.1
1998 12.2 11.0 3.6 1.1 13.7 11.5 4.8 4.9 36.6 26.9 18.3 13.7
1997 12.3 11.5 2.7 3.8 14.4 11.5 3.6 2.7 31.1 36.2 18.6 19.2
1996 14.4 11.5 3.8 2.2 15.8 11.5 3.9 1.7 40.5 34.1 21.4 19.2
1995 14.6 9.8 4.0 4.9 15.5 12.0 2.8 0.5 35.8 29.5 22.3 15.8
1994 13.6 9.7 4.7 0.5 15.5 10.2 3.7 2.2 39.1 23.1 22.5 16.7
1993 11.9 9.7 4.9 2.2 12.7 9.7 3.3 1.6 37.3 26.5 21.0 17.3
1992 11.4 13.0 5.8 5.4 12.0 14.6 2.9 4.9 30.9 30.2 16.2 18.4
1991 10.9 10.1 5.6 6.1 12.7 10.1 2.4 1.1 27.2 21.2 16.5 14.0
1990 14.0 8.9 7.3 3.9 15.2 8.9 0.0 0.0 36.3 15.1 20.8 11.7
1989 17.2 10.6 8.9 3.4 18.1 11.2 0.0 0.0 45.3 31.3 25.7 16.7
1988 14.7 12.8 6.6 2.2 16.1 12.8 0.0 0.0 40.6 41.3 22.5 22.3
1987 13.2 10.0 6.5 1.7 15.6 10.0 0.0 0.0 38.6 22.3 21.8 15.1
1986 18.7 11.7 6.5 5.0 20.2 12.8 0.0 0.0 50.8 26.2 28.0 16.7
1985 13.3 13.4 4.7 6.7 14.1 13.4 0.0 0.0 36.3 27.4 21.4 21.2
1984 15.4 10.6 6.4 5.0 17.3 11.7 0.0 0.0 39.4 23.4 23.9 14.0
1983 19.1 9.5 8.0 5.6 21.4 11.2 0.0 0.0 48.7 22.9 26.3 11.2
1982 18.8 10.0 5.9 3.4 19.4 10.6 0.0 0.0 46.8 24.6 25.0 14.5
1981 17.9 2.8 3.1 1.7 18.8 2.8 0.0 0.0 45.8 9.5 24.4 5.0
1980 19.6 0.0 4.2 0.0 21.2 0.0 0.0 0.0 51.0 0.0 25.9 0.0
1979 22.1 0.0 5.8 0.0 24.3 0.0 0.0 0.0 53.8 0.0 28.4 0.0
1978 18.3 0.0 4.8 0.0 19.9 0.0 0.0 0.0 52.8 0.0 24.7 0.0
1977 16.8 3.9 4.7 1.1 17.7 5.6 0.0 0.0 44.4 9.5 22.7 4.5
1976 18.8 13.4 1.4 0.0 19.9 15.1 0.0 0.0 48.5 30.1 24.4 16.7
1975 18.9 13.4 1.5 0.0 20.0 15.1 0.0 0.0 48.9 30.1 24.5 16.7

Fatal vehicle accidents
Type Total countDrunkFatal countPedestrian countPerson countVehicle count
Year JacksonvilleColumbusJacksonvilleColumbusJacksonvilleColumbusJacksonvilleColumbusJacksonvilleColumbusJacksonvilleColumbus
1975 104 24 8 0 110 27 0 0 269 54 135 30
1976 104 24 8 0 110 27 0 0 269 54 135 30
1977 94 7 26 2 99 10 0 0 248 17 127 8
1978 103 0 27 0 112 0 0 0 297 0 139 0
1979 125 0 33 0 138 0 0 0 305 0 161 0
1980 112 0 24 0 121 0 0 0 291 0 148 0
1981 104 5 18 3 109 5 0 0 266 17 142 9
1982 111 18 35 6 115 19 0 0 277 44 148 26
1983 115 17 48 10 129 20 0 0 293 41 158 20
1984 94 19 39 9 106 21 0 0 241 42 146 25
1985 83 24 29 12 88 24 0 0 226 49 133 38
1986 118 21 41 9 128 23 0 0 321 47 177 30
1987 85 18 42 3 100 18 0 0 248 40 140 27
1988 96 23 43 4 105 23 0 0 265 74 147 40
1989 114 19 59 6 120 20 0 0 300 56 170 30
1990 94 16 49 7 102 16 0 0 244 27 140 21
1991 74 18 38 11 86 18 16 2 185 38 112 25
1992 78 24 40 10 82 27 20 9 212 56 111 34
1993 82 18 34 4 88 18 23 3 258 49 145 32
1994 95 18 33 1 108 19 26 4 273 43 157 31
1995 103 18 28 9 109 22 20 1 252 54 157 29
1996 102 21 27 4 112 21 28 3 288 62 152 35
1997 88 21 19 7 103 21 26 5 223 66 133 35
1998 88 20 26 2 99 21 35 9 265 49 132 25
1999 104 14 45 4 114 14 29 1 319 35 169 22
2000 99 17 42 4 102 18 26 3 248 46 142 30
2001 108 23 54 9 119 26 29 7 300 59 167 32
2002 103 17 34 4 117 20 23 2 279 45 159 26
2003 113 17 33 7 118 17 20 3 298 36 180 25
2004 117 13 44 0 123 15 34 2 295 31 175 20
2005 135 26 55 3 150 26 40 5 377 87 233 42
2006 130 26 43 10 136 27 30 5 361 65 217 42
2007 147 23 66 8 158 23 41 7 365 51 232 28
2008 115 19 48 6 119 20 20 2 289 57 176 36
2009 101 19 34 5 110 19 33 4 272 36 145 28
2010 102 13 39 2 107 13 27 2 206 32 151 23
2011 82 12 28 4 85 12 26 3 166 22 129 15
2012 111 18 42 5 115 20 40 6 224 38 164 28
2013 123 14 44 4 131 14 41 1 236 31 176 22
2014 105 17 40 3 111 17 36 3 252 35 161 31
2015 118 14 36 5 127 14 42 3 236 40 181 25
2016 143 26 43 6 152 27 47 6 306 65 224 40
2017 145 24 37 9 148 26 47 7 325 67 233 39
2018 128 18 38 4 140 21 47 5 288 38 201 26
2019 151 20 38 3 155 20 54 9 308 33 232 26
2020 172 20 45 3 185 20 58 10 334 44 264 33
2021 176 26 0 0 189 27 51 9 361 50 281 37
Local government: full-time employees
Job JacksonvilleColumbus
Airports 289 46
Correction 870 117
Financial administration 693 82
Firefighters 1,283 383
Fire - other 92 8
Health 122 34
Judicial and legal 102 214
Local libraries 319 0
Other and unallocable 814 371
Other government administration 577 55
Parks and recreation 220 134
Police - other 572 131
Police protection - officers 1,681 761
Sewerage 350 17
Solid waste management 179 101
Streets and highways 18 140
Totals for government 9,314 2,704
Water supply 146 16
Water transport and terminals 146 0
Welfare 142 8
Local government: part-time employees
Job JacksonvilleColumbus
Airports 1 0
Financial administration 3 2
Gas supply 1 0
Other government administration 0 5
Parks and recreation 0 241
Police - other 0 64
Police protection - officers 0 2
Solid waste management 0 10
Streets and highways 0 1
Totals for government 9 415
Transit 0 2
Water transport and terminals 4 0
Mechanisms of homicide
Mechanism JacksonvilleColumbus
Homicides from 2000 to 2006 721 135
Cut / Pierce 76 22
Firearm 492 82
Struck by / against 22 0
Suffocation 31 0
Mechanisms of homicide per 1,000,000 residents
Mechanism JacksonvilleColumbus
Homicides from 2000 to 2006 126.9 103.2
Cut / Pierce 13.4 16.8
Firearm 86.6 62.7
Struck by / against 3.9 0
Suffocation 5.5 0
Mechanisms of suicide per 1,000,000 residents
Mechanism JacksonvilleColumbus
Suicides from 2000 to 2006 140.7 102.4
Firearm 79.2 68.8
Poisoning 27.5 0
Suffocation 22.7 0

Infrastructure

Jacksonville has an expansive infrastructure due to its size. It has an international airport, major highways, a deepwater port, and extensive hospitals. Columbus is more compact with a regional airport, standard highways, local transit, and several hospitals. Jacksonville's infrastructure is more extensive due to its larger population and the demand of a big city.
Infrastructure
Type Jacksonville Columbus
Hospitals 25 12
TV stations 17 10
Arenas or stadiums 2 1
Bank branches located here 191 50
Bank institutions located here 31 12
Main business address for public companies 23 5
Drinking water stations with no reported violations in the past 20 0
Drinking water stations with reported violations in the past 20 1

Schools

School facilities
Type Jacksonville Columbus
Private elementary/middle schools 38 7
Private high schools 56 6
Public elementary/middle schools 145 40
Public high schools 55 9
Colleges/Universities 30 8
HMDA - Conventional home purchase loans - Applications denied
Year JacksonvilleColumbus
1999 5,422 906
2000 4,132 767
2001 3,038 618
2002 2,017 304
2003 3,563 334
2004 4,781 431
2005 7,134 550
2006 8,812 565
2007 5,298 362
2008 1,719 132
2009 676 59

Culture and Food

Both cities offer a diverse culture. Jacksonville offers a vibrant arts scene, several museums, and a strong emphasis on live music. Its food scene is heavily influenced by Southern and coastal cuisine. Columbus, meanwhile, offers Southern charm, packed with historic sites and theaters. Its food is also Southern-inspired, with an emphasis on comfort foods and traditional dishes.

Sports Teams

Jacksonville is home to the Jacksonville Jaguars NFL team and attracts a lot of sports tourists for their games. Columbus, although it lacks major league teams, hosts minor league baseball and hockey teams, and offers a broad range of recreational sports.