Jacksonville, FL, and Brownsville, TX, are two vibrant American cities with distinct characteristics that attract both residents and tourists. Both cities offer unique living experiences shaped by their geographical conditions, cultural influences, and economy. Circumstantial factors like cost of living, quality of education, infrastructure, and weather can alter the quality of life significantly in both localities.
Distance between
Jacksonville, FL and
Brownsville, TX : 1,009.7 miles
Jacksonville's population is larger by 408%. Its population has grown by 218,997 people (29.8%) since 2000. The population of Brownsville has grown by 48,109 people (34.4%) during that time.
The overall crime rate in Jacksonville is higher than in Brownsville. Jacksonville's violent crime rate is considerably higher, making Brownsville appear safer. However, the property crime rate in both cities is comparable. Both cities have active community policing programs aimed to enhance safety and security.
Cost of Living
Living in Jacksonville is generally more expensive than in Brownsville. The overall cost of living, which includes housing, food, healthcare, utilities, and transportation, is higher in Jacksonville. However, many find these costs offset by higher wages and a greater range of services and amenities in Jacksonville.
Income Tax
Florida does not levy a state income tax, which may be an attractive aspect for those considering Jacksonville. However, Texas, where Brownsville is situated, also does not have a state income tax. For residents in both cities, this results in a lower tax burden overall.
Property Tax
Property tax rates in Florida are lower than in Texas. Jacksonville residents usually pay less in property taxes than those residing in Brownsville. This could be a favorable factor for homebuyers and property owners in Jacksonville.
Sales Tax
Florida, where Jacksonville is located, has a sales tax rate of 6% statewide, combined with a local surtax. Texas, the home of Brownsville, has a 6.25% state sales tax with an additional local sales tax, which can be as high as 2%.
Income
Type
Jacksonville
Brownsville
Estimated median household income
$58,621
$47,435
Estimated per capita income
$32,953
$19,429
Cost of living index (U.S. average is 100)
88.3
78.6
If you make $50,000 in Brownsville, you will have to make $56,170 in Jacksonville to maintain the same standard of living.
Geographical Conditions
Jacksonville is a coastal city with stunning beaches, while Brownsville, located near the Gulf of Mexico, is also close to beaches and features ecologically significant wetland sites. Both cities offer ample water-based recreational activities.
Both cities provide diverse educational opportunities. However, Jacksonville's education system is rated slightly better with higher test scores. The city is home to several reputable school districts and universities, providing good educational infrastructure for families. In Brownsville, the University of Texas at Brownsville offers diverse programs and the public school system is progressively improving.
The economy of Jacksonville is dominated by sectors like healthcare, finance, and logistics, while Brownsville's economy is heavily reliant on international trade, education, and space exploration. Job growth has been positive in both cities, although Jacksonville has a more diversified economic base, which can provide more job opportunities.
Biggest Employers
In Jacksonville, the largest employers include Baptist Health and the Naval Air Station. In Brownsville, the largest employers are the Brownsville Independent School District and the University of Texas at Brownsville.
There were 1,310 building permits issued in Jacksonville in 2012 (353 more than in 2011) compared to 883 building permits issued in Brownsville in 2012 (272 more than in 2011).
In Jacksonville (Duval County), 47.9% voted for Democrats and 51.5% for Republicans in 2012 Presidential Election. In Brownsville (Cameron County), 65.2% voted for Democrats and 34.1% for Republicans.
Elections
Type
Democrats
Republicans
Other
Year
Jacksonville
Brownsville
Jacksonville
Brownsville
Jacksonville
Brownsville
2020
51.3%
56.1%
47.5%
43.0%
1.2%
0.9%
2016
47.2%
64.6%
48.6%
32.1%
4.2%
3.3%
2012
47.9%
65.2%
51.5%
34.1%
0.6%
0.7%
2008
49.0%
63.8%
51.0%
35.1%
0.0%
1.2%
2004
41.7%
49.2%
57.9%
50.4%
0.3%
0.4%
2000
40.9%
53.5%
57.7%
44.8%
1.4%
1.7%
1996
44.2%
61.8%
50.0%
32.6%
5.8%
5.6%
Breakdown of population affiliated with a religious congregation
Type
Adherents
Congregations
Religion
Jacksonville
Brownsville
Jacksonville
Brownsville
SOUTHERN BAPTIST CONVENTION
15.8%
4.0%
22.3%
17.7%
CATHOLIC CHURCH
9.0%
33.9%
2.8%
11.6%
EPISCOPAL CHURCH
1.2%
0.4%
2.3%
1.5%
MUSLIM ESTIMATE
0.7%
0.6%
0.6%
0.3%
LUTHERAN CHURCH
0.3%
0.3%
0.7%
1.8%
SEVENTH DAY ADVENTIST CHURCH
0.3%
0.3%
1.4%
2.1%
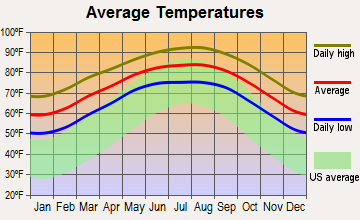
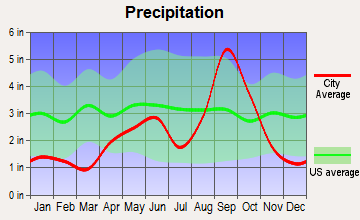
Weather
Weather-wise, Jacksonville, as a coastal city in Florida, enjoys a subtropical climate with mild winters and hot, humid summers. On the other hand, Brownsville experiences a semi-arid climate with hot summers and mild winters. Jacksonville typically gets more rain than Brownsville, which may be a consideration for potential residents or visitors.
Weather and climate
Type
Jacksonville
Brownsville
Temperature - Average
68.3°F
73.3°F
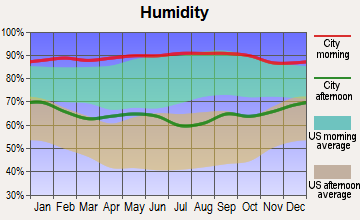
Humidity - Average morning or afternoon humidity
78.4%
81.1%
Humidity - Differences between morning and afternoon humidity
44%
37%
Humidity - Maximum monthly morning or afternoon humidity
92%
92%
Humidity - Minimum monthly morning or afternoon humidity
48%
55%
Precipitation - Yearly average
51.8 in
27.7 in
Snowfall - Yearly average
0 in
0 in
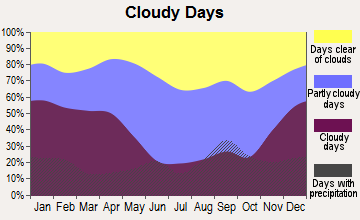
Clouds - Number of days clear of clouds
15.8%
16.1%
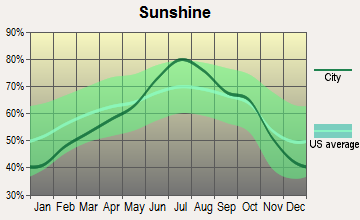
Sunshine amount - Average
69.6%
64.8%
Sunshine amount - Differences during a year
16%
42%
Sunshine amount - Maximum monthly
74%
80%
Sunshine amount - Minimum monthly
58%
38%
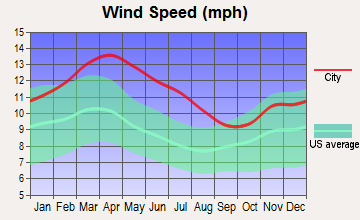
Wind speed - Average
7.2 mph
11.2 mph
Average climate in Jacksonville, Florida
Average climate in Brownsville, Texas
Air pollution
Type
AQI
CO
OZONE
PB
PM10
PM25
SO2
Year
Jacksonville
Brownsville
Jacksonville
Jacksonville
Brownsville
Jacksonville
Brownsville
Brownsville
Jacksonville
Brownsville
Jacksonville
2018
78
74
N/A
N/A
24.5
23.7
N/A
N/A
N/A
N/A
7.1
10.3
N/A
N/A
2017
74
58
N/A
N/A
24.7
23.7
N/A
N/A
N/A
N/A
5.8
8.4
0.7
N/A
2016
65
77
0.50
N/A
24.9
22.9
N/A
N/A
N/A
N/A
5.2
9.1
0.4
N/A
2015
63
77
0.35
N/A
25.4
22.1
N/A
N/A
N/A
N/A
4.9
9.4
0.3
N/A
2014
66
75
0.27
N/A
24.3
23.6
N/A
N/A
N/A
N/A
5.9
9.4
0.7
N/A
2013
68
74
0.18
N/A
23.0
25.0
N/A
N/A
N/A
N/A
5.3
9.3
0.7
N/A
2012
66
71
0.10
N/A
24.0
26.1
N/A
N/A
23.1
N/A
5.8
10.6
0.6
N/A
2011
88
72
0.28
N/A
26.6
27.2
N/A
N/A
22.7
N/A
8.1
10.6
0.8
N/A
2010
77
78
0.31
N/A
26.4
27.2
N/A
N/A
19.7
N/A
7.1
10.0
0.8
N/A
2009
72
73
0.16
N/A
25.0
26.1
N/A
N/A
23.8
N/A
8.5
11.0
0.6
N/A
2008
75
77
0.15
N/A
27.6
25.4
N/A
0.004
22.7
N/A
10.0
11.5
0.9
N/A
2007
92
74
0.29
N/A
28.4
23.5
N/A
0.003
27.0
N/A
11.4
10.8
1.2
N/A
2006
87
79
0.35
N/A
29.0
25.6
N/A
0.004
33.4
N/A
10.8
10.8
1.4
N/A
2005
93
79
0.42
N/A
26.5
26.7
N/A
0.003
29.4
N/A
12.2
11.1
1.8
N/A
2004
92
69
0.40
N/A
25.2
24.0
N/A
0.004
31.7
N/A
12.4
N/A
1.4
N/A
2003
55
74
0.43
N/A
21.6
24.2
N/A
0.008
38.1
N/A
N/A
N/A
1.6
N/A
2002
59
76
0.49
N/A
22.2
24.9
0.003
0.008
37.5
N/A
N/A
N/A
1.7
N/A
2001
74
59
0.49
N/A
24.0
24.7
0.009
0.008
32.3
N/A
N/A
N/A
2.5
N/A
2000
85
48
0.52
N/A
25.1
23.6
0.017
0.009
N/A
N/A
N/A
N/A
3.0
N/A
Natural disasters
Type
Jacksonville
Brownsville
Tornado activity compared to U.S. average
75.2%
18.3%
Earthquake activity compared to U.S. average
18.1%
17.2%
Natural disasters compared to U.S. average
24%
23%
Transportation
Jacksonville has better public transportation infrastructure with a comprehensive bus service, taxis, and river ferries. For those commuting by car, traffic in Jacksonville can be concerning during peak hours. Brownsville relies heavily on personal vehicles, with public transit options being limited.
Transport
Type
Jacksonville
Brownsville
Amtrak stations
1
1
Amtrak stations nearby
1
1
FAA registered aircraft
566
60
FAA registered aircraft manufacturers and dealers
34
7
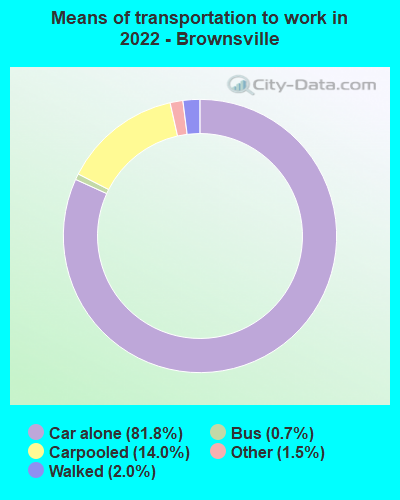
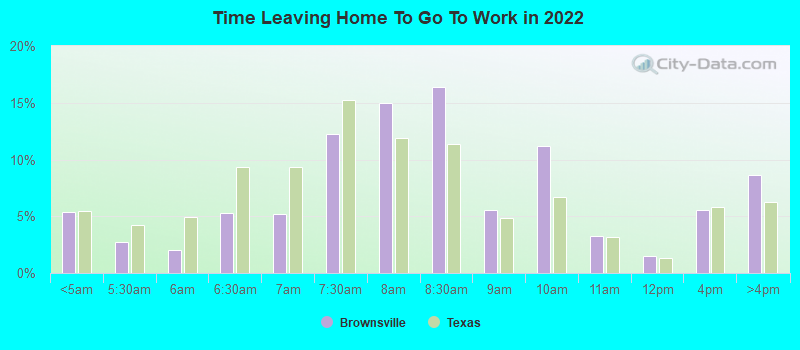
Means of transportation to work
Type
Jacksonville
Brownsville
Bicycle
0.2%
0.1%
Bus
1.1%
0.7%
Carpooled
9%
9.6%
Car alone
86.5%
86.6%
Motorcycle
0.2%
0.1%
Taxicab
0.2%
0.1%
Walked
1.2%
1.7%
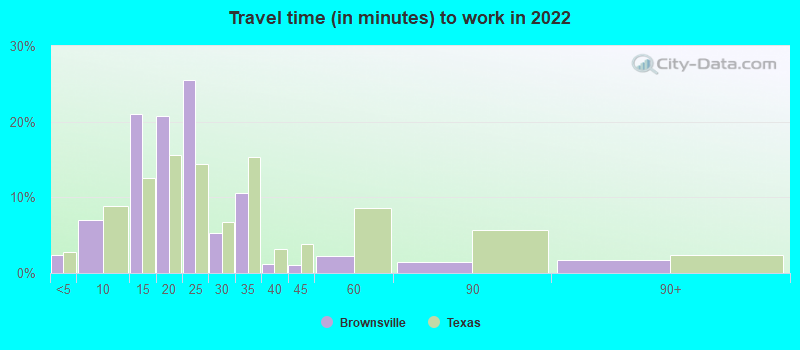
Average travel time to work
Type
Jacksonville
Brownsville
Average
27.5 min
21.7 min
Other means
25 min
21 min
Public transportation
43.7 min
39.3 min
Private vehicle occupancy
Type
Jacksonville
Brownsville
Average
1.1
1.2
Drove alone
89.4%
85.8%
In 2 person carpool
8%
9.8%
In 3 person carpool
1.7%
3.4%
In 4 person carpool
0.7%
0.4%
In 5-6 person carpool
0%
0.5%
In 7+ person carpool
0.2%
0.1%
How many people usually rode to work in the car, truck or van.
Real Estate
The real estate market in Jacksonville has seen consistent growth with median home prices being higher than in Brownsville. Brownsville offers a much affordable housing market, making it an attractive place for those looking for budget-friendly options.
Neighborhoods
Jacksonville is home to diverse neighborhoods, ranging from upscale areas like San Marco and Riverside, to family-oriented suburbs like Mandarin. Brownsville's neighborhoods like Paredes Line offer a blend of commercial and residential environments with an authentic Texan feel.
Houses and residents
Type
Jacksonville
Brownsville
Houses
422,315
62,000
Average household size (people)
2.5
3.5
Median year apartment built
1985
1990
Median year house/condo built
1987
1998
Length of stay in the house since moving in
12.5 years
14.2 years
Houses occupied
386,283 (91.5%)
56,522 (91.2%)
Houses occupied by owners
226,429 (58.6%)
34,440 (60.9%)
Houses occupied by renters
159,854 (41.4%)
22,082 (39.1%)
Median rent asked for vacant for-rent units
$1,444
$396.05
Median monthly housing costs
$1,154
$721
Median price asked for vacant for-sale houses and condos
$260,045
$221,063
Estimated median house or condo value
$239,400
$104,100
Median numbers of rooms
5.6
4.8
Median number of rooms in apartments
4.3
3.9
Median number of rooms in houses and condos
6.3
5.3
Median house price - detached houses
$282,276
$124,259
Median house price - in 2-unit structures
$177,341
Over $1,000,000
Median house price - in 3-to-4-unit structures
$144,947
$73,104
Median house price - in 5 or more unit structures
$220,508
$97,341
Median house price - mobile homes
$87,589
$47,840
Median house price - Townhouses or other attached units
$213,709
$133,815
Median house price - All housing units
$266,926
$130,508
Median house age
36
27
Renting percentage
38.3%
37.8%
Housing density (houses/condos per square mile)
557.4
771.1
House value disparities
33.2%
35.7%
Household income disparities
44.2%
46.1%
Median household income for houses/condes with a mortgage
$83,160
$74,174
Median household income for apartments without a mortgage
$59,777
$41,503
Housing units without a mortgage
2,439 (1.6%)
96 (0.7%)
Housing units with both a second mortgage and home equity loan
8,460 (5.5%)
172 (1.2%)
Housing units with a mortgage
150,468 (98.4%)
14,310 (99.3%)
Housing units with a home equity loan
255 (0.2%)
0 (0%)
Housing units with a second mortgage
11,378 (7.4%)
169 (1.2%)
House/condo owner moved in on average (years ago)
10
14
House/condo renter moved in on average (years ago)
1
1
Housing units lacking complete kitchen facilities
1.5%
2.8%
Housing units lacking complete plumbing facilities
1.4%
2.6%
Housing units in structures
Housing units in structures
Jacksonville
Brownsville
One, detached
59.4%
72.1%
One, attached
6.1%
1.0%
Two
2.1%
3.6%
3 or 4
5.3%
6.5%
5 to 9
5.0%
2.5%
10 to 19
7.9%
2.4%
20 to 49
4.9%
3.4%
50 or more
5.3%
4.0%
Mobile homes
3.8%
4.4%
Boats, RVs, vans, etc.
0.2%
0.2%
Median real estate property taxes paid for housing units
Self-employed workers in own not incorporated business
19,601
4,372
State government workers
13,692
1,984
Unpaid family workers
1,066
261
Industries and Occupations
Jacksonville is known for its financial services sector with notable companies like Fidelity National Financial, while Brownsville's economy primarily hinges on sectors like international trade with Mexico and space industry. Cargo operations also play a crucial role in both cities' economies.
Jacksonville is renowned for its excellent healthcare system with notable institutions like Mayo Clinic and ample primary care options. Brownsville’s healthcare system is developing with well-respected Valley Baptist Medical Center and public health initiatives aiming to improve community health.
Jacksonville's infrastructure is continually improving, with modern buildings, well-maintained roads, and reliable utilities. Brownsville also boasts a solid infrastructure but lacks the urban sophistication of Jacksonville. However, both cities continue to invest in their infrastructure, including improved public transit and roadways.
Infrastructure
Type
Jacksonville
Brownsville
Hospitals
25
7
TV stations
17
12
Bank branches located here
191
40
Bank institutions located here
31
15
Drinking water stations with no reported violations in the past
20
1
Drinking water stations with reported violations in the past
HMDA - Conventional home purchase loans - Applications denied
Year
Jacksonville
Brownsville
1999
5,422
489
2000
4,132
157
2001
3,038
124
2002
2,017
107
2003
3,563
364
2004
4,781
554
2005
7,134
685
2006
8,812
874
2007
5,298
612
2008
1,719
230
2009
676
105
Culture and Food
Both cities have rich cultural scenes. Jacksonville, being larger, offers more cultural diversity with numerous art galleries, music festivals, and a popular food scene with influences from the South, Caribbean, and Asia. Brownsville has a strong Mexican influence, evident in its popular local cuisine and vibrant cultural festivals.
Sports Teams
Jacksonville is home to the NFL’s Jacksonville Jaguars and minor league baseball's Jumbo Shrimp. Brownsville does not host any major sports teams but offers opportunities for outdoor recreational sports like fishing, bird watching, and beach activities.


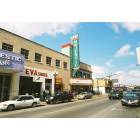
 Jacksonville, FL
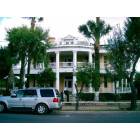
 Brownsville, TX