Jacksonville, FL, and Arlington, VA, are both vibrant cities with their distinct attributes. Jacksonville, known for its warm weather and relaxed pace of life, contrasts against bustling Arlington, with its proximity to Washington DC and strong job market. This comparison seeks to provide prospective visitors or residents with insights into critical parameters such as crime/safety, cost of living, education, and more.
Distance between
Jacksonville, FL and
Arlington, VA : 645.4 miles
Jacksonville's population is larger by 310%. Its population has grown by 218,997 people (29.8%) since 2000. The population of Arlington has grown by 43,512 people (23.0%) during that time.
In terms of safety, Arlington, VA outperforms Jacksonville, FL. According to crime statistics, Arlington is considered as one of the safest cities in the US. For Jacksonville, the crime rate runs a bit higher than the national average, making Arlington safer both for visitors and residents. While Jacksonville has made strides in improving safety, it still lags behind Arlington in this regard.
Cost of Living
Living in Arlington, VA, is generally more expensive compared to Jacksonville, FL. The former’s vicinity to Washington D.C. may contribute to this aspect, including housing costs, which are notably higher in Arlington. Thus, those planning to relocate or visit may find Jacksonville more cost-effective.
Income Tax
Jacksonville offers a significant advantage here as Florida does not levy a state income tax. Arlington residents, however, are subject to Virginia’s progressive state income tax.
Property Tax
While Arlington's property taxes are higher, this could be offset by the higher incomes generally earned within the area. Conversely, Jacksonville has lower property taxes, in line with its overall lower cost of living.
Sales Tax
Florida does not have a state income tax, making Jacksonville lucrative in terms of taxation. Conversely, Arlington, like all of Virginia, levies a 4.3% state sales tax and 1% local sales tax.
Income
Type
Jacksonville
Arlington
Estimated median household income
$58,621
$125,651
Estimated per capita income
$32,953
$80,996
Cost of living index (U.S. average is 100)
88.3
171.8
If you make $50,000 in Jacksonville, you will have to make $97,282 in Arlington to maintain the same standard of living.
Geographical Conditions
Jacksonville boasts many beaches, waterways and the St. Johns River. Arlington, while landlocked, is located on the Potomac River’s western bank and is in close proximity to Washington D.C.
Arlington boasts a high-performing school district that is consistently ranked among the best in Virginia. Additionally, it’s home to several top-rated universities. Jacksonville also provides robust education opportunities evident through decent public, private schools and higher education institutions, but overall, Arlington's educational sector outshines that of Jacksonville.
Arlington has a robust job market, thanks to its proximity to Washington D.C. Jobs in the government sector, defense, technology and consulting are widely available. In contrast, Jacksonville's economy is heavily rooted in logistics, banking, healthcare, and the military, making it a diverse job market.
Biggest Employers
In both cities, the federal government is a significant employer. In Arlington, other big employers include Deloitte, Accenture, and Lockheed Martin. Jacksonville's biggest employers include Deutsche Bank, Baptist Health, and Bank of America.
In Jacksonville (Duval County), 47.9% voted for Democrats and 51.5% for Republicans in 2012 Presidential Election. In Arlington (Arlington County), 69.3% voted for Democrats and 29.4% for Republicans.
Elections
Type
Democrats
Republicans
Other
Year
Jacksonville
Arlington
Jacksonville
Arlington
Jacksonville
Arlington
2020
51.3%
80.6%
47.5%
17.1%
1.2%
2.3%
2016
47.2%
75.8%
48.6%
16.6%
4.2%
7.5%
2012
47.9%
69.3%
51.5%
29.4%
0.6%
1.3%
2008
49.0%
71.8%
51.0%
27.2%
0.0%
1.0%
2004
41.7%
67.6%
57.9%
31.3%
0.3%
1.1%
2000
40.9%
60.4%
57.7%
34.3%
1.4%
5.3%
1996
44.2%
60.5%
50.0%
34.6%
5.8%
4.9%
Breakdown of population affiliated with a religious congregation
Type
Adherents
Congregations
Religion
Jacksonville
Arlington
Jacksonville
Arlington
SOUTHERN BAPTIST CONVENTION
15.8%
1.3%
22.3%
16.8%
CATHOLIC CHURCH
9.0%
14.6%
2.8%
6.2%
EPISCOPAL CHURCH
1.2%
2.0%
2.3%
8.0%
MUSLIM ESTIMATE
0.7%
1.7%
0.6%
0.9%
EVANGELICAL LUTHERAN CHURCH IN AMERICA
0.3%
0.6%
0.9%
2.7%
SEVENTH DAY ADVENTIST CHURCH
0.3%
0.1%
1.4%
1.8%
AMERICAN BAPTIST CHURCHES IN THE USA
0.1%
0.5%
0.2%
2.7%
Weather
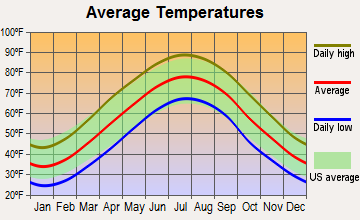
Weather preferences may be subjective, but Jacksonville boasts of warm, beautiful weather almost all year round, making it a great spot for tourists and residents who love sunny days. Arlington, in contrast, experiences the four seasons with colder winters and milder, less humid summers. This could be a deciding factor for those contemplating a move or a visit to either city.
Weather and climate
Type
Jacksonville
Arlington
Temperature - Average
68.3°F
56.6°F
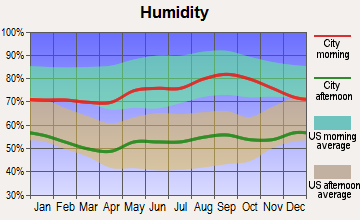
Humidity - Average morning or afternoon humidity
78.4%
68.8%
Humidity - Differences between morning and afternoon humidity
44%
33%
Humidity - Maximum monthly morning or afternoon humidity
92%
81%
Humidity - Minimum monthly morning or afternoon humidity
48%
48%
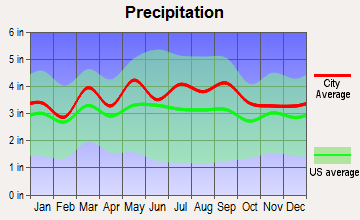
Precipitation - Yearly average
51.8 in
43.4 in
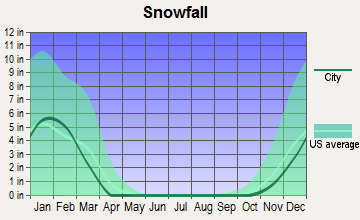
Snowfall - Yearly average
0 in
32.4 in
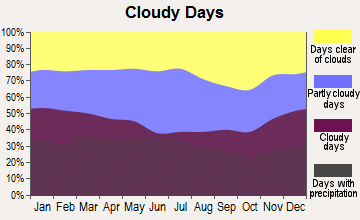
Clouds - Number of days clear of clouds
15.8%
15.9%
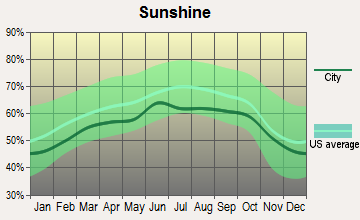
Sunshine amount - Average
69.6%
61.5%
Sunshine amount - Differences during a year
16%
21%
Sunshine amount - Maximum monthly
74%
66%
Sunshine amount - Minimum monthly
58%
45%
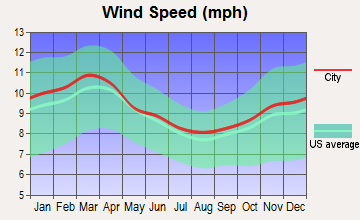
Wind speed - Average
7.2 mph
9.7 mph
Average climate in Jacksonville, Florida
Average climate in Arlington, Virginia
Air pollution
Type
AQI
CO
NO2
OZONE
PB
PM10
PM25
SO2
Year
Jacksonville
Arlington
Jacksonville
Arlington
Arlington
Jacksonville
Arlington
Jacksonville
Arlington
Arlington
Jacksonville
Arlington
Jacksonville
Arlington
2018
78
88
N/A
0.30
9.1
N/A
24.5
26.2
N/A
N/A
16.4
N/A
7.1
8.4
N/A
0.7
2017
74
84
N/A
0.25
9.5
N/A
24.7
27.7
N/A
N/A
16.5
N/A
5.8
9.0
0.7
0.7
2016
65
98
0.50
0.25
10.6
N/A
24.9
27.5
N/A
0.002
17.2
N/A
5.2
8.7
0.4
0.8
2015
63
91
0.35
0.34
10.9
N/A
25.4
26.7
N/A
0.002
17.0
N/A
4.9
9.5
0.3
1.1
2014
66
85
0.27
0.27
10.9
N/A
24.3
26.2
N/A
0.002
17.1
N/A
5.9
9.3
0.7
1.0
2013
68
90
0.18
0.33
10.9
N/A
23.0
26.6
N/A
0.002
17.3
N/A
5.3
10.1
0.7
0.8
2012
66
104
0.10
0.33
11.7
N/A
24.0
27.9
N/A
0.002
N/A
N/A
5.8
10.9
0.6
1.0
2011
88
105
0.28
0.18
12.3
N/A
26.6
28.4
N/A
0.002
N/A
N/A
8.1
11.0
0.8
1.5
2010
77
114
0.31
0.23
12.9
N/A
26.4
29.8
N/A
0.003
N/A
N/A
7.1
9.7
0.8
2.5
2009
72
90
0.16
0.24
12.7
N/A
25.0
24.7
N/A
0.002
N/A
N/A
8.5
8.1
0.6
2.7
2008
75
103
0.15
0.23
13.3
N/A
27.6
25.8
N/A
0.003
N/A
N/A
10.0
8.9
0.9
4.3
2007
92
113
0.29
0.28
15.6
N/A
28.4
27.7
N/A
0.004
N/A
N/A
11.4
10.4
1.2
4.5
2006
87
114
0.35
0.49
17.7
N/A
29.0
25.9
N/A
0.004
N/A
N/A
10.8
10.9
1.4
4.3
2005
93
105
0.42
0.30
21.0
N/A
26.5
23.6
N/A
0.006
N/A
N/A
12.2
11.7
1.8
5.7
2004
92
114
0.40
0.22
21.6
N/A
25.2
23.5
N/A
0.004
N/A
N/A
12.4
11.3
1.4
5.9
2003
55
108
0.43
0.36
26.0
N/A
21.6
21.7
N/A
N/A
N/A
N/A
N/A
12.2
1.6
6.1
2002
59
131
0.49
0.48
21.8
N/A
22.2
25.9
0.003
N/A
N/A
N/A
N/A
N/A
1.7
6.0
2001
74
111
0.49
0.43
22.1
N/A
24.0
24.1
0.009
0.017
N/A
N/A
N/A
N/A
2.5
7.2
2000
85
110
0.52
0.50
22.7
N/A
25.1
20.2
0.017
N/A
N/A
N/A
N/A
N/A
3.0
10.1
Natural disasters
Type
Jacksonville
Arlington
Tornado activity compared to U.S. average
75.2%
110%
Earthquake activity compared to U.S. average
18.1%
43.5%
Natural disasters compared to U.S. average
24%
14%
Transportation
Both cities offer robust transportation options. However, Arlington, with its metro system and compact layout, is more commuter-friendly. Jacksonville, due to its sprawling size, is predominantly car-centric with limited public transit options.
Transport
Type
Jacksonville
Arlington
Amtrak stations
1
0
Amtrak stations nearby
1
3
FAA registered aircraft
566
103
FAA registered aircraft manufacturers and dealers
34
5
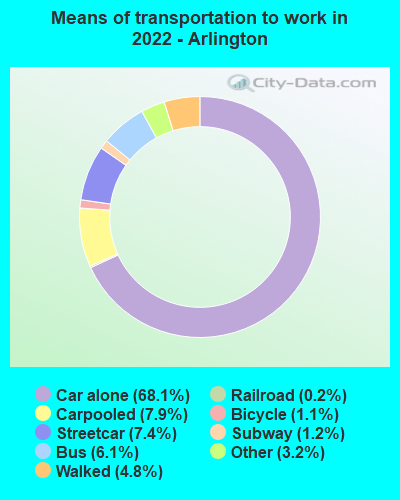
Means of transportation to work
Type
Jacksonville
Arlington
Bicycle
0.2%
0.8%
Bus
1.1%
3.6%
Carpooled
9%
6.5%
Car alone
86.5%
71.3%
Motorcycle
0.2%
0.1%
Railroad
0%
0.4%
Streetcar
0%
7.8%
Subway
0%
1.1%
Taxicab
0.2%
0.4%
Walked
1.2%
6%
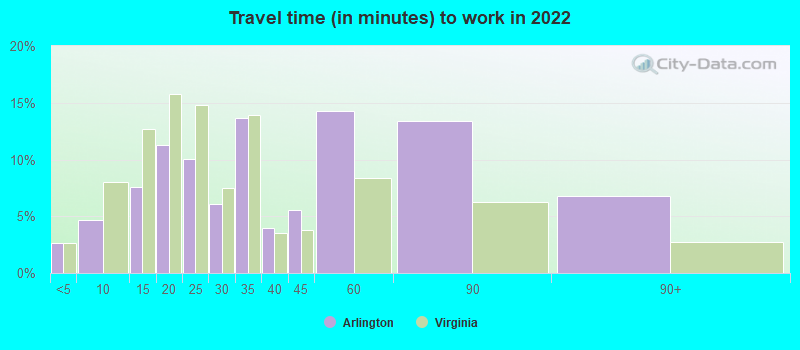
Average travel time to work
Type
Jacksonville
Arlington
Average
27.5 min
34.8 min
Other means
25 min
25.7 min
Public transportation
43.7 min
36.7 min
Private vehicle occupancy
Type
Jacksonville
Arlington
Average
1.1
1.1
Drove alone
89.4%
92.8%
In 2 person carpool
8%
6.3%
In 3 person carpool
1.7%
0.8%
In 4 person carpool
0.7%
0.1%
In 7+ person carpool
0.2%
0%
How many people usually rode to work in the car, truck or van.
Real Estate
Real estate in Arlington is typically more expensive than in Jacksonville due to its proximity to Washington DC, creating higher demand. Jacksonville offers a variety of housing styles at a lower cost – appealing to individuals seeking affordable housing opportunities.
Neighborhoods
Jacksonville neighborhoods range from urban downtown areas to beachfront communities, offering plenty of diversity. Arlington is compact and highly urbanized, with neighborhoods close to dining, shopping, and transportation options.
Houses and residents
Type
Jacksonville
Arlington
Houses
422,315
119,446
Average household size (people)
2.5
2.1
Median year apartment built
1985
1983
Median year house/condo built
1987
1959
Length of stay in the house since moving in
12.5 years
12.7 years
Houses occupied
386,283 (91.5%)
108,396 (90.7%)
Houses occupied by owners
226,429 (58.6%)
47,577 (43.9%)
Houses occupied by renters
159,854 (41.4%)
60,819 (56.1%)
Median rent asked for vacant for-rent units
$1,444
$3,620
Median monthly housing costs
$1,154
$2,164
Median price asked for vacant for-sale houses and condos
$260,045
$891,291
Estimated median house or condo value
$239,400
$779,400
Median numbers of rooms
5.6
4.1
Median number of rooms in apartments
4.3
3.3
Median number of rooms in houses and condos
6.3
6.7
Median house price - detached houses
$282,276
Over $1,000,000
Median house price - in 2-unit structures
$177,341
$648,538
Median house price - in 3-to-4-unit structures
$144,947
$442,578
Median house price - in 5 or more unit structures
$220,508
$566,559
Median house price - Townhouses or other attached units
$213,709
$703,291
Median house price - All housing units
$266,926
$877,770
Median house age
36
47
Renting percentage
38.3%
56.7%
Housing density (houses/condos per square mile)
557.4
4,617.2
House value disparities
33.2%
24.9%
Household income disparities
44.2%
37.5%
Median household income for houses/condes with a mortgage
$83,160
$201,635
Median household income for apartments without a mortgage
$59,777
$133,857
Housing units without a mortgage
2,439 (1.6%)
596 (1.6%)
Housing units with both a second mortgage and home equity loan
8,460 (5.5%)
3,235 (8.9%)
Housing units with a mortgage
150,468 (98.4%)
35,674 (98.4%)
Housing units with a home equity loan
255 (0.2%)
101 (0.3%)
Housing units with a second mortgage
11,378 (7.4%)
4,221 (11.6%)
House/condo owner moved in on average (years ago)
10
10
House/condo renter moved in on average (years ago)
1
1
Housing units lacking complete kitchen facilities
1.5%
0.7%
Housing units lacking complete plumbing facilities
1.4%
0.2%
Housing units in structures
Housing units in structures
Jacksonville
Arlington
One, detached
59.4%
25.1%
One, attached
6.1%
9.6%
Two
2.1%
0.8%
3 or 4
5.3%
3.5%
5 to 9
5.0%
5.2%
10 to 19
7.9%
5.0%
20 to 49
4.9%
4.6%
50 or more
5.3%
46.1%
Mobile homes
3.8%
0.2%
Boats, RVs, vans, etc.
0.2%
0.0%
Median real estate property taxes paid for housing units
Self-employed workers in own not incorporated business
19,601
6,119
State government workers
13,692
1,820
Unpaid family workers
1,066
32
Industries and Occupations
Arlington's major industries include government services, defense, and technology. Jacksonville, however, is known for its diversity in industries such as transportation and logistics, finance, healthcare, information services, and the military.
Both cities possess high-quality health care systems. However, Jacksonville is renowned for its Mayo Clinic, one of the top-rated hospitals in the nation.
Both cities boast impressive infrastructure. Arlington, being part of the Washington DC metro area, benefits from state-of-the-art amenities. Jacksonville, on the other hand, is the largest city area-wise in the contiguous US and has invested heavily in infrastructure including highways, bridges, and public facilities.
Infrastructure
Type
Jacksonville
Arlington
Hospitals
25
6
TV stations
17
25
Bank branches located here
191
82
Bank institutions located here
31
25
Main business address for public companies
23
17
Drinking water stations with no reported violations in the past
20
0
Drinking water stations with reported violations in the past
HMDA - Conventional home purchase loans - Applications denied
Year
Jacksonville
Arlington
1999
5,422
226
2000
4,132
196
2001
3,038
164
2002
2,017
146
2003
3,563
288
2004
4,781
461
2005
7,134
589
2006
8,812
563
2007
5,298
412
2008
1,719
272
2009
676
173
Culture and Food
Jacksonville offers a blend of relaxed coastal culture, with a strong focus on outdoor activities and water sports. The culinary scene is diverse. Arlington is rich in historical culture and offers a variety of dining options, being so close to a thriving metropolitan area.
Sports Teams
Jacksonville is home to the Jacksonville Jaguars NFL team, while Arlington does not have a home team. Instead, residents often support teams from the nearby Washington DC area.


 Jacksonville, FL
 Arlington, VA