When considering relocating or visiting a new city, understanding the nuances of each location can greatly enhance one's overall experience. This comparison between Jacksonville, FL and Akron, OH highlights crucial differences and similarities across vital sectors like crime, cost of living, employment opportunities, lifestyle, and amenities. Both cities exhibit their unique charm, influenced by their geographical locations, dominant industries, and cultural narratives.
Distance between
Jacksonville, FL and
Akron, OH : 743.0 miles
Jacksonville's population is larger by 404%. Its population has grown by 218,997 people (29.8%) since 2000. The population of Akron has decreased by 27,727 people (12.8%) during that time.
Jacksonville's crime rate is higher than the national average and also exceeds that of Akron. While efforts are consistently being made to enhance security, crime remains a concern for both residents and tourists. Akron, while smaller, offers more safety with its crime rate being slightly lower than the national average. It is crucial to research individual neighborhood crime rates in both cities before making a relocating decision.
Cost of Living
Generally, living expenses in Akron are lower than in Jacksonville. Housing is particularly less expensive in Akron. Items like groceries, health services, and goods and services are comparably priced in both cities, but Jacksonville typically trends slightly higher in these categories.
Income Tax
A significant advantage for Jacksonville residents is the absence of state income tax, a benefit not shared by Akron residents who are subject to Ohio's progressive income tax system.
Property Tax
Jacksonville has higher property tax rates as compared to Akron. It is important to consider this factor when purchasing property in either city.
Sales Tax
Florida has a higher state sales tax rate than Ohio. However, Jacksonville has no local sales tax, unlike Akron.
Income
Type
Jacksonville
Akron
Estimated median household income
$58,621
$41,628
Estimated per capita income
$32,953
$25,307
Cost of living index (U.S. average is 100)
88.3
95.7
If you make $50,000 in Jacksonville, you will have to make $54,190 in Akron to maintain the same standard of living.
Geographical Conditions
Jacksonville offers miles of beaches, a riverfront, and access to multiple state parks. Akron, located in the Rust Belt, is known for its beautiful park system, including the Cuyahoga Valley National Park close by.
Both cities offer solid education systems. Jacksonville has more schools and colleges, catering to a wider range of academic needs. Akron's education system is smaller but well regarded, with good school and universities such as the University of Akron.
Jacksonville's economy is diversified, with a strong presence in the military, banking, logistics, and healthcare sectors. In contrast, Akron is historically known for its rubber and polymer industries, with a growing healthcare sector.
Biggest Employers
In Jacksonville, the biggest employers are the military, medical centers like Baptist Health and Mayo Clinic, and banking corporations like Bank of America. In Akron, Akron Children's Hospital, Goodyear Tire & Rubber, and the University of Akron are some of the largest employers.
There were 1,310 building permits issued in Jacksonville in 2012 (353 more than in 2011) compared to 33 building permits issued in Akron in 2012.
In Jacksonville (Duval County), 47.9% voted for Democrats and 51.5% for Republicans in 2012 Presidential Election. In Akron (Summit County), 57.3% voted for Democrats and 41.6% for Republicans.
Elections
Type
Democrats
Republicans
Other
Year
Jacksonville
Akron
Jacksonville
Akron
Jacksonville
Akron
2020
51.3%
53.9%
47.5%
44.4%
1.2%
1.7%
2016
47.2%
51.7%
48.6%
43.2%
4.2%
5.1%
2012
47.9%
57.3%
51.5%
41.6%
0.6%
1.1%
2008
49.0%
57.9%
51.0%
40.8%
0.0%
1.3%
2004
41.7%
56.9%
57.9%
43.1%
0.3%
0.0%
2000
40.9%
53.4%
57.7%
43.1%
1.4%
3.5%
1996
44.2%
52.1%
50.0%
34.2%
5.8%
13.8%
Breakdown of population affiliated with a religious congregation
Type
Adherents
Congregations
Religion
Jacksonville
Akron
Jacksonville
Akron
SOUTHERN BAPTIST CONVENTION
15.8%
0.3%
22.3%
3.3%
CATHOLIC CHURCH
9.0%
21.6%
2.8%
6.8%
EPISCOPAL CHURCH
1.2%
0.9%
2.3%
2.1%
MUSLIM ESTIMATE
0.7%
0.3%
0.6%
0.4%
EVANGELICAL LUTHERAN CHURCH IN AMERICA
0.3%
0.9%
0.9%
2.9%
LUTHERAN CHURCH
0.3%
0.9%
0.7%
2.5%
SEVENTH DAY ADVENTIST CHURCH
0.3%
0.2%
1.4%
1.0%
AMERICAN BAPTIST CHURCHES IN THE USA
0.1%
0.4%
0.2%
1.6%
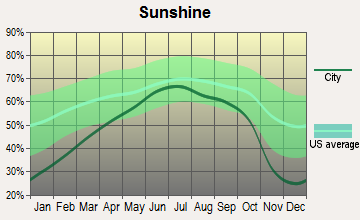
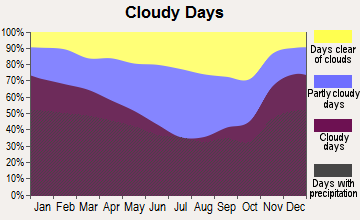
Weather
If you prefer warm, sunny weather, Jacksonville offers a subtropical climate with hot summers and mild winters. In contrast, Akron has a humid continental climate, with cold winters and warm, humid summers offering a more seasonal variability.
Weather and climate
Type
Jacksonville
Akron
Temperature - Average
68.3°F
49.2°F
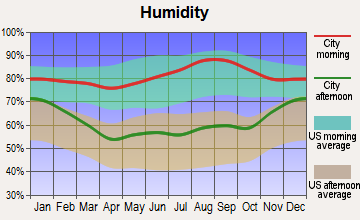
Humidity - Average morning or afternoon humidity
78.4%
76.7%
Humidity - Differences between morning and afternoon humidity
44%
32.8%
Humidity - Maximum monthly morning or afternoon humidity
92%
86.9%
Humidity - Minimum monthly morning or afternoon humidity
48%
54.1%
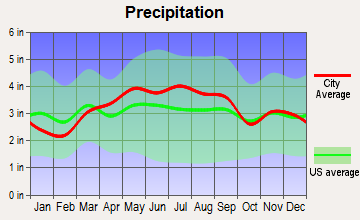
Precipitation - Yearly average
51.8 in
38.8 in
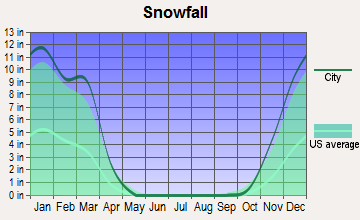
Snowfall - Yearly average
0 in
96.2 in
Clouds - Number of days clear of clouds
15.8%
11.2%
Sunshine amount - Average
69.6%
51.6%
Sunshine amount - Differences during a year
16%
43.6%
Sunshine amount - Maximum monthly
74%
65.7%
Sunshine amount - Minimum monthly
58%
22.1%
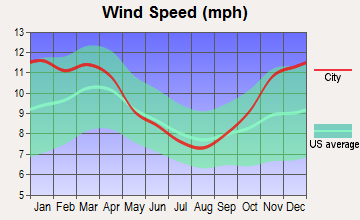
Wind speed - Average
7.2 mph
9.9 mph
Average climate in Jacksonville, Florida
Average climate in Akron, Ohio
Air pollution
Type
AQI
CO
OZONE
PB
PM10
PM25
SO2
Year
Jacksonville
Akron
Jacksonville
Akron
Jacksonville
Akron
Jacksonville
Akron
Jacksonville
Akron
Jacksonville
Akron
2018
78
78
N/A
0.18
24.5
29.5
N/A
N/A
N/A
N/A
7.1
9.0
N/A
0.1
2017
74
76
N/A
0.06
24.7
31.0
N/A
N/A
N/A
N/A
5.8
8.5
0.7
0.1
2016
65
80
0.50
0.10
24.9
27.1
N/A
N/A
N/A
N/A
5.2
10.3
0.4
0.3
2015
63
92
0.35
0.12
25.4
27.8
N/A
N/A
N/A
N/A
4.9
13.9
0.3
1.0
2014
66
59
0.27
0.13
24.3
26.2
N/A
N/A
N/A
N/A
5.9
7.4
0.7
2.2
2013
68
62
0.18
0.18
23.0
26.2
N/A
N/A
N/A
N/A
5.3
8.9
0.7
2.9
2012
66
90
0.10
0.13
24.0
30.4
N/A
N/A
N/A
N/A
5.8
12.9
0.6
2.7
2011
88
91
0.28
0.09
26.6
31.0
N/A
N/A
N/A
N/A
8.1
10.8
0.8
3.2
2010
77
112
0.31
0.16
26.4
32.0
N/A
N/A
N/A
N/A
7.1
15.3
0.8
2.5
2009
72
64
0.16
0.27
25.0
26.9
N/A
N/A
N/A
N/A
8.5
N/A
0.6
1.9
2008
75
71
0.15
0.31
27.6
33.6
N/A
N/A
N/A
N/A
10.0
N/A
0.9
2.8
2007
92
77
0.29
0.29
28.4
36.1
N/A
N/A
N/A
N/A
11.4
N/A
1.2
3.2
2006
87
64
0.35
0.42
29.0
30.9
N/A
N/A
N/A
N/A
10.8
N/A
1.4
4.2
2005
93
88
0.42
0.42
26.5
33.1
N/A
N/A
N/A
N/A
12.2
N/A
1.8
4.5
2004
92
74
0.40
0.41
25.2
27.1
N/A
N/A
20.4
N/A
12.4
N/A
1.4
4.7
2003
55
84
0.43
0.39
21.6
28.3
N/A
N/A
20.5
N/A
N/A
N/A
1.6
7.3
2002
59
91
0.49
0.47
22.2
32.0
0.003
N/A
20.9
N/A
N/A
N/A
1.7
8.4
2001
74
91
0.49
0.51
24.0
31.7
0.009
N/A
21.9
N/A
N/A
N/A
2.5
8.6
2000
85
78
0.52
0.59
25.1
29.7
0.017
N/A
21.5
N/A
N/A
N/A
3.0
8.0
Natural disasters
Type
Jacksonville
Akron
Tornado activity compared to U.S. average
75.2%
111.2%
Earthquake activity compared to U.S. average
18.1%
52.3%
Natural disasters compared to U.S. average
24%
11%
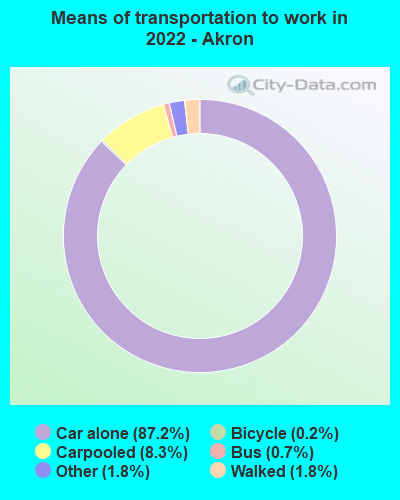
Transportation
Jacksonville boasts more extensive public transportation systems. Akron's public transit is limited but adequate. Both cities are car-centric, with most residents depending on personal vehicles for commuting.
Transport
Type
Jacksonville
Akron
Amtrak stations
1
1
Amtrak stations nearby
1
1
FAA registered aircraft
566
112
FAA registered aircraft manufacturers and dealers
34
10
Means of transportation to work
Type
Jacksonville
Akron
Bicycle
0.2%
0.2%
Bus
1.1%
1.4%
Carpooled
9%
7.7%
Car alone
86.5%
87.7%
Motorcycle
0.2%
0%
Railroad
0%
0.2%
Taxicab
0.2%
0.2%
Walked
1.2%
1.6%
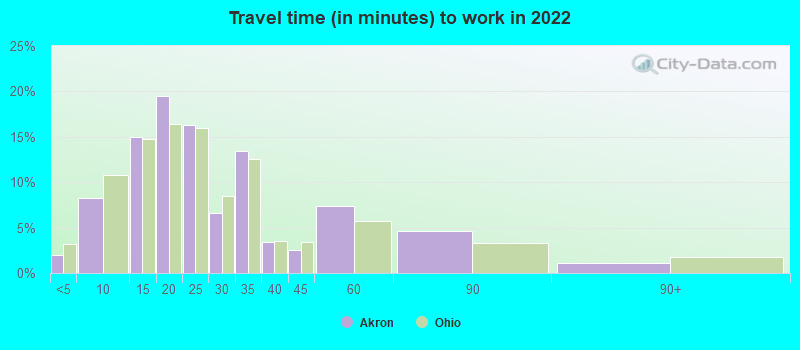
Average travel time to work
Type
Jacksonville
Akron
Average
27.5 min
24.6 min
Other means
25 min
22 min
Public transportation
43.7 min
38 min
Private vehicle occupancy
Type
Jacksonville
Akron
Average
1.1
1.2
Drove alone
89.4%
85.4%
In 2 person carpool
8%
12.4%
In 3 person carpool
1.7%
0.9%
In 4 person carpool
0.7%
0.5%
In 5-6 person carpool
0%
0.6%
In 7+ person carpool
0.2%
0.2%
How many people usually rode to work in the car, truck or van.
Real Estate
Jacksonville's real estate market is more expensive overall, with a mix of suburban and coastal properties. Akron offers more affordability in housing, with a range of options from urban apartments to suburban homes.
Neighborhoods
Jacksonville offers a variety of neighborhoods from beachfront communities to vibrant downtown areas. Akron has a mix of urban and suburban neighborhoods, each with unique cultural flavors and amenities.
Houses and residents
Type
Jacksonville
Akron
Houses
422,315
93,546
Average household size (people)
2.5
2.3
Median year apartment built
1985
1960
Median year house/condo built
1987
1952
Length of stay in the house since moving in
12.5 years
15.6 years
Houses occupied
386,283 (91.5%)
84,914 (90.8%)
Houses occupied by owners
226,429 (58.6%)
42,714 (50.3%)
Houses occupied by renters
159,854 (41.4%)
42,200 (49.7%)
Median rent asked for vacant for-rent units
$1,444
$905.97
Median monthly housing costs
$1,154
$784
Median price asked for vacant for-sale houses and condos
$260,045
$81,314
Estimated median house or condo value
$239,400
$106,300
Median numbers of rooms
5.6
5.5
Median number of rooms in apartments
4.3
4.7
Median number of rooms in houses and condos
6.3
6.3
Median house price - detached houses
$282,276
$136,437
Median house price - in 2-unit structures
$177,341
$102,885
Median house price - in 3-to-4-unit structures
$144,947
$135,558
Median house price - in 5 or more unit structures
$220,508
$94,537
Median house price - mobile homes
$87,589
$44,110
Median house price - Townhouses or other attached units
$213,709
$181,576
Median house price - All housing units
$266,926
$137,428
Median house age
36
68
Renting percentage
38.3%
45.5%
Housing density (houses/condos per square mile)
557.4
1,507.1
House value disparities
33.2%
36.4%
Household income disparities
44.2%
45%
Median household income for houses/condes with a mortgage
$83,160
$71,904
Median household income for apartments without a mortgage
$59,777
$49,938
Housing units without a mortgage
2,439 (1.6%)
1,292 (4.8%)
Housing units with both a second mortgage and home equity loan
8,460 (5.5%)
2,419 (9%)
Housing units with a mortgage
150,468 (98.4%)
25,670 (95.2%)
Housing units with a home equity loan
255 (0.2%)
0 (0%)
Housing units with a second mortgage
11,378 (7.4%)
2,878 (10.7%)
House/condo owner moved in on average (years ago)
10
15
House/condo renter moved in on average (years ago)
1
3
Housing units lacking complete kitchen facilities
1.5%
3.6%
Housing units lacking complete plumbing facilities
1.4%
2.2%
Housing units in structures
Housing units in structures
Jacksonville
Akron
One, detached
59.4%
67.7%
One, attached
6.1%
3.0%
Two
2.1%
6.8%
3 or 4
5.3%
4.5%
5 to 9
5.0%
4.9%
10 to 19
7.9%
3.9%
20 to 49
4.9%
2.9%
50 or more
5.3%
6.1%
Mobile homes
3.8%
0.2%
Boats, RVs, vans, etc.
0.2%
0.0%
Median real estate property taxes paid for housing units
Self-employed workers in own not incorporated business
19,601
3,686
State government workers
13,692
2,025
Unpaid family workers
1,066
196
Industries and Occupations
Jacksonville has a wide array of jobs in sectors like healthcare, finance, logistics, and the military. Akron offers opportunities in healthcare, education, and manufacturing, with a significant focus on polymer sciences due to its rich history in rubber manufacturing.
Jacksonville is home to renowned healthcare facilities like the Mayo Clinic and Baptist Health, while Akron hosts good healthcare facilities like the Akron Children's Hospital and Summa Health System.
Health (county statistics)
Type
Jacksonville
Akron
General health status score of residents in this county from 1 (poor) to 5 (excellent)
Jacksonville boasts of expansive infrastructure including an efficient international airport, seaport, and highway system. Akron also offers good infrastructure with easy access to highways and the Akron-Canton Airport.
Infrastructure
Type
Jacksonville
Akron
Hospitals
25
11
TV stations
17
22
Arenas or stadiums
2
2
Bank branches located here
191
69
Bank institutions located here
31
12
Main business address for public companies
23
6
Drinking water stations with no reported violations in the past
20
15
Drinking water stations with reported violations in the past
HMDA - Conventional home purchase loans - Applications denied
Year
Jacksonville
Akron
1999
5,422
674
2000
4,132
857
2001
3,038
599
2002
2,017
414
2003
3,563
644
2004
4,781
816
2005
7,134
1,353
2006
8,812
1,286
2007
5,298
734
2008
1,719
280
2009
676
85
Culture and Food
Jacksonville presents a more varied cultural and food scene. Its coastal location inspires seafood cuisine, while diverse populations introduce global flavors. Akron's food culture is also diverse, strongly influenced by its history as an industrial city with influences of Polish, Italian and Greek cuisines.
Sports Teams
Jacksonville is home to the NFL's Jaguars, while Akron, close to Cleveland, supports teams like the Cleveland Browns (NFL), Cleveland Cavaliers (NBA), and Cleveland Indians (MLB).


 Jacksonville, FL
 Akron, OH