Indianapolis, IN vs Worcester, MA - Advanced U.S. city comparison tool

Indianapolis, IN vs Worcester, MA

Indianapolis, Indiana, and Worcester, Massachusetts, are both vibrant American cities with their own unique character. Indianapolis, the capital of Indiana and the state's most populous city, offers a fast-paced lifestyle with strong industries, while Worcester, considered part of the Boston metropolitan area, offers a more colonial charm with old-world architecture and a rich history. Both cities have their pros and cons regarding crime and safety, weather, cost of living, and more. The following comparison can provide a better understanding of these two cities for those who are considering relocation or merely planning a visit.
 
 
Distance between Indianapolis, IN and Worcester, MA : 765.9 miles

Indianapolis's population is larger by 328%. Its population has grown by 100,169 people (12.8%) since 2000. The population of Worcester has grown by 33,270 people (19.3%) during that time.

Population
Type Indianapolis Worcester
Population 882,039 205,918
Female / male percentage 51.2% / 48.8%
51.2%
48.8%
51.8% / 48.2%
51.8%
48.2%
Racial makeup - percentage
Ethnicity IndianapolisWorcester
White Non-Hispanic 51.1% 47.9%
Black 27.9% 13.2%
Hispanic 11.2% 26.6%
Two or more 4.8% 5.1%
Asian 4.1% 5.7%
Racial makeup - absolute values
Ethnicity IndianapolisWorcester
White Non-Hispanic 451,187 98,580
Black 246,609 27,143
Hispanic 98,852 54,733
Two or more 42,035 10,485
Asian 36,008 11,724
American Indian 234 117
Pacific Islander 0 78

Crime and Safety

The crime rate in Indianapolis is higher than the national average, particularly, violent and property crimes. However, the police are responsive and community initiatives are in place to improve city's safety. In Worcester, the crime rate is lower than in Indianapolis, but still slightly above the national average. Both tourists and residents are typically advised to take standard precautions, such as avoiding certain neighborhoods after dark and keeping valuables out of sight.

Crime by year per 100,000 residents
Type City-data.com crime indexRobberies per 100,000Murders per 100,000Rapes per 100,000Assaults per 100,000Burglaries per 100,000Theft per 100,000Auto theft per 100,000Arson per 100,000
Year IndianapolisWorcesterIndianapolisWorcesterIndianapolisWorcesterIndianapolisWorcesterIndianapolisWorcesterIndianapolisWorcesterIndianapolisWorcesterIndianapolisWorcesterIndianapolisWorcester
2020 465.4 261.0 243.2 113.6 24.3 5.4 64.3 21.6 538.9 491.8 580.6 360.8 2,376.9 1,396.3 612.5 241.8 40.1 5.4
2019 503.7 267.1 300.2 123.8 16.4 7.0 78.0 23.8 637.9 476.9 746.6 406.1 2,476.2 1,425.8 494.9 200.1 34.6 3.2
2018 583.7 281.8 351.1 155.8 18.5 2.7 77.1 29.5 826.1 498.4 893.6 456.0 2,671.9 1,498.5 563.7 182.1 26.1 4.8
2017 614.9 296.8 400.2 175.0 17.9 2.7 76.7 29.2 839.1 527.3 1,027.2 467.8 2,821.5 1,505.1 563.2 213.9 29.4 3.8
2016 649.1 378.6 458.9 213.4 17.1 4.3 79.0 35.8 819.4 638.2 1,178.4 740.5 3,039.8 1,884.1 576.7 281.2 29.0 2.7
2015 632.7 364.8 440.2 221.9 17.1 4.4 78.4 18.0 752.3 646.8 1,283.5 662.0 2,929.5 2,053.1 577.9 215.9 22.3 1.6
2014 623.3 377.8 443.7 219.4 15.8 3.3 66.8 5.5 728.4 736.7 1,412.8 773.3 2,806.9 2,089.5 603.4 199.7 31.6 1.1
2013 645.6 409.8 446.9 263.3 15.2 4.9 77.2 12.5 693.2 673.7 1,581.4 1,044.4 3,076.4 2,143.3 588.7 217.5 37.3 3.8
2012 628.6 418.7 410.4 228.7 11.6 4.4 52.0 19.1 711.5 708.9 1,761.6 1,117.1 3,282.1 2,146.8 548.4 253.2 48.8 3.3
2011 617.9 425.8 404.8 226.2 11.5 6.6 52.2 22.0 632.3 739.5 1,815.3 1,134.3 3,191.7 1,915.0 631.1 291.5 55.6 5.5
2010 618.6 414.8 405.0 203.3 11.1 3.9 55.4 18.8 688.7 747.3 1,676.5 1,055.0 3,311.3 2,038.2 538.4 327.5 51.1 5.5
2009 655.4 433.9 483.0 232.0 12.2 3.9 56.5 19.1 648.0 754.7 1,870.6 832.1 3,407.3 2,537.6 551.3 382.1 42.5 6.7
2008 679.5 423.5 497.7 210.6 14.1 3.4 58.8 24.3 633.8 732.7 1,765.0 960.2 3,521.6 2,251.8 797.2 379.3 45.4 5.6
2007 702.6 413.9 507.5 211.6 14.3 3.4 63.3 53.5 649.2 604.0 1,678.9 743.9 3,665.5 2,172.6 963.3 513.6 42.1 10.2
2006 641.4 412.8 405.6 219.3 17.5 3.4 68.5 71.2 468.3 557.8 1,465.0 695.7 3,611.8 1,959.2 1,115.6 558.3 43.3 9.0
2005 541.0 377.7 409.1 224.5 13.5 3.4 65.9 83.8 504.7 490.7 1,443.0 711.2 3,691.2 2,097.1 1,123.6 659.9 46.7 6.8
2004 493.7 390.2 345.1 241.9 13.6 6.3 59.8 73.6 464.2 467.3 1,364.0 781.8 3,542.9 2,200.9 963.5 746.4 55.1 6.8
2003 479.5 409.4 353.4 234.7 13.1 4.0 52.5 33.7 464.2 608.7 1,257.5 886.3 3,485.6 2,651.4 928.9 829.7 62.4 21.1

City-data.com crime index counts serious crimes and violent crime more heavily. It adjusts for the number of visitors and daily workers commuting into cities. (higher means more crime, U.S. average = 301.1)


Crime per year
Type City-data.com crime indexRobberiesMurdersRapesAssaultsBurglariesTheftAuto theftArson
Year IndianapolisWorcesterIndianapolisWorcesterIndianapolisWorcesterIndianapolisWorcesterIndianapolisWorcesterIndianapolisWorcesterIndianapolisWorcesterIndianapolisWorcesterIndianapolisWorcester
2019 503.7 267.1 2,653 229 145 13 689 44 5,637 882 6,598 751 21,882 2,637 4,373 370 306 6
2018 583.7 281.8 3,081 290 162 5 677 55 7,250 928 7,842 849 23,448 2,790 4,947 339 229 9
2017 614.9 296.8 3,485 324 156 5 668 54 7,307 976 8,945 866 24,569 2,786 4,904 396 256 7
2016 649.1 378.6 3,976 394 148 8 684 66 7,099 1,178 10,209 1,367 26,335 3,478 4,996 519 251 5
2015 632.7 364.8 3,802 407 148 8 677 33 6,497 1,186 11,085 1,214 25,301 3,765 4,991 396 193 3
2014 623.3 377.8 3,808 402 136 6 573 10 6,251 1,350 12,125 1,417 24,090 3,829 5,179 366 271 2
2013 645.6 409.8 3,800 483 129 9 656 23 5,894 1,236 13,445 1,916 26,156 3,932 5,005 399 317 7
2012 628.6 418.7 3,442 419 97 8 436 35 5,967 1,299 14,774 2,047 27,525 3,934 4,599 464 409 6
2011 617.9 425.8 3,372 412 96 12 435 40 5,267 1,347 15,122 2,066 26,588 3,488 5,257 531 463 10
2010 618.6 414.8 3,367 368 92 7 461 34 5,726 1,353 13,938 1,910 27,530 3,690 4,476 593 425 10
2009 655.4 433.9 3,929 414 99 7 460 34 5,271 1,347 15,217 1,485 27,717 4,529 4,485 682 346 12
2008 679.5 423.5 4,023 373 114 6 475 43 5,123 1,298 14,267 1,701 28,466 3,989 6,444 672 367 10
2007 702.6 413.9 4,046 372 114 6 505 94 5,176 1,062 13,385 1,308 29,224 3,820 7,680 903 336 18
2006 641.4 412.8 3,249 388 140 6 549 126 3,751 987 11,734 1,231 28,929 3,467 8,936 988 347 16
2005 541.0 377.7 3,274 394 108 6 527 147 4,039 861 11,548 1,248 29,541 3,680 8,992 1,158 374 12
2004 493.7 390.2 2,763 424 109 11 479 129 3,716 819 10,920 1,370 28,364 3,857 7,714 1,308 441 12
2003 479.5 409.4 2,828 411 105 7 420 59 3,714 1,066 10,062 1,552 27,891 4,643 7,433 1,453 499 37

City-data.com crime index counts serious crimes and violent crime more heavily. It adjusts for the number of visitors and daily workers commuting into cities. (higher means more crime, U.S. average = 301.1)

Sex Offenders

According to our data, there are 2,171 registered sex offenders living in Indianapolis and 242 registered sex offenders living in .
The ratio of residents to sex offenders in Indianapolis is 393 to 1; the ratio in Worcester is 762 to 1.
The number of registered sex offenders compared to the number of residents is larger in Indianapolis than in Worcester.

Cost of Living

The cost of living in Indianapolis is lower than the national average, making it an affordable choice for relocation. Housing, groceries, and transportation costs are all generally low. Worcester, on the other hand, has a higher cost of living, particularly in terms of housing, largely due to its proximity to Boston.

Income Tax

Indianapolis residents pay a combined state and county income tax rate of around 3.23%. Massachusetts has a flat state income tax rate of 5%, which applies to all residents, including those in Worcester.

Property Tax

The average property tax rate in Indianapolis is slightly lower compared to Worcester. It's worth noting that Worcester residents face higher property taxes due to generally higher property valuations.

Sales Tax

The combined sales tax rate in Indianapolis is 7%, which applies to most goods and services. Worcester has a lower combined sales tax rate at 6.25%.
Income
Type Indianapolis Worcester
Estimated median household income $58,479 $63,194
Estimated per capita income $32,792 $32,772
Cost of living index (U.S. average is 100) 87.7 128.3

If you make $50,000 in Indianapolis, you will have to make $73,147 in Worcester to maintain the same standard of living.

Geographical Conditions

Indianapolis is located in the Great Plains region, characterized by flat to gently rolling terrain. It's known as the "Crossroads of America" due to its central location and extensive infrastructure. Worcester, known as the “Heart of the Commonwealth”, is characterized by its hilly terrain and is near both mountains and the sea.
Geographical information
Type Indianapolis Worcester
Land area 361.5 sq. miles 37.6 sq. miles
Population density 2,440.1 people per sq. mile 5,482.3 people per sq. mile
Elevation 717 feet 480 feet
First ancestry reported - percentage
Ancestry IndianapolisWorcester
German 8.9% 0.7%
English 4.8% 1.6%
Irish 4.3% 8.7%
Italian 1.1% 5.4%
Scottish 0.9% 0.3%
Polish 0.7% 3.1%
French 0.5% 2.3%
Dutch 0.4% 0.1%
Scotch-Irish 0.4% 0.2%
Greek 0.2% 0.9%
Norwegian 0.2% 0.1%
Swedish 0.2% 0.7%
Russian 0.2% 0.7%
Arab 0.1% 0.5%
French Canadian 0.1% 2.3%
Lithuanian 0.0% 0.5%
Portuguese 0.0% 0.9%
West Indian 0.0% 0.3%
Population origin - absolute values
Ancestry IndianapolisWorcester
German 41,186 825
English 22,059 1,757
Irish 19,931 9,817
Italian 4,960 6,055
Scottish 3,947 296
Polish 3,361 3,468
French 2,276 2,584
Scotch-Irish 2,031 220
Dutch 1,710 144
Swedish 953 788
Norwegian 927 122
Greek 886 1,040
Russian 851 771
Welsh 726 106
French Canadian 586 2,607
Swiss 547 11
Hungarian 416 29
Arab 395 560
Ukrainian 388 111
Czech 258 5
Foreign born residents - absolute values
Type Count
Region IndianapolisWorcester
All 91,704 45,296
Africa 17,067 10,013
Asia 26,426 12,590
Europe 4,722 7,471
Latin America 39,630 14,434
North America 441 305
Oceania 258 94
Foreign born residents - percentage
Type Percentage
Region IndianapolisWorcester
All 10.4% 22.1%
Africa 1.9% 4.9%
Asia 3.0% 6.1%
Europe 0.5% 3.6%
Latin America 4.5% 7.0%
North America 0.1% 0.1%

Education

Indianapolis is home to several high-ranking schools and colleges, including Indiana University-Purdue University Indianapolis. Worcester is also rich in educational opportunities, boasting over a dozen colleges and universities including the highly-ranked Worcester Polytechnic Institute.
School enrollment
Type Indianapolis Worcester
Nursery, preschool 11,998 (5.5%) 1,420 (2.3%)
Kindergarten 11,472 (5.3%) 2,237 (3.6%)
Grade 1 to 4 45,817 (21.1%) 7,863 (12.6%)
Grade 5 to 8 50,108 (23.1%) 10,571 (17%)
Grade 9 to 12 46,328 (21.4%) 9,037 (14.5%)
College undergrad 36,567 (16.9%) 23,527 (37.8%)
Graduate or professional 14,587 (6.7%) 7,614 (12.2%)
Students in private schools - absolute values
Type Count
Grade IndianapolisWorcester
Grades 1 to 8 (elementary and middle school) 21,080 1,264
Grades 9 to 12 (high school) 9,278 1,075
Undergraduate colleges 8,480 14,549
Students in private schools - percentage
Type Percentage
Grade IndianapolisWorcester
Grades 1 to 8 (elementary and middle school) 22.0% 6.9%
Grades 9 to 12 (high school) 20.0% 11.9%
Undergraduate colleges 23.2% 61.8%
Educational attainment
Type Indianapolis Worcester
Less than high school 11.7% 16.3%
High school or equiv. 27.4% 25.1%
Less than 1 year of college 7.3% 5.8%
1 or more years of college 11.4% 10.1%
Associate degree 7.5% 8.2%
Bachelor's degree 22% 20.9%
Master's degree 8.7% 9.3%
Profess. school degree 2.5% 1.9%
Doctorate degree 1.5% 2.4%
Education level (25-year-olds and older)
Type Indianapolis Worcester
Bachelor's degree or higher 34.7% 34.4%
Graduate or professional degree 12.7% 13.5%
High school or higher 88.3% 83.7%

Work and Economy

Indianapolis has a diverse economy with strengths in manufacturing, healthcare, and retail. The job growth rate in Indianapolis is slightly higher than the national average. Worcester, located within the Boston metropolitan area, serves as an economic hub with a strong healthcare sector and emerging tech industry.

Biggest Employers

In Indianapolis, the top employers include Indiana University Health, the federal and state government, and retail giants like Walmart. In Worcester, the biggest employers include UMass Memorial Health Care, University of Massachusetts Medical School, and Saint Vincent Hospital.
Employment and residency - absolute values
Kind IndianapolisWorcester
Work and live in this city 315,658 42,835
Work and live in this county 341,614 81,300
Workers who work outside the city they live in 466,212 129,813
Workers who work outside the county they live in 88,012 14,955
Working at home 70,856 11,919
Not working at home 358,770 84,336
Daytime population change due to commuting 121,962 20,929
Employment and residency - percentage
Kind IndianapolisWorcester
Work and live in this city 81.9% 56.7%
Work and live in this county 79.5% 84.5%
Workers who work outside the city they live in 18.1% 43.3%
Workers who work outside the county they live in 20.5% 15.5%
Working at home 16.5% 12.4%
Not working at home 83.5% 87.6%
Daytime population change due to commuting 15.6% 12.1%
Geographical mobility: all
Type all
Mobility IndianapolisWorcester
Same house 1 year ago 86.0% 83.3%
Moved from abroad 0.7% 1.4%
Moved within same county 8.4% 8.1%
Moved from different state 1.7% 3.7%
Moved within same state 3.2% 3.5%
Geographical mobility: Asian
Type Asian
Mobility IndianapolisWorcester
Same house 1 year ago 88.1% 71.8%
Moved from abroad 0.7% 12.2%
Moved within same county 7.6% 12.0%
Moved from different state 3.0% 3.6%
Moved within same state 0.6% 0.5%
Geographical mobility: Black
Type Black
Mobility IndianapolisWorcester
Same house 1 year ago 88.3% 84.9%
Moved from abroad 1.3% 2.2%
Moved within same county 8.0% 5.8%
Moved from different state 1.3% 2.0%
Moved within same state 1.2% 5.2%
Geographical mobility: White
Type White
Mobility IndianapolisWorcester
Same house 1 year ago 85.7% 82.3%
Moved from abroad 0.2% 0.2%
Moved within same county 7.9% 6.9%
Moved from different state 1.7% 6.3%
Moved within same state 4.4% 4.3%
Building permits
Type Average valueCount
City IndianapolisWorcesterIndianapolisWorcester
1997 $121,100 $70,600 3,063 156
1998 $122,400 $63,900 3,820 209
1999 $127,400 $72,400 3,962 227
2000 $136,500 $85,200 3,534 279
2001 $140,200 $86,800 4,765 268
2002 $144,100 $92,200 3,532 410
2003 $152,000 $103,300 3,375 420
2004 $155,300 $94,600 2,737 438
2005 $158,600 $118,300 2,760 366
2006 $162,800 $118,000 1,947 292
2007 $165,600 $148,500 1,317 214
2008 $155,400 $108,900 734 61
2009 $141,400 $96,200 587 110
2010 $143,800 $100,900 619 99
2011 $166,300 $124,300 517 64
2012 $205,300 $117,500 472 44
2013 $212,000 $135,100 562 53
2014 $226,200 $118,100 572 88
2015 $243,600 $133,300 743 43
2016 $251,500 $158,200 831 84
2017 $257,800 $149,800 914 88
2018 $258,600 $148,000 1,090 101
2019 $265,900 $161,200 1,153 60
2020 $276,900 $161,200 1,108 62
2021 $283,900 $202,100 1,221 66

There were 1,221 building permits issued in Indianapolis in 2012 (704 more than in 2011) compared to 66 building permits issued in Worcester in 2012 (2 more than in 2011).

In Indianapolis (Marion County), 60.1% voted for Democrats and 37.9% for Republicans in 2012 Presidential Election. In Worcester (Worcester County), 53.7% voted for Democrats and 44.3% for Republicans.

Elections
Type DemocratsRepublicansOther
Year IndianapolisWorcesterIndianapolisWorcesterIndianapolisWorcester
2020 63.7% 57.6% 34.5% 39.7% 1.9% 2.7%
2016 58.2% 51.0% 35.6% 40.5% 6.2% 8.5%
2012 60.1% 53.7% 37.9% 44.3% 2.0% 2.0%
2008 63.8% 55.8% 35.4% 42.0% 0.8% 2.2%
2004 50.6% 56.6% 48.7% 42.5% 0.7% 0.9%
2000 48.0% 56.2% 49.3% 36.9% 2.8% 6.9%
1996 44.6% 58.3% 47.8% 29.8% 7.7% 11.9%
Breakdown of population affiliated with a religious congregation
Type AdherentsCongregations
Religion IndianapolisWorcesterIndianapolisWorcester
CATHOLIC CHURCH 11.1% 38.4% 4.6% 20.1%
SOUTHERN BAPTIST CONVENTION 1.6% 0.2% 5.7% 3.3%
AMERICAN BAPTIST CHURCHES IN THE USA 1.2% 0.7% 3.4% 4.6%
LUTHERAN CHURCH 0.8% 0.1% 1.5% 0.5%
EVANGELICAL LUTHERAN CHURCH IN AMERICA 0.5% 0.8% 1.6% 2.2%
SEVENTH DAY ADVENTIST CHURCH 0.5% 0.8% 1.6% 4.6%
EPISCOPAL CHURCH 0.4% 1.2% 1.1% 4.8%

Weather

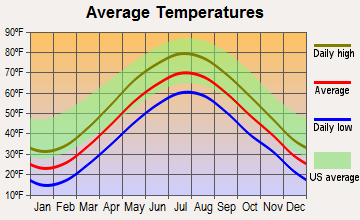
Indianapolis experiences all four seasons, with hot and humid summers and moderately cold winters. Snowfall is common in winter, but severe storms are quite rare. Worcester has similar seasonal changes, but winters can be harsher with more snowfall due to its New England location. Its summers are often cooler than those in Indianapolis.
Weather and climate
Type Indianapolis Worcester
Temperature - Average 52.1°F 47.1°F
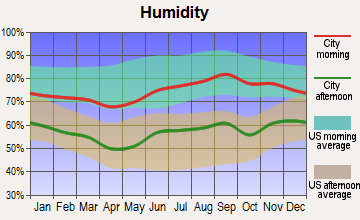
Humidity - Average morning or afternoon humidity 77% 71.5%
Humidity - Differences between morning and afternoon humidity 31% 32%
Humidity - Maximum monthly morning or afternoon humidity 86% 81%
Humidity - Minimum monthly morning or afternoon humidity 55% 49.1%
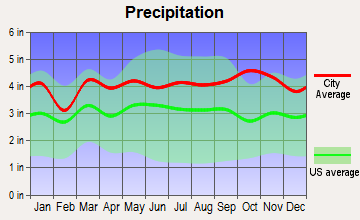
Precipitation - Yearly average 40.6 in 48.9 in
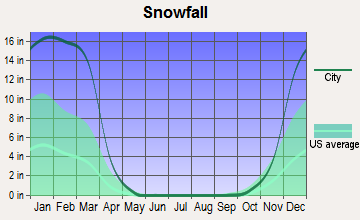
Snowfall - Yearly average 51 in 133.4 in
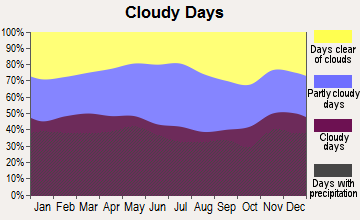
Clouds - Number of days clear of clouds 14.7% 15.2%
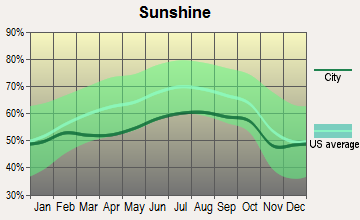
Sunshine amount - Average 56.2% 63%
Sunshine amount - Differences during a year 33% 18.5%
Sunshine amount - Maximum monthly 65% 66.3%
Sunshine amount - Minimum monthly 32% 47.8%
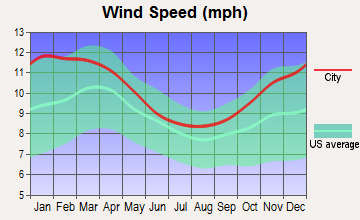
Wind speed - Average 10.3 mph 11 mph

Average climate in Indianapolis, Indiana

Chicago, Illinois average temperatures Chicago, Illinois average precipitation Chicago, Illinois humidity Chicago, Illinois wind speed Chicago, Illinois snowfall Chicago, Illinois sunshine Chicago, Illinois clear and cloudy days
 

Average climate in Worcester, Massachusetts

Chicago, Illinois average temperatures Chicago, Illinois average precipitation Chicago, Illinois humidity Chicago, Illinois wind speed Chicago, Illinois snowfall Chicago, Illinois sunshine Chicago, Illinois clear and cloudy days
 

Air pollution
Type AQICONO2OZONEPBPM10PM25SO2
Year IndianapolisWorcesterIndianapolisWorcesterIndianapolisWorcesterIndianapolisWorcesterIndianapolis Indianapolis IndianapolisWorcesterIndianapolisWorcester
2018 94 71 0.58 0.28 13.2 11.2 23.1 31.5 N/A N/A 18.2 N/A 10.4 6.8 0.3 0.6
2017 87 69 0.82 0.28 12.4 11.5 23.0 32.3 N/A N/A 17.6 N/A 10.1 5.5 0.4 0.8
2016 91 73 0.62 0.25 13.0 12.2 22.5 33.6 N/A N/A 18.0 N/A 9.9 6.2 0.4 0.7
2015 89 68 0.73 0.26 14.9 13.4 22.9 32.6 N/A N/A 19.7 N/A 9.9 7.0 1.1 0.5
2014 100 71 0.62 0.32 16.1 13.1 25.1 33.2 N/A N/A 20.6 N/A 12.1 7.7 3.2 1.5
2013 94 82 0.69 0.39 11.5 11.8 26.3 34.5 N/A N/A 19.9 N/A 12.8 8.3 2.6 2.7
2012 103 84 0.65 0.51 10.4 12.8 25.7 37.5 N/A N/A 20.8 N/A 12.9 7.7 2.9 3.2
2011 105 82 0.68 0.46 11.3 17.4 22.9 34.8 N/A N/A N/A N/A 16.3 9.8 2.4 2.7
2010 101 88 0.54 0.50 12.7 13.9 21.6 37.4 N/A N/A N/A N/A 15.9 9.9 3.3 2.1
2009 97 85 0.73 0.53 11.4 14.4 23.2 N/A N/A N/A N/A N/A 13.8 8.3 1.9 1.1
2008 91 94 0.62 0.54 11.5 14.9 N/A 38.5 0.010 N/A N/A N/A 13.2 8.0 3.0 2.6
2007 103 115 0.69 0.52 13.1 15.7 N/A N/A 0.011 N/A N/A N/A 14.9 9.0 3.6 3.4
2006 95 98 0.59 0.53 14.5 15.2 N/A 38.7 0.009 N/A N/A N/A 14.5 8.8 3.6 2.8
2005 121 101 0.65 0.55 15.2 14.9 N/A N/A 0.014 N/A N/A N/A 18.0 10.0 4.3 4.6
2004 104 92 0.62 0.41 15.8 15.8 N/A N/A 0.010 N/A N/A N/A 15.1 11.6 4.6 2.6
2003 113 82 0.67 0.51 16.6 15.6 N/A N/A 0.010 N/A N/A N/A 15.8 N/A 4.2 N/A
2002 125 87 0.76 0.52 17.4 17.4 N/A 39.0 0.009 N/A N/A N/A 16.8 N/A 3.9 N/A
2001 105 98 0.81 0.57 16.6 20.0 N/A 32.6 0.031 N/A N/A N/A 16.3 N/A 3.8 N/A
2000 98 76 0.87 0.52 17.3 18.6 N/A 31.2 N/A N/A N/A N/A N/A N/A 4.5 N/A
Natural disasters
Type Indianapolis Worcester
Tornado activity compared to U.S. average 226.7% 79.8%
Earthquake activity compared to U.S. average 179.6% 28.4%
Natural disasters compared to U.S. average 16% 27%

Transportation

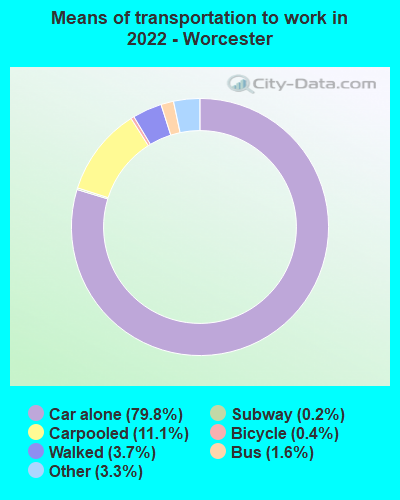
Transportation in Indianapolis revolves around car travel, with a low use of public transportation. On the other hand, Worcester has a more extensive public transit system, including a commuter rail to Boston, and a higher percentage of the population using the transit system.
Transport
Type Indianapolis Worcester
Amtrak stations 1 0
Amtrak stations nearby 1 2
FAA registered aircraft 739 21
FAA registered aircraft manufacturers and dealers 18 9
Means of transportation to work
Type Indianapolis Worcester
Bicycle 0.5% 0.4%
Bus 1.2% 1.3%
Carpooled 8.5% 9.8%
Car alone 87.3% 81.3%
Railroad 0% 0.4%
Taxicab 0.1% 0.4%
Walked 1.6% 4.6%
Means of transportation to work
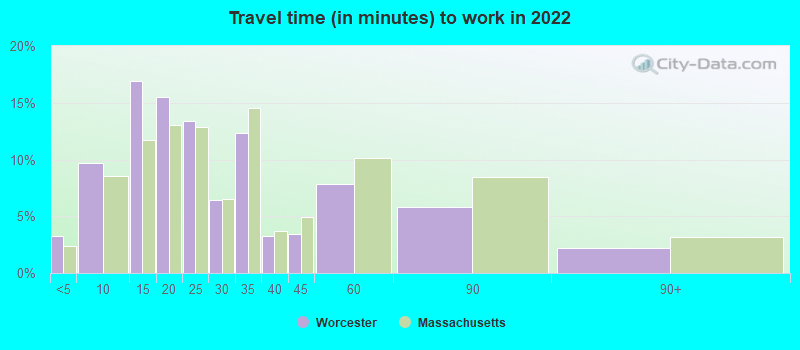
Average travel time to work
Type Indianapolis Worcester
Average 28.1 min 26.5 min
Other means 22.5 min 23.3 min
Public transportation 40.2 min 34 min
Travel time to work
Time leaving to work
Travel time to work
Time leaving to work
Private vehicle occupancy
Type Indianapolis Worcester
Average 1.2 1.2
Drove alone 88.2% 85.3%
In 2 person carpool 9.4% 11.9%
In 3 person carpool 1.3% 1.6%
In 4 person carpool 0.5% 0.6%
In 5-6 person carpool 0.4% 0.3%
In 7+ person carpool 0.1% 0.2%

How many people usually rode to work in the car, truck or van.

Real Estate

Real estate in Indianapolis is reasonably priced, with a median home cost that is significantly lower than the national average. In Worcester, real estate prices are higher, driven by its proximity to Boston and the presence of several colleges and universities.

Neighborhoods

Indianapolis has neighborhoods reflecting both urban and suburban environments. Downtown Indianapolis is known for its vibrant nightlife, while the northern suburbs offer peaceful family-friendly spaces. Worcester is known for its unique, historical neighborhoods, such as Shrewsbury Street and Canal District, brimming with cultural attractions and unique dining experiences.
Houses and residents
Type Indianapolis Worcester
Houses 399,820 82,375
Average household size (people) 2.4 2.5
Median year apartment built 1977 1960
Median year house/condo built 1971 1952
Length of stay in the house since moving in 13 years 15.8 years
Houses occupied 358,150 (89.6%) 76,065 (92.3%)
Houses occupied by owners 201,149 (56.2%) 32,714 (43%)
Houses occupied by renters 157,001 (43.8%) 43,351 (57%)
Median rent asked for vacant for-rent units $876.58 $1,034
Median monthly housing costs $980 $1,314
Median price asked for vacant for-sale houses and condos $283,027 $425,443
Estimated median house or condo value $188,700 $317,800
Median numbers of rooms 5.5 5.1
Median number of rooms in apartments 4.3 4.3
Median number of rooms in houses and condos 6.5 6.1
Median house price - detached houses $231,490 $338,239
Median house price - in 2-unit structures $257,253 $252,487
Median house price - in 3-to-4-unit structures $240,688 $352,758
Median house price - in 5 or more unit structures $247,275 $213,457
Median house price - Townhouses or other attached units $222,424 $290,622
Median house price - All housing units $229,666 $317,463
Median house age 48 67
Renting percentage 44.2% 55.5%
Housing density (houses/condos per square mile) 1,106.1 2,193.1
House value disparities 36.1% 25.3%
Household income disparities 44.4% 46.9%
Median household income for houses/condes with a mortgage $86,008 $102,992
Median household income for apartments without a mortgage $61,922 $78,632
Housing units without a mortgage 4,552 (3.2%) 687 (3%)
Housing units with both a second mortgage and home equity loan 9,787 (6.8%) 2,013 (8.8%)
Housing units with a mortgage 138,622 (96.8%) 22,130 (97%)
Housing units with a home equity loan 271 (0.2%) 289 (1.3%)
Housing units with a second mortgage 12,987 (9.1%) 2,828 (12.4%)
House/condo owner moved in on average (years ago) 11 15
House/condo renter moved in on average (years ago) 1 3
Housing units lacking complete kitchen facilities 3.4% 1.6%
Housing units lacking complete plumbing facilities 1.1% 1.1%
Housing units in structures
Housing units in structures IndianapolisWorcester
One, detached 59.0% 32.1%
One, attached 9.2% 6.4%
Two 2.5% 7.9%
3 or 4 6.2% 25.1%
5 to 9 7.7% 8.6%
10 to 19 6.3% 5.4%
20 to 49 3.1% 4.4%
50 or more 5.0% 10.0%
Mobile homes 1.0% 0.1%
Median real estate property taxes paid for housing units
Type Indianapolis Worcester
With mortgages $1,803 (0.9%) $4,316 (1.3%)
With no mortgages $1,619 (1%) $4,349 (1.4%)
Marital status
Type Indianapolis Worcester
Divorced 13.2% 9.1%
Never married 39% 47%
Now married 41.9% 38.2%
Separated 1.5% 1.8%
Widowed 4.4% 3.9%
Class of workers - percentage
Class of Workers IndianapolisWorcester
Employee of private company 69.2% 64.0%
Private not-for-profit wage and salary workers 11.1% 14.9%
Local government workers 5.7% 6.9%
Self-employed workers in own not incorporated business 3.9% 5.1%
State government workers 3.5% 5.7%
Self-employed in own incorporated business 3.2% 1.8%
Federal government workers 3.0% 1.6%
Unpaid family workers 0.4% 0.0%
Class of workers - absolute values
Class of Workers IndianapolisWorcester
Employee of private company 302,893 63,754
Federal government workers 13,085 1,568
Local government workers 24,951 6,913
Private not-for-profit wage and salary workers 48,421 14,830
Self-employed in own incorporated business 13,885 1,793
Self-employed workers in own not incorporated business 17,131 5,036
State government workers 15,502 5,706
Unpaid family workers 1,601 42

Industries and Occupations

Indianapolis is known for its auto racing industry, healthcare sector, and vibrant tech scene. The city is also a major hub for logistics and distribution. In Worcester, the healthcare industry leads, followed by education due to the presence of multiple colleges and universities. Technology and manufacturing also contribute to Worcester's economy.
Most common male industries
Industry IndianapolisWorcester
Manufacturing 13.3% 12.6%
Retail trade 13.2% 15.0%
Transportation and warehousing 11.8% 6.1%
Construction 9.8% 10.4%
Professional, scientific, and technical services 8.9% 10.4%
Accommodation and food services 6.0% 4.1%
Health care and social assistance 5.1% 12.1%
Administrative and support and waste management services 4.7% 3.8%
Educational services 4.7% 8.9%
Finance and insurance 4.6% 3.5%
Public administration 4.2% 2.9%
Wholesale trade 3.9% 1.9%
Other services, except public administration 3.5% 3.2%
Arts, entertainment, and recreation 1.9% 1.4%
Real estate and rental and leasing 1.3% 1.0%
Utilities 1.3% 0.5%
Information 1.2% 1.9%
Agriculture, forestry, fishing and hunting 0.6% 0.1%
Management of companies and enterprises 0.1% 0.3%
Mining, quarrying, and oil and gas extraction 0.1% 0.0%
Most common female industries
Industry IndianapolisWorcester
Health care and social assistance 22.1% 32.3%
Retail trade 11.7% 8.2%
Educational services 11.5% 14.1%
Manufacturing 8.4% 5.1%
Professional, scientific, and technical services 7.0% 5.5%
Finance and insurance 6.5% 5.1%
Accommodation and food services 6.3% 8.9%
Transportation and warehousing 5.2% 3.3%
Public administration 5.1% 3.3%
Other services, except public administration 4.2% 5.3%
Administrative and support and waste management services 3.8% 2.6%
Arts, entertainment, and recreation 2.0% 0.6%
Real estate and rental and leasing 1.8% 0.6%
Wholesale trade 1.5% 1.4%
Information 1.1% 1.7%
Construction 1.1% 0.8%
Agriculture, forestry, fishing and hunting 0.4% 0.0%
Management of companies and enterprises 0.4% 0.4%
Utilities 0.1% 0.8%
Most common male occupations
Occupation IndianapolisWorcester
Management occupations 10.7% 9.1%
Material moving occupations 9.8% 9.1%
Office and administrative support occupations 8.7% 6.0%
Sales and related occupations 8.0% 7.4%
Construction and extraction occupations 8.0% 8.8%
Production occupations 7.3% 6.6%
Transportation occupations 6.2% 4.9%
Business and financial operations occupations 6.0% 6.4%
Installation, maintenance, and repair occupations 5.3% 3.1%
Food preparation and serving related occupations 4.7% 3.9%
Computer and mathematical occupations 3.9% 4.0%
Educational instruction, and library occupations 2.8% 5.3%
Health diagnosing and treating practitioners and other technical occupations 2.7% 1.6%
Building and grounds cleaning and maintenance occupations 2.6% 5.2%
Architecture and engineering occupations 2.6% 2.4%
Arts, design, entertainment, sports, and media occupations 2.3% 2.2%
Law enforcement workers including supervisors 1.4% 1.5%
Legal occupations 1.3% 2.1%
Life, physical, and social science occupations 1.2% 2.9%
Firefighting and prevention, and other protective service workers including supervisors 1.2% 0.8%
Most common female occupations
Occupation IndianapolisWorcester
Office and administrative support occupations 18.7% 14.3%
Management occupations 9.2% 7.5%
Business and financial operations occupations 7.8% 4.5%
Sales and related occupations 7.7% 6.5%
Educational instruction, and library occupations 7.6% 9.1%
Health diagnosing and treating practitioners and other technical occupations 6.3% 7.9%
Healthcare support occupations 6.0% 9.2%
Food preparation and serving related occupations 5.1% 7.7%
Material moving occupations 4.9% 2.1%
Production occupations 4.3% 3.4%
Personal care and service occupations 3.7% 5.4%
Health technologists and technicians 3.3% 5.1%
Community and social service occupations 2.9% 2.9%
Building and grounds cleaning and maintenance occupations 2.2% 3.0%
Computer and mathematical occupations 1.9% 1.6%
Arts, design, entertainment, sports, and media occupations 1.8% 1.1%
Transportation occupations 1.5% 2.0%
Legal occupations 1.4% 0.7%
Life, physical, and social science occupations 1.3% 2.5%
Architecture and engineering occupations 0.8% 1.8%
Food environment data per 10,000 residents
Food environment statistics IndianapolisWorcester
Number of convenience stores (no gas) 3.0 2.2
Number of convenience stores (with gas) 0.4 1.8
Number of full-service restaurants 7.2 7.3
Number of grocery stores 1.7 1.7
Number of supercenters and club stores 0.2 0.1
Food environment - absolute values
Food environment statistics IndianapolisWorcester
Number of convenience stores (no gas) 264 174
Number of convenience stores (with gas) 31 140
Number of full-service restaurants 634 569
Number of grocery stores 150 135
Number of supercenters and club stores 20 4
Obesity and diabetes
Food environment statistics rate IndianapolisWorcester
Adult diabetes rate 9.0% 8.0%
Adult obesity rate 28.5% 24.0%
Low-income preschool obesity rate 15.0% 16.6%

Health Care

Indianapolis offers top-rated health care facilities including Indiana University Health, a nationally ranked institution. Worcester's healthcare system is anchored by premier institutions such as UMass Memorial Medical Center, and Saint Vincent Hospital.
Health (county statistics)
Type Indianapolis Worcester
General health status score of residents in this county from 1 (poor) to 5 (excellent) 3.4 3.6
Average weight of females (lbs) 165.5 lbs 159.4 lbs
Average weight of males (lbs) 200.3 lbs 196.8 lbs
Residents visited a dentist within the past year 68.8% 74.9%
Residents exercised in the past month 69.9% 72.8%
Adult residents drank alcohol in the past 30 days 49.9% 59.5%
Residents smoked 100+ cigarettes in their lives 43% 45.7%

Fatal vehicle accidents per 100,000 residents
Type Total count per 100,000Drunk per 100,000Fatal count per 100,000Pedestrian count per 100,000Person count per 100,000Vehicle count per 100,000
Year IndianapolisWorcesterIndianapolisWorcesterIndianapolisWorcesterIndianapolisWorcesterIndianapolisWorcesterIndianapolisWorcester
2021 15.9 3.9 0.0 0.0 16.8 3.9 4.5 0.5 35.9 7.8 27.1 6.3
2020 14.2 2.9 3.7 0.5 15.3 2.9 5.5 1.9 32.2 4.8 22.8 4.8
2019 11.2 4.3 2.9 1.1 11.6 4.3 3.0 2.7 25.2 7.6 19.4 6.5
2018 11.1 7.0 2.5 2.7 11.9 7.5 3.8 1.6 23.6 12.4 18.0 10.2
2017 10.6 4.3 1.9 1.6 11.1 4.3 3.9 2.7 23.3 5.4 15.7 5.9
2016 10.9 4.9 2.9 1.6 11.6 4.9 3.4 1.6 24.3 11.9 17.5 8.7
2015 10.1 6.0 1.4 2.2 11.1 6.5 3.9 4.3 23.5 8.7 15.8 9.2
2014 9.2 4.4 0.7 0.0 9.8 4.4 2.7 2.2 20.3 7.7 15.1 5.5
2013 8.2 4.9 1.7 0.5 9.1 4.9 2.7 2.7 20.9 8.8 12.1 8.2
2012 9.0 3.8 2.9 0.5 9.2 3.8 2.4 2.7 24.4 6.0 14.1 4.9
2011 9.4 6.1 1.8 2.8 10.2 6.6 3.5 3.3 21.0 12.7 14.6 8.8
2010 8.3 5.0 3.4 2.2 8.5 6.1 2.6 0.6 20.4 9.4 13.4 7.7
2009 6.8 1.6 2.1 1.1 6.8 1.6 1.9 0.5 15.5 3.8 11.1 3.3
2008 9.9 3.8 4.6 2.2 10.9 3.8 2.0 0.5 25.1 11.0 15.6 7.1
2007 8.8 4.0 1.6 2.3 9.7 4.0 1.9 0.6 21.8 10.3 14.9 7.4
2006 9.7 6.3 2.8 1.1 10.5 8.0 2.1 2.3 21.8 21.6 15.6 10.2
2005 9.2 4.6 3.8 2.9 9.8 5.1 2.3 1.1 26.6 9.7 16.6 8.6
2004 8.6 9.7 2.8 2.9 8.9 9.7 1.9 4.0 23.9 25.2 13.8 14.9
2003 6.0 8.7 1.1 2.9 6.2 9.2 2.0 2.3 18.1 22.5 9.4 13.3
2002 4.6 8.7 1.7 2.9 4.8 8.7 0.9 3.5 10.8 26.1 7.0 11.6
2001 6.6 8.1 2.2 4.1 7.1 9.3 2.0 2.9 16.9 18.6 9.5 10.4
2000 5.0 8.7 1.4 2.3 5.0 8.7 1.3 4.6 13.4 20.3 8.1 12.7
1999 6.5 4.8 2.0 1.8 7.0 4.8 2.0 1.2 16.8 16.2 10.3 12.0
1998 7.2 6.6 2.3 1.8 7.8 6.6 1.5 3.6 18.8 19.2 10.7 12.0
1997 6.6 5.4 2.7 0.6 7.1 5.4 1.6 5.4 16.9 12.6 10.6 7.2
1996 7.1 5.4 1.7 2.4 7.8 5.4 2.7 1.8 22.7 10.8 12.3 6.6
1995 6.3 3.0 1.3 1.2 6.8 3.0 2.4 1.2 22.9 6.6 9.2 4.2
1994 5.6 3.0 1.9 1.2 6.2 3.0 2.1 1.2 15.1 7.8 9.2 4.2
1993 6.8 6.0 2.5 1.8 7.0 6.6 1.9 2.4 19.5 13.1 10.9 7.8
1992 5.8 3.6 1.9 0.0 6.3 3.6 1.7 6.0 18.2 11.4 9.7 4.8
1991 5.4 6.5 3.0 0.6 6.1 6.5 1.4 3.6 15.6 19.0 8.4 8.9
1990 7.4 11.8 3.5 1.8 8.6 11.8 0.0 0.0 22.4 26.5 11.7 14.7
1989 6.3 5.9 3.0 2.4 6.8 7.1 0.0 0.0 20.9 18.3 11.9 9.5
1988 6.1 4.8 3.5 0.0 7.6 5.4 0.0 0.0 16.0 9.5 10.2 4.8
1987 7.8 10.2 3.8 3.6 7.9 10.2 0.0 0.0 19.1 20.3 11.7 12.0
1986 7.5 9.0 4.2 4.8 8.0 10.2 0.0 0.0 20.6 19.2 12.0 12.6
1985 10.1 7.2 3.7 0.6 11.0 9.0 0.0 0.0 27.8 19.3 16.0 9.7
1984 11.9 7.9 3.3 1.8 12.8 7.9 0.0 0.0 30.7 23.6 17.2 13.3
1983 6.5 8.5 1.6 1.8 7.0 9.7 0.0 0.0 18.1 20.1 10.1 11.0
1982 7.6 9.2 2.9 3.1 8.2 9.2 0.0 0.0 18.7 24.5 11.9 11.6
1981 12.7 8.6 4.6 4.3 14.2 9.2 0.0 0.0 28.2 19.7 17.2 11.1
1980 13.0 8.0 3.7 4.3 14.6 8.7 0.0 0.0 31.1 19.8 18.7 11.7
1979 15.1 8.0 2.7 2.5 16.8 8.6 0.0 0.0 34.1 19.6 19.5 11.0
1978 13.1 12.1 4.4 5.5 14.7 12.7 0.0 0.0 34.4 27.9 20.9 15.8
1977 12.1 10.2 2.7 2.4 14.0 10.8 0.0 0.0 30.8 23.5 16.2 11.4
1976 10.6 12.5 0.3 3.6 11.9 13.1 0.0 0.0 29.7 23.9 15.5 13.7
1975 10.6 12.4 0.3 3.5 11.9 13.0 0.0 0.0 29.7 23.6 15.5 13.6

Fatal vehicle accidents
Type Total countDrunkFatal countPedestrian countPerson countVehicle count
Year IndianapolisWorcesterIndianapolisWorcesterIndianapolisWorcesterIndianapolisWorcesterIndianapolisWorcesterIndianapolisWorcester
1975 78 21 2 6 87 22 0 0 218 40 114 23
1976 78 21 2 6 87 22 0 0 218 40 114 23
1977 89 17 20 4 103 18 0 0 226 39 119 19
1978 96 20 32 9 108 21 0 0 252 46 153 26
1979 111 13 20 4 123 14 0 0 250 32 143 18
1980 95 13 27 7 107 14 0 0 228 32 137 19
1981 93 14 34 7 104 15 0 0 207 32 126 18
1982 56 15 21 5 60 15 0 0 137 40 87 19
1983 48 14 12 3 51 16 0 0 133 33 74 18
1984 87 13 24 3 94 13 0 0 225 39 126 22
1985 74 12 27 1 81 15 0 0 204 32 117 16
1986 55 15 31 8 59 17 0 0 151 32 88 21
1987 57 17 28 6 58 17 0 0 140 34 86 20
1988 45 8 26 0 56 9 0 0 117 16 75 8
1989 46 10 22 4 50 12 0 0 153 31 87 16
1990 54 20 26 3 63 20 0 0 164 45 86 25
1991 40 11 22 1 45 11 10 6 115 32 62 15
1992 43 6 14 0 47 6 13 10 135 19 72 8
1993 51 10 19 3 52 11 14 4 145 22 81 13
1994 42 5 14 2 46 5 16 2 113 13 69 7
1995 47 5 10 2 51 5 18 2 171 11 69 7
1996 53 9 13 4 58 9 20 3 169 18 92 11
1997 49 9 20 1 53 9 12 9 126 21 79 12
1998 53 11 17 3 58 11 11 6 139 32 79 20
1999 48 8 15 3 52 8 15 2 124 27 76 20
2000 39 15 11 4 39 15 10 8 105 35 63 22
2001 52 14 17 7 56 16 16 5 133 32 75 18
2002 36 15 13 5 38 15 7 6 85 45 55 20
2003 47 15 9 5 49 16 16 4 142 39 74 23
2004 68 17 22 5 70 17 15 7 188 44 109 26
2005 73 8 30 5 77 9 18 2 210 17 131 15
2006 77 11 22 2 83 14 17 4 173 38 124 18
2007 70 7 13 4 77 7 15 1 174 18 119 13
2008 79 7 37 4 87 7 16 1 201 20 125 13
2009 55 3 17 2 55 3 15 1 125 7 90 6
2010 68 9 28 4 70 11 21 1 167 17 110 14
2011 78 11 15 5 84 12 29 6 174 23 121 16
2012 75 7 24 1 77 7 20 5 204 11 118 9
2013 69 9 14 1 77 9 23 5 176 16 102 15
2014 78 8 6 0 83 8 23 4 172 14 128 10
2015 86 11 12 4 95 12 33 8 201 16 135 17
2016 94 9 25 3 100 9 29 3 209 22 150 16
2017 92 8 16 3 96 8 34 5 201 10 136 11
2018 97 13 22 5 104 14 33 3 206 23 157 19
2019 98 8 25 2 102 8 26 5 221 14 170 12
2020 126 6 33 1 136 6 49 4 286 10 202 10
2021 140 8 0 0 148 8 40 1 317 16 239 13
Police full-time law enforcement employees
Year IndianapolisWorcester
2021 0 497
2020 2,656 492
2019 2,803 506
2018 2,715 495
2017 1,834 505
2016 1,806 485
2015 1,776 467
2014 1,725 487
2013 1,749 477
2012 1,813 462
2011 1,857 465
2010 1,913 467
2009 1,898 472
2008 1,848 502
2007 1,883 513
2006 2,434 516
2005 2,572 496
2004 2,829 473
2003 2,648 483
Police full-time law enforcement employees (per 1,000 residents)
Year IndianapolisWorcester
2021 0.0 2.7
2020 3.0 2.7
2019 3.2 2.7
2018 3.1 2.7
2017 2.1 2.7
2016 2.1 2.6
2015 2.1 2.5
2014 2.0 2.7
2013 2.1 2.6
2012 2.2 2.5
2011 2.2 2.6
2010 2.3 2.6
2009 2.3 2.6
2008 2.3 2.8
2007 2.4 2.9
2006 3.0 2.9
2005 3.2 2.8
2004 3.5 2.7
2003 3.3 2.8
Local government: full-time employees
Job IndianapolisWorcester
Correction 645 0
Financial administration 201 95
Firefighters 1,281 411
Fire - other 150 10
Gas supply 1,068 0
Health 798 75
Hospitals 3,544 0
Judicial and legal 993 12
Natural resources 20 8
Other and unallocable 322 24
Other government administration 510 60
Parks and recreation 302 44
Police - other 501 106
Police protection - officers 1,408 438
Sewerage 32 56
Solid waste management 79 84
Streets and highways 297 53
Totals for government 13,293 1,748
Transit 687 0
Welfare 366 46
Local government: part-time employees
Job IndianapolisWorcester
Financial administration 1 0
Gas supply 170 0
Health 55 0
Hospitals 1,101 0
Other government administration 8 33
Parks and recreation 307 21
Police - other 6 91
Totals for government 1,651 190
Transit 3 0
Place of birth - Foreign born
Residents IndianapolisWorcester
All residents 10.9% 22.4%
American Indian / Alaska Native residents 30.3% 44.9%
Asian residents 70.7% 64.3%
Black or African American residents 10.0% 40.3%
Native Hawaiian / Pacific Islander residents 31.3% 16.9%
Other race residents 43.1% 31.0%
Two or more races residents 13.3% 17.7%
White residents 2.8% 9.9%
White alone, not Hispanic / Latino residents 1.7% 11.1%
Place of birth - Native, outside of US
Residents IndianapolisWorcester
All residents 1.0% 9.1%
American Indian / Alaska Native residents 0.0% 12.4%
Asian residents 0.1% 4.3%
Black or African American residents 1.1% 8.7%
Native Hawaiian / Pacific Islander residents 22.2% 14.5%
Other race residents 3.6% 24.0%
Two or more races residents 1.8% 18.5%
White residents 0.7% 2.1%
White alone, not Hispanic / Latino residents 0.5% 1.2%
Place of birth - Born in state of residence
Residents IndianapolisWorcester
All residents 65.4% 51.8%
American Indian / Alaska Native residents 48.6% 27.3%
Asian residents 20.2% 18.1%
Black or African American residents 66.7% 39.8%
Native Hawaiian / Pacific Islander residents 29.8% 40.9%
Other race residents 37.3% 35.4%
Two or more races residents 64.4% 50.7%
White residents 71.1% 66.6%
White alone, not Hispanic / Latino residents 72.0% 68.5%
Place of birth - Born in other state
Residents IndianapolisWorcester
All residents 22.7% 16.7%
American Indian / Alaska Native residents 21.1% 15.3%
Asian residents 9.0% 13.3%
Black or African American residents 22.2% 11.2%
Native Hawaiian / Pacific Islander residents 16.7% 27.8%
Other race residents 16.1% 9.6%
Two or more races residents 20.4% 13.1%
White residents 25.5% 21.4%
White alone, not Hispanic / Latino residents 25.8% 19.3%
English speakers (speaking English at home)
Type Indianapolis Worcester
Born in the United States residents 92.5% 82.7%
Foreign born residents 18.2% 17.2%
Native, born elsewhere residents 55.3% 15.9%
Total residents 85.6% 63%
Mechanisms of homicide
Mechanism IndianapolisWorcester
Homicides from 2000 to 2006 813 96
Cut / Pierce 23 23
Firearm 585 44
Struck by / against 45 0
Suffocation 47 0
Mechanisms of homicide per 1,000,000 residents
Mechanism IndianapolisWorcester
Homicides from 2000 to 2006 134.0 17.7
Cut / Pierce 3.8 4.2
Firearm 96.4 8.1
Struck by / against 7.4 0
Suffocation 7.7 0
Mechanisms of suicide per 1,000,000 residents
Mechanism IndianapolisWorcester
Suicides from 2000 to 2006 120.8 71.5
Firearm 67.8 17.3
Poisoning 20.3 19.7
Suffocation 25.7 26.7

Infrastructure

Indianapolis benefits from progressive urban planning and boasts a well-planned infrastructure, with an efficient highway system. Worcester's infrastructure includes an impressive array of old and new architecture, but the city faces challenges related to traffic congestion and aging infrastructure.
Infrastructure
Type Indianapolis Worcester
Hospitals 76 14
TV stations 19 24
Arenas or stadiums 3 2
Bank branches located here 259 47
Bank institutions located here 27 12
Main business address for public companies 28 2
Drinking water stations with no reported violations in the past 1 0
Drinking water stations with reported violations in the past 19 6

Schools

School facilities
Type Indianapolis Worcester
Private elementary/middle schools 50 9
Private high schools 25 9
Public elementary/middle schools 171 38
Public high schools 55 9
Colleges/Universities 39 11
HMDA - Conventional home purchase loans - Applications denied
Year IndianapolisWorcester
1999 3,358 262
2000 3,562 328
2001 2,649 237
2002 1,915 312
2003 2,519 469
2004 3,702 822
2005 6,057 1,210
2006 5,811 1,134
2007 3,456 721
2008 1,247 375
2009 565 274

Culture and Food

Indianapolis offers diverse cultural opportunities, with a vibrant music scene, numerous art galleries, and year-round events. The food scene embraces everything from traditional BBQ to global cuisine. Worcester, thanks to its cultural diversity, offers a wide array of culinary choices, from traditional New England fare to eclectic ethnic cuisines.

Sports Teams

Sports are a big deal in Indianapolis, home to the Indianapolis Colts (NFL), Indiana Pacers (NBA), and the world-renowned Indianapolis 500 auto race. Worcester doesn’t have major league teams but is home to many minor league and collegiate sports teams and is within reach of the major professional sports teams in Boston.