In comparison, Indianapolis, Indiana and Newport News, Virginia are cities in the United States that feature different cultural, economic, and geographical landscapes with unique strengths and challenges. Whether considering relocating, or just visiting these cities, it's important to explore their characteristics such as crime and safety rates, the weather, the cost of living, educational opportunities, economic conditions, infrastructure, key industries and occupations, chief employers, real estate, neighborhoods, transportation, tax structures, cultural and food scenes, sports teams, geographical features, and healthcare landscape. This comparison aims to provide you with comprehensive information about these key aspects in both cities.
Distance between
Indianapolis, IN and
Newport News, VA : 555.4 miles
Indianapolis's population is larger by 378%. Its population has grown by 100,169 people (12.8%) since 2000. The population of Newport News has grown by 4,437 people (2.5%) during that time.
While both Indianapolis and Newport News have crime rates above the national average, Newport News tends to have lower rates compared to Indianapolis. However, Newport News experiences higher incidents of violent crimes. Conversely, Indianapolis struggles with both property and violent crimes. For safety-conscious tourists and potential residents, this is a significant factor to consider.
City-data.com crime index counts serious crimes and violent crime more heavily. It adjusts for the number of visitors and daily workers commuting into cities. (higher means more crime, U.S. average = 301.1)
City-data.com crime index counts serious crimes and violent crime more heavily. It adjusts for the number of visitors and daily workers commuting into cities. (higher means more crime, U.S. average = 301.1)
Sex Offenders
According to our data, there are 2,171 registered sex offenders living in Indianapolis and 647 registered sex offenders living in . The ratio of residents to sex offenders in Indianapolis is 393 to 1; the ratio in Newport News is 281 to 1. The number of registered sex offenders compared to the number of residents is a smaller in Indianapolis than in Newport News.
Cost of Living
Overall, the cost of living in Indianapolis is lower as compared to Newport News. This is primarily due to more affordable housing, lower utility costs and transportation expenses in Indianapolis. The affordability of Indianapolis may attract those seeking to relocate for economic reasons.
Income Tax
Both states impose income taxes. However, Virginia has a progressive income tax while Indiana imposes a flat rate. This could influence the take-home pay of residents in each city.
Property Tax
Property taxes in Indianapolis are generally lower than in Newport News, which can be a significant factor for potential homeowners comparing these two cities.
Sales Tax
Both Indiana and Virginia have state sales taxes, but Indiana's sales tax rate is lower at 7%, compared to Virginia's 5.3%. This difference can influence the cost of living and visiting these cities.
Income
Type
Indianapolis
Newport News
Estimated median household income
$58,479
$58,937
Estimated per capita income
$32,792
$31,802
Cost of living index (U.S. average is 100)
87.7
95.9
If you make $50,000 in Indianapolis, you will have to make $54,675 in Newport News to maintain the same standard of living.
Geographical Conditions
Indianapolis is located in the Midwest and is mostly flat, while Newport News is a coastal city in southeastern Virginia. These geographic differences influence the climate, recreational activities, and overall lifestyle in each city.
Both cities have reputable educational institutions but Indianapolis stands proudly with a broad array of universities and colleges, including the renowned Indiana University. Newport News boasts strong public schooling and is home to Christopher Newport University. For individuals prioritizing education, both cities offer strong educational opportunities.
Indianapolis has a diverse economy with strengths in education, healthcare, and finance while Newport News's economy thrives on military, aerospace, and shipbuilding industries. The unemployment rate in Indianapolis is generally lower than in Newport News which suggests a stronger job market.
Biggest Employers
The largest employers in Indianapolis include Indiana University Health, the Indianapolis Public Schools, and St. Vincent. In Newport News, Huntington Ingalls Industries and Riverside Health System dominate the employment landscape.
There were 1,221 building permits issued in Indianapolis in 2012 (704 more than in 2011) compared to 106 building permits issued in Newport News in 2012 (40 less than in 2011).
In Indianapolis (Marion County), 60.1% voted for Democrats and 37.9% for Republicans in 2012 Presidential Election. In Newport News (Newport News city), 64.7% voted for Democrats and 34.5% for Republicans.
Elections
Type
Democrats
Republicans
Other
Year
Indianapolis
Newport News
Indianapolis
Newport News
Indianapolis
Newport News
2020
63.7%
65.4%
34.5%
32.5%
1.9%
2.1%
2016
58.2%
60.3%
35.6%
33.7%
6.2%
6.0%
2012
60.1%
64.7%
37.9%
34.5%
2.0%
0.9%
2008
63.8%
64.5%
35.4%
35.6%
0.8%
0.0%
2004
50.6%
52.2%
48.7%
47.6%
0.7%
0.3%
2000
48.0%
51.6%
49.3%
46.8%
2.8%
1.6%
1996
44.6%
51.0%
47.8%
42.5%
7.7%
6.5%
Breakdown of population affiliated with a religious congregation
Type
Adherents
Congregations
Religion
Indianapolis
Newport News
Indianapolis
Newport News
CATHOLIC CHURCH
11.1%
5.0%
4.6%
1.8%
SOUTHERN BAPTIST CONVENTION
1.6%
7.1%
5.7%
19.5%
AMERICAN BAPTIST CHURCHES IN THE USA
1.2%
2.4%
3.4%
3.0%
LUTHERAN CHURCH
0.8%
0.3%
1.5%
0.6%
EVANGELICAL LUTHERAN CHURCH IN AMERICA
0.5%
0.3%
1.6%
1.2%
SEVENTH DAY ADVENTIST CHURCH
0.5%
0.5%
1.6%
1.8%
EPISCOPAL CHURCH
0.4%
1.0%
1.1%
3.0%
MUSLIM ESTIMATE
0.3%
1.9%
1.1%
0.6%
Weather
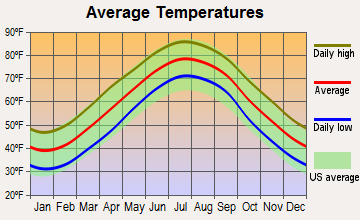
Indianapolis has a humid continental climate with hot, humid summers, and cold winters which can sometimes be severe. Newport News experiences a humid subtropical climate with hot, humid summers, and mild to cool winters. Tourists and potential residents who prefer warmer winter temperatures might find Newport News more appealing.
Weather and climate
Type
Indianapolis
Newport News
Temperature - Average
52.1°F
59.2°F
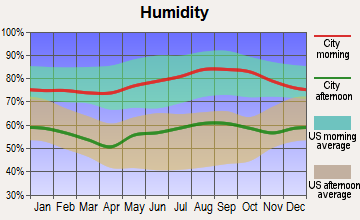
Humidity - Average morning or afternoon humidity
77%
73%
Humidity - Differences between morning and afternoon humidity
31%
32.1%
Humidity - Maximum monthly morning or afternoon humidity
86%
83.1%
Humidity - Minimum monthly morning or afternoon humidity
55%
50.9%
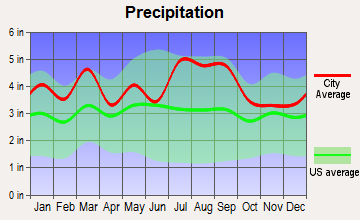
Precipitation - Yearly average
40.6 in
47.8 in
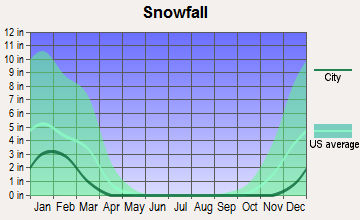
Snowfall - Yearly average
51 in
15.6 in
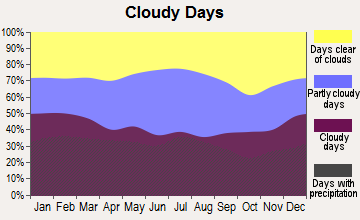
Clouds - Number of days clear of clouds
14.7%
17.6%
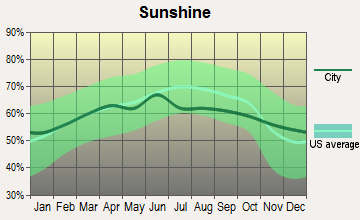
Sunshine amount - Average
56.2%
66.8%
Sunshine amount - Differences during a year
33%
14%
Sunshine amount - Maximum monthly
65%
67%
Sunshine amount - Minimum monthly
32%
53%
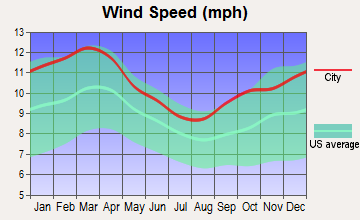
Wind speed - Average
10.3 mph
10.3 mph
Average climate in Indianapolis, Indiana
Average climate in Newport News, Virginia
Air pollution
Type
AQI
CO
NO2
OZONE
PB
PM10
PM25
SO2
Year
Indianapolis
Newport News
Indianapolis
Newport News
Indianapolis
Newport News
Indianapolis
Newport News
Indianapolis
Newport News
Indianapolis
Indianapolis
Newport News
Indianapolis
Newport News
2018
94
57
0.58
0.19
13.2
3.7
23.1
32.5
N/A
0.002
18.2
N/A
10.4
6.1
0.3
0.6
2017
87
60
0.82
0.19
12.4
3.9
23.0
33.8
N/A
0.002
17.6
N/A
10.1
6.9
0.4
0.4
2016
91
66
0.62
0.18
13.0
3.7
22.5
32.7
N/A
0.002
18.0
N/A
9.9
6.1
0.4
0.6
2015
89
57
0.73
0.28
14.9
4.2
22.9
34.7
N/A
0.002
19.7
N/A
9.9
6.4
1.1
0.7
2014
100
59
0.62
0.25
16.1
4.3
25.1
34.5
N/A
0.002
20.6
N/A
12.1
6.8
3.2
1.0
2013
94
66
0.69
0.30
11.5
4.3
26.3
32.1
N/A
0.002
19.9
N/A
12.8
6.8
2.6
1.1
2012
103
76
0.65
0.26
10.4
5.4
25.7
35.8
N/A
0.002
20.8
N/A
12.9
8.1
2.9
1.0
2011
105
66
0.68
0.29
11.3
5.7
22.9
36.2
N/A
0.003
N/A
N/A
16.3
8.8
2.4
1.5
2010
101
80
0.54
0.14
12.7
6.6
21.6
39.3
N/A
0.004
N/A
N/A
15.9
N/A
3.3
2.3
2009
97
54
0.73
0.18
11.4
9.8
23.2
31.5
N/A
0.012
N/A
N/A
13.8
N/A
1.9
2.0
2008
91
77
0.62
0.21
11.5
10.3
N/A
36.2
0.010
0.004
N/A
N/A
13.2
N/A
3.0
3.1
2007
103
81
0.69
0.22
13.1
12.2
N/A
35.6
0.011
0.004
N/A
N/A
14.9
N/A
3.6
3.6
2006
95
62
0.59
0.30
14.5
N/A
N/A
35.1
0.009
0.004
N/A
N/A
14.5
N/A
3.6
3.5
2005
121
67
0.65
0.28
15.2
N/A
N/A
34.8
0.014
N/A
N/A
N/A
18.0
N/A
4.3
3.2
2004
104
80
0.62
0.31
15.8
15.9
N/A
32.9
0.010
N/A
N/A
N/A
15.1
N/A
4.6
3.8
2003
113
84
0.67
0.38
16.6
16.2
N/A
33.6
0.010
N/A
N/A
N/A
15.8
N/A
4.2
3.1
2002
125
99
0.76
0.38
17.4
17.8
N/A
37.6
0.009
N/A
N/A
N/A
16.8
N/A
3.9
3.7
2001
105
92
0.81
0.43
16.6
18.2
N/A
35.5
0.031
N/A
N/A
N/A
16.3
N/A
3.8
4.3
2000
98
85
0.87
0.48
17.3
15.7
N/A
35.6
N/A
N/A
N/A
N/A
N/A
N/A
4.5
5.2
Natural disasters
Type
Indianapolis
Newport News
Tornado activity compared to U.S. average
226.7%
77.4%
Earthquake activity compared to U.S. average
179.6%
38.4%
Natural disasters compared to U.S. average
16%
0%
Transportation
Both cities offer public transit options, with Indianapolis's IndyGo bus system and Newport News's Hampton Roads Transit. However, road infrastructure and traffic congestion can be more significant issues in Newport News.
Transport
Type
Indianapolis
Newport News
Amtrak stations
1
1
Amtrak stations nearby
1
3
FAA registered aircraft
739
140
FAA registered aircraft manufacturers and dealers
18
3
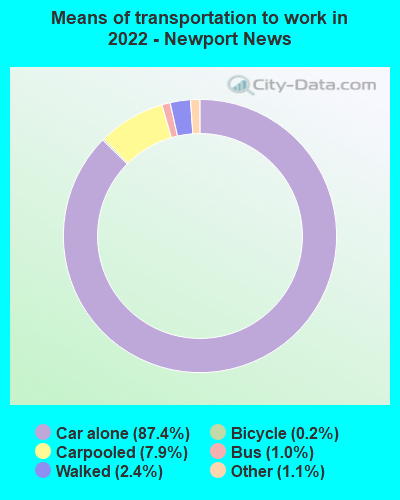
Means of transportation to work
Type
Indianapolis
Newport News
Bicycle
0.5%
0.2%
Bus
1.2%
1.6%
Carpooled
8.5%
8.8%
Car alone
87.3%
84.2%
Motorcycle
0%
0.2%
Taxicab
0.1%
0.2%
Walked
1.6%
3%
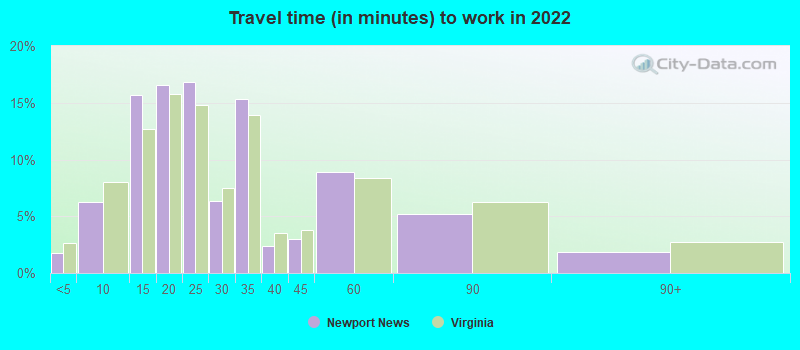
Average travel time to work
Type
Indianapolis
Newport News
Average
28.1 min
25.3 min
Other means
22.5 min
23.5 min
Public transportation
40.2 min
37.8 min
Private vehicle occupancy
Type
Indianapolis
Newport News
Average
1.2
1.1
Drove alone
88.2%
90.5%
In 2 person carpool
9.4%
7.5%
In 3 person carpool
1.3%
0.9%
In 4 person carpool
0.5%
0.8%
In 5-6 person carpool
0.4%
0.2%
In 7+ person carpool
0.1%
0.2%
How many people usually rode to work in the car, truck or van.
Real Estate
Real Estate in Indianapolis is more affordable than in Newport News. Median home values in Indianapolis tend to be lower, making it a potentially more attractive choice for home buyers or property investors.
Neighborhoods
Indianapolis is known for its family-friendly neighborhoods such as Fishers, Carmel, and Zionsville, while Newport News is noted for its coastal neighborhoods like Hilton Village and Port Warwick.
Houses and residents
Type
Indianapolis
Newport News
Houses
399,820
81,913
Average household size (people)
2.4
2.5
Median year apartment built
1977
1980
Median year house/condo built
1971
1975
Length of stay in the house since moving in
13 years
13.5 years
Houses occupied
358,150 (89.6%)
77,489 (94.6%)
Houses occupied by owners
201,149 (56.2%)
36,527 (47.1%)
Houses occupied by renters
157,001 (43.8%)
40,962 (52.9%)
Median rent asked for vacant for-rent units
$876.58
$590.70
Median monthly housing costs
$980
$1,162
Median price asked for vacant for-sale houses and condos
$283,027
$120,982
Estimated median house or condo value
$188,700
$227,200
Median numbers of rooms
5.5
5.4
Median number of rooms in apartments
4.3
4.3
Median number of rooms in houses and condos
6.5
6.7
Median house price - detached houses
$231,490
$267,334
Median house price - in 2-unit structures
$257,253
$380,372
Median house price - in 3-to-4-unit structures
$240,688
$169,768
Median house price - in 5 or more unit structures
$247,275
$127,673
Median house price - mobile homes
$58,413
$31,513
Median house price - Townhouses or other attached units
$222,424
$194,043
Median house price - All housing units
$229,666
$247,907
Median house age
48
43
Renting percentage
44.2%
48.9%
Housing density (houses/condos per square mile)
1,106.1
1,199.4
House value disparities
36.1%
28.7%
Household income disparities
44.4%
42.3%
Median household income for houses/condes with a mortgage
$86,008
$88,971
Median household income for apartments without a mortgage
$61,922
$56,811
Housing units without a mortgage
4,552 (3.2%)
874 (3.2%)
Housing units with both a second mortgage and home equity loan
9,787 (6.8%)
2,248 (8.2%)
Housing units with a mortgage
138,622 (96.8%)
26,453 (96.8%)
Housing units with a home equity loan
271 (0.2%)
0 (0%)
Housing units with a second mortgage
12,987 (9.1%)
3,277 (12%)
House/condo owner moved in on average (years ago)
11
13
House/condo renter moved in on average (years ago)
1
1
Housing units lacking complete kitchen facilities
3.4%
1%
Housing units lacking complete plumbing facilities
1.1%
1.6%
Housing units in structures
Housing units in structures
Indianapolis
Newport News
One, detached
59.0%
49.0%
One, attached
9.2%
9.2%
Two
2.5%
0.9%
3 or 4
6.2%
6.9%
5 to 9
7.7%
12.2%
10 to 19
6.3%
10.5%
20 to 49
3.1%
2.8%
50 or more
5.0%
6.1%
Mobile homes
1.0%
2.3%
Median real estate property taxes paid for housing units
Self-employed workers in own not incorporated business
17,131
2,334
State government workers
15,502
2,440
Unpaid family workers
1,601
36
Industries and Occupations
The dominant industries in Indianapolis are healthcare, manufacturing, and retail trade. Newport News, on the other hand, has a strong focus on the shipbuilding, military, and government services industries.
Indianapolis is known for its high-quality healthcare, particularly the Indiana University Health system which is ranked nationally. Newport News offers quality healthcare through Riverside Health System and Bon Secours Mary Immaculate Hospital.
Health (county statistics)
Type
Indianapolis
Newport News
General health status score of residents in this county from 1 (poor) to 5 (excellent)
Indianapolis is home to the world’s largest children’s museum and a highly-rated zoo, among other attractions. Newport News offers outstanding parks, museums, and is known for its coastal features.
HMDA - Conventional home purchase loans - Applications denied
Year
Indianapolis
Newport News
1999
3,358
0
2000
3,562
0
2001
2,649
0
2002
1,915
0
2003
2,519
347
2004
3,702
566
2005
6,057
738
2006
5,811
730
2007
3,456
472
2008
1,247
128
2009
565
38
Culture and Food
Indianapolis’s culture is steeped in sports and car racing, and the food scene is a mix of classic American cuisine and globally-influenced fare. Newport News offers maritime culture, historical attractions, and southern cuisine with seafood being a staple.
Sports Teams
Indianapolis is home to several professional sports franchises, including the Indianapolis Colts (NFL) and the Indiana Pacers (NBA). Newport News, while not being home to any major-league sports franchises, is in close proximity to teams in nearby cities.


 Indianapolis, IN and
  Newport News, VA : 555.4 miles