Indianapolis, Indiana, and Madison, Wisconsin, both offer their unique experiences, with varying perspectives on crime and safety, weather, cost of living, education, and more. The populous and vibrant city of Indianapolis is known for its diverse activities, sports teams, and industries, while Madison is recognized for its education system, healthcare, and its tech economy. In considering relocation or visitation, a comprehensive compare and contrast of the two is detailed below.
Distance between
Indianapolis, IN and
Madison, WI : 282.4 miles
Indianapolis's population is larger by 228%. Its population has grown by 100,169 people (12.8%) since 2000. The population of Madison has grown by 61,142 people (29.4%) during that time.
The general crime rate in Indianapolis is relatively higher than in Madison, according to FBI crime statistics. While Madison also experiences crime, its rate remains one of the lowest among mid-sized cities in the country. However, like all cities, both have their safer and less-safe areas, with crime rates varying by neighborhood.
City-data.com crime index counts serious crimes and violent crime more heavily. It adjusts for the number of visitors and daily workers commuting into cities. (higher means more crime, U.S. average = 301.1)
City-data.com crime index counts serious crimes and violent crime more heavily. It adjusts for the number of visitors and daily workers commuting into cities. (higher means more crime, U.S. average = 301.1)
Sex Offenders
According to our data, there are 2,171 registered sex offenders living in Indianapolis and 563 registered sex offenders living in . The ratio of residents to sex offenders in Indianapolis is 393 to 1; the ratio in Madison is 449 to 1. The number of registered sex offenders compared to the number of residents in Indianapolis is near to than in Madison.
Cost of Living
Indianapolis is known for its notably low cost of living compared to the national average, especially in terms of housing. Madison’s cost of living, while higher relative to Indianapolis, is still below major metropolitan areas and offers a higher standard of living. Both cities offer reasonable prices on groceries, utilities, and other expenses.
Income Tax
Indiana has a flat state income tax rate of 3.23%, with an additional county tax that can bring it up to almost 5%, depending on the county. Wisconsin has a progressive tax system ranging from 4% up to 7.65% for the highest earners.
Property Tax
Indiana has a lower property tax rate than Wisconsin. However, since property values are lower in Indianapolis, homeowners may find overall costs comparable between the two cities.
Sales Tax
Indiana has a state sales tax rate of 7% with no additional city sales tax in Indianapolis. Wisconsin has a lower state sales tax at 5%, but Madison adds a 0.5% county tax, which brings it up to 5.5%.
Income
Type
Indianapolis
Madison
Estimated median household income
$58,479
$67,270
Estimated per capita income
$32,792
$42,473
Cost of living index (U.S. average is 100)
87.7
98.2
If you make $50,000 in Indianapolis, you will have to make $55,986 in Madison to maintain the same standard of living.
Geographical Conditions
Indianapolis, known as the "Crossroads of America," features a flat terrain, while Madison is surrounded by lakes and rolling hills, offering more natural beauty and water-related activities.
Madison shines in the education sector, with top-rated schools and the notable University of Wisconsin-Madison. Indianapolis also values education but is known for offering a more diverse array of options, including a broad range of private and charter schools.
In Indianapolis, several sectors drive the economy, including healthcare, manufacturing, and retail. For Madison, government, education, and healthcare are the primary sectors, although the city has a burgeoning tech scene. Unemployment rates are generally low in both cities, with steady job growth.
Biggest Employers
Indianapolis is home to several Fortune 500 companies, with the largest employers being Anthem Inc, St. Vincent Health, and Indiana University Health. Madison's largest employers include the University of Wisconsin-Madison, American Family Insurance, and Epic Systems Corporation.
There were 1,221 building permits issued in Indianapolis in 2012 (704 more than in 2011) compared to 327 building permits issued in Madison in 2012 (150 more than in 2011).
In Indianapolis (Marion County), 60.1% voted for Democrats and 37.9% for Republicans in 2012 Presidential Election. In Madison (Dane County), 71.2% voted for Democrats and 27.6% for Republicans.
Elections
Type
Democrats
Republicans
Other
Year
Indianapolis
Madison
Indianapolis
Madison
Indianapolis
Madison
2020
63.7%
75.9%
34.5%
23.0%
1.9%
1.1%
2016
58.2%
70.5%
35.6%
23.1%
6.2%
6.5%
2012
60.1%
71.2%
37.9%
27.6%
2.0%
1.2%
2008
63.8%
73.2%
35.4%
26.0%
0.8%
0.9%
2004
50.6%
66.2%
48.7%
33.0%
0.7%
0.8%
2000
48.0%
61.4%
49.3%
32.7%
2.8%
6.0%
1996
44.6%
56.9%
47.8%
30.9%
7.7%
12.2%
Breakdown of population affiliated with a religious congregation
Type
Adherents
Congregations
Religion
Indianapolis
Madison
Indianapolis
Madison
CATHOLIC CHURCH
11.1%
21.7%
4.6%
9.7%
SOUTHERN BAPTIST CONVENTION
1.6%
0.1%
5.7%
2.3%
AMERICAN BAPTIST CHURCHES IN THE USA
1.2%
0.8%
3.4%
0.9%
LUTHERAN CHURCH
0.8%
0.8%
1.5%
3.4%
EVANGELICAL LUTHERAN CHURCH IN AMERICA
0.5%
10.0%
1.6%
13.7%
SEVENTH DAY ADVENTIST CHURCH
0.5%
0.2%
1.6%
0.9%
EPISCOPAL CHURCH
0.4%
0.3%
1.1%
1.4%
MUSLIM ESTIMATE
0.3%
0.5%
1.1%
0.9%
WISCONSIN EVANGELICAL LUTHERAN SYNOD
0.0%
0.9%
0.1%
3.1%
Weather
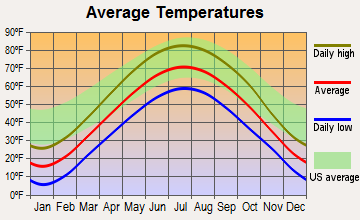
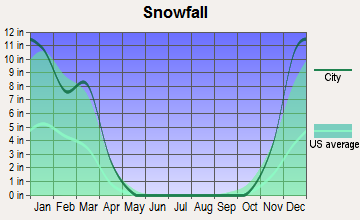
Both Indianapolis and Madison experience a midwestern climate characterized by hot summers and cold winters. However, Madison experiences colder winters due to its more northerly location, with additional snowfall compared to Indianapolis.
Weather and climate
Type
Indianapolis
Madison
Temperature - Average
52.1°F
45.4°F
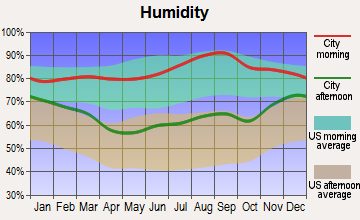
Humidity - Average morning or afternoon humidity
77%
77.7%
Humidity - Differences between morning and afternoon humidity
31%
37%
Humidity - Maximum monthly morning or afternoon humidity
86%
90%
Humidity - Minimum monthly morning or afternoon humidity
55%
53%
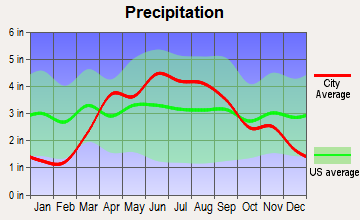
Precipitation - Yearly average
40.6 in
35.2 in
Snowfall - Yearly average
51 in
88.6 in
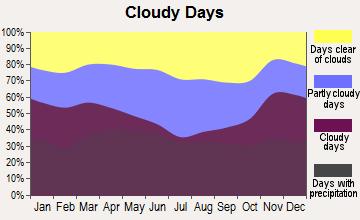
Clouds - Number of days clear of clouds
14.7%
14.7%
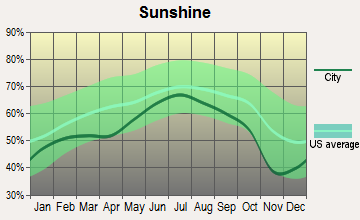
Sunshine amount - Average
56.2%
56.6%
Sunshine amount - Differences during a year
33%
31%
Sunshine amount - Maximum monthly
65%
67%
Sunshine amount - Minimum monthly
32%
36%
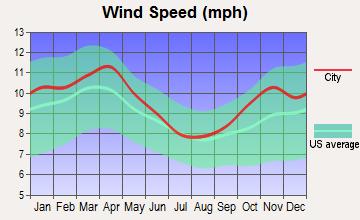
Wind speed - Average
10.3 mph
8.8 mph
Average climate in Indianapolis, Indiana
Average climate in Madison, Wisconsin
Air pollution
Type
AQI
CO
NO2
OZONE
PB
PM10
PM25
SO2
Year
Indianapolis
Madison
Indianapolis
Indianapolis
Indianapolis
Madison
Indianapolis
Madison
Indianapolis
Indianapolis
Madison
Indianapolis
Madison
2018
94
72
0.58
N/A
13.2
N/A
23.1
31.7
N/A
N/A
18.2
N/A
10.4
8.6
0.3
0.2
2017
87
67
0.82
N/A
12.4
N/A
23.0
31.0
N/A
N/A
17.6
N/A
10.1
7.4
0.4
0.8
2016
91
68
0.62
N/A
13.0
N/A
22.5
31.3
N/A
N/A
18.0
N/A
9.9
8.5
0.4
0.0
2015
89
72
0.73
N/A
14.9
N/A
22.9
32.2
N/A
N/A
19.7
N/A
9.9
7.6
1.1
0.1
2014
100
79
0.62
N/A
16.1
N/A
25.1
32.2
N/A
N/A
20.6
N/A
12.1
8.8
3.2
1.1
2013
94
75
0.69
N/A
11.5
N/A
26.3
34.0
N/A
N/A
19.9
N/A
12.8
9.2
2.6
1.4
2012
103
92
0.65
N/A
10.4
N/A
25.7
36.6
N/A
N/A
20.8
N/A
12.9
9.3
2.9
N/A
2011
105
85
0.68
N/A
11.3
N/A
22.9
32.0
N/A
N/A
N/A
N/A
16.3
10.5
2.4
N/A
2010
101
81
0.54
N/A
12.7
N/A
21.6
30.9
N/A
N/A
N/A
N/A
15.9
12.6
3.3
N/A
2009
97
49
0.73
N/A
11.4
N/A
23.2
27.9
N/A
N/A
N/A
N/A
13.8
N/A
1.9
N/A
2008
91
54
0.62
N/A
11.5
N/A
N/A
29.3
0.010
N/A
N/A
N/A
13.2
N/A
3.0
N/A
2007
103
68
0.69
N/A
13.1
N/A
N/A
29.0
0.011
N/A
N/A
N/A
14.9
N/A
3.6
N/A
2006
95
56
0.59
N/A
14.5
N/A
N/A
27.8
0.009
N/A
N/A
N/A
14.5
N/A
3.6
N/A
2005
121
88
0.65
N/A
15.2
N/A
N/A
34.6
0.014
0.004
N/A
N/A
18.0
N/A
4.3
N/A
2004
104
62
0.62
N/A
15.8
N/A
N/A
29.2
0.010
N/A
N/A
N/A
15.1
N/A
4.6
N/A
2003
113
85
0.67
N/A
16.6
N/A
N/A
34.2
0.010
0.005
N/A
N/A
15.8
N/A
4.2
N/A
2002
125
89
0.76
N/A
17.4
N/A
N/A
33.3
0.009
0.005
N/A
N/A
16.8
N/A
3.9
N/A
2001
105
83
0.81
N/A
16.6
N/A
N/A
33.6
0.031
N/A
N/A
N/A
16.3
N/A
3.8
N/A
2000
98
78
0.87
N/A
17.3
N/A
N/A
28.5
N/A
N/A
N/A
N/A
N/A
N/A
4.5
N/A
Natural disasters
Type
Indianapolis
Madison
Tornado activity compared to U.S. average
226.7%
172.3%
Earthquake activity compared to U.S. average
179.6%
137.1%
Natural disasters compared to U.S. average
16%
18%
Transportation
Indianapolis has a robust highway system, and is introducing improved public transit options. Madison offers extensive bike paths and pedestrian-friendly routes, along with efficient bus service throughout the city.
Transport
Type
Indianapolis
Madison
Amtrak stations
1
1
Amtrak stations nearby
1
1
FAA registered aircraft
739
192
FAA registered aircraft manufacturers and dealers
18
0
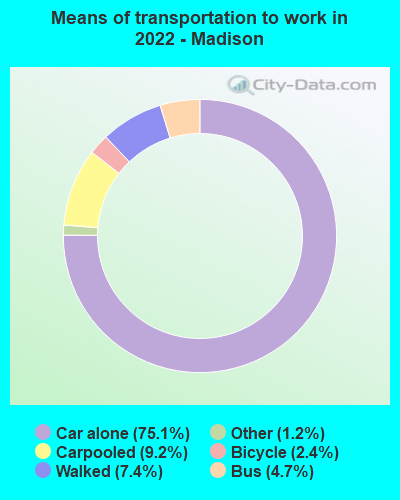
Means of transportation to work
Type
Indianapolis
Madison
Bicycle
0.5%
2.6%
Bus
1.2%
2.7%
Carpooled
8.5%
6%
Car alone
87.3%
78.7%
Motorcycle
0%
0.2%
Taxicab
0.1%
0.2%
Walked
1.6%
8%
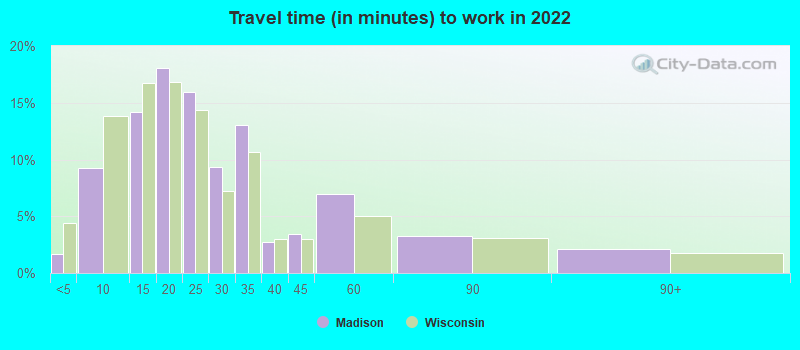
Average travel time to work
Type
Indianapolis
Madison
Average
28.1 min
24.5 min
Other means
22.5 min
19 min
Public transportation
40.2 min
29.2 min
Private vehicle occupancy
Type
Indianapolis
Madison
Average
1.2
1.1
Drove alone
88.2%
91.8%
In 2 person carpool
9.4%
6.5%
In 3 person carpool
1.3%
0.9%
In 4 person carpool
0.5%
0.2%
In 5-6 person carpool
0.4%
0.2%
In 7+ person carpool
0.1%
0%
How many people usually rode to work in the car, truck or van.
Real Estate
In terms of real estate, Indianapolis tends to be cheaper with a median home value below the national average. Madison is more expensive but offers steady appreciation rates, making it a good place for real estate investment.
Neighborhoods
Each city has its unique neighborhoods, offering different lifestyles. Indianapolis features Fountain Square and Broad Ripple, well-loved for their vibrant arts and culture scene. Madison has Middleton and Shorewood Hills, known for their community focus and green spaces.
Houses and residents
Type
Indianapolis
Madison
Houses
399,820
129,717
Average household size (people)
2.4
2.2
Median year apartment built
1977
1982
Median year house/condo built
1971
1974
Length of stay in the house since moving in
13 years
13.2 years
Houses occupied
358,150 (89.6%)
123,938 (95.5%)
Houses occupied by owners
201,149 (56.2%)
60,243 (48.6%)
Houses occupied by renters
157,001 (43.8%)
63,695 (51.4%)
Median rent asked for vacant for-rent units
$876.58
$2,135
Median monthly housing costs
$980
$1,351
Median price asked for vacant for-sale houses and condos
$283,027
$175,077
Estimated median house or condo value
$188,700
$321,800
Median numbers of rooms
5.5
4.9
Median number of rooms in apartments
4.3
3.7
Median number of rooms in houses and condos
6.5
6.5
Median house price - detached houses
$231,490
$351,769
Median house price - in 2-unit structures
$257,253
$350,485
Median house price - in 3-to-4-unit structures
$240,688
$238,103
Median house price - in 5 or more unit structures
$247,275
$277,140
Median house price - mobile homes
$58,413
$9,290
Median house price - Townhouses or other attached units
$222,424
$258,266
Median house price - All housing units
$229,666
$335,361
Median house age
48
43
Renting percentage
44.2%
50.7%
Housing density (houses/condos per square mile)
1,106.1
1,888.9
House value disparities
36.1%
27.2%
Household income disparities
44.4%
45.9%
Median household income for houses/condes with a mortgage
$86,008
$112,726
Median household income for apartments without a mortgage
$61,922
$80,181
Housing units without a mortgage
4,552 (3.2%)
1,001 (2.3%)
Housing units with both a second mortgage and home equity loan
9,787 (6.8%)
5,840 (13.7%)
Housing units with a mortgage
138,622 (96.8%)
41,600 (97.7%)
Housing units with a home equity loan
271 (0.2%)
44 (0.1%)
Housing units with a second mortgage
12,987 (9.1%)
6,790 (15.9%)
House/condo owner moved in on average (years ago)
11
11
House/condo renter moved in on average (years ago)
1
1
Housing units lacking complete kitchen facilities
3.4%
0.6%
Housing units lacking complete plumbing facilities
1.1%
0.2%
Housing units in structures
Housing units in structures
Indianapolis
Madison
One, detached
59.0%
41.5%
One, attached
9.2%
5.7%
Two
2.5%
4.5%
3 or 4
6.2%
7.1%
5 to 9
7.7%
8.0%
10 to 19
6.3%
5.2%
20 to 49
3.1%
12.3%
50 or more
5.0%
15.4%
Mobile homes
1.0%
0.2%
Median real estate property taxes paid for housing units
Self-employed workers in own not incorporated business
17,131
7,087
State government workers
15,502
26,258
Unpaid family workers
1,601
73
Industries and Occupations
Indy has a diverse economy, with sectors including healthcare, insurance, manufacturing, and retail thriving. Madison, meanwhile, is particularly known for its tech industry and educational sector, along with healthcare and manufacturing.
Both cities offer high-quality healthcare, but Madison stands out with the University of Wisconsin-Madison's medical school and research programs, along with top-rated hospitals.
Health (county statistics)
Type
Indianapolis
Madison
General health status score of residents in this county from 1 (poor) to 5 (excellent)
Both cities possess solid infrastructure, with Indianapolis known for its Indianapolis International Airport, which regularly receives accolades. Madison boasts a well-planned bike and pedestrian infrastructure, which, combined with a smaller city size, often results in shorter commute times.
Infrastructure
Type
Indianapolis
Madison
Hospitals
76
10
TV stations
19
9
Arenas or stadiums
3
2
Bank branches located here
259
90
Bank institutions located here
27
23
Main business address for public companies
28
7
Drinking water stations with no reported violations in the past
1
169
Drinking water stations with reported violations in the past
HMDA - Conventional home purchase loans - Applications denied
Year
Indianapolis
Madison
1999
3,358
218
2000
3,562
210
2001
2,649
157
2002
1,915
167
2003
2,519
305
2004
3,702
398
2005
6,057
532
2006
5,811
453
2007
3,456
354
2008
1,247
196
2009
565
160
Culture and Food
Both cities offer rich cultural experiences and food scenes. Indianapolis is particularly known for its racing history, arts districts, and 'Hoosier' cuisine, while Madison offers a rich blend of Midwestern hospitality, farm-to-table dining, and craft beer culture.
Sports Teams
Both cities feature notable sports teams. Indianapolis is home to the Indianapolis Colts (NFL) and the Indiana Pacers (NBA), whereas Madison is principally known for college sports at the University of Wisconsin-Madison.


 Indianapolis, IN and
  Madison, WI : 282.4 miles