Indianapolis, IN and Hialeah, FL are two distinctive cities each offering unique living experiences. Indianapolis, symbolizing the broad Midwest, delivers a quiet, laid-back lifestyle with a low cost of living but has many opportunities for sports enthusiasts. On the other hand, Hialeah is characterized by its sunny weather, vibrant, diverse culture, and close proximity to Miami, yet it has a higher cost of living. This side-by-side comparison of these cities across various parameters is an essential guide for potential residents and tourists alike.
Distance between
Indianapolis, IN and
Hialeah, FL : 1,020.1 miles
Indianapolis's population is larger by 300%. Its population has grown by 100,169 people (12.8%) since 2000. The population of Hialeah has decreased by 5,929 people (2.6%) during that time.
Indianapolis has been struggling with crime rates that exceed national averages. Theft and property crime are particularly high, leading to a higher overall crime rate compared to Hialeah. However, safety varies hugely by neighborhood. Conversely, Hialeah, while not entirely devoid of crime, is generally safer than Indianapolis with crime rates lower than the national average.
City-data.com crime index counts serious crimes and violent crime more heavily. It adjusts for the number of visitors and daily workers commuting into cities. (higher means more crime, U.S. average = 301.1)
City-data.com crime index counts serious crimes and violent crime more heavily. It adjusts for the number of visitors and daily workers commuting into cities. (higher means more crime, U.S. average = 301.1)
Sex Offenders
According to our data, there are 2,171 registered sex offenders living in Indianapolis and 112 registered sex offenders living in . The ratio of residents to sex offenders in Indianapolis is 393 to 1; the ratio in Hialeah is 2,142 to 1. The number of registered sex offenders compared to the number of residents is much larger in Indianapolis than that in Hialeah.
Cost of Living
Indianapolis boasts one of the lowest costs of living among U.S cities, especially regarding housing prices. On the contrary, living in Hialeah is more expensive with high housing and overall living costs, partly due to its close proximity to Miami.
Income Tax
Indiana has a flat state income tax rate of 3.23%, with an additional county income tax which brings Indianapolis' total to about 3.23%-3.4% depending on specific location. Florida, including Hialeah, levies no state income tax, offering considerable savings for residents.
Property Tax
Indianapolis has a relatively low property tax with an average rate around 0.81%, whereas Hialeah's property tax rate is notably higher, with rates averaging around 1.6%.
Sales Tax
The combined city and state sales tax rate in Indianapolis is 7%. In Hialeah, the combined rate is higher at 7.5% due to the addition of the Miami-Dade County sales tax.
Income
Type
Indianapolis
Hialeah
Estimated median household income
$58,479
$46,674
Estimated per capita income
$32,792
$21,712
Cost of living index (U.S. average is 100)
87.7
107
If you make $50,000 in Indianapolis, you will have to make $61,003 in Hialeah to maintain the same standard of living.
Geographical Conditions
Indianapolis is flat with no major bodies of water, apart from the White River. Hialeah is situated in a low-lying coastal area, making it prone to flooding, especially during hurricane season.
Indianapolis offers a variety of public and private education options with universities like Butler and Ivy Tech Community College. In contrast, education in Hialeah is largely served by Miami-Dade County Public Schools with Florida National University and Miami Dade College's Hialeah Campus being key higher education institutions.
While both cities have diverse economies, they excel in different areas. Indianapolis' economy is driven by industries such as healthcare, education, finance, and logistics, complemented by a burgeoning tech sector. On the other hand, Hialeah is essentially connected to Miami's thriving economy, with an emphasis on industries like healthcare, education, retail, and hospitality.
Biggest Employers
In Indianapolis, some of the biggest employers are Indiana University Health, Eli Lilly, and Anthem Inc. Hialeah's residents mostly work in nearby Miami; hence Miami-Dade County, Miami International Airport, and the University of Miami are among the city's biggest employers.
There were 1,221 building permits issued in Indianapolis in 2012 (704 more than in 2011) compared to 2 building permits issued in Hialeah in 2012 (15 less than in 2011).
In Indianapolis (Marion County), 60.1% voted for Democrats and 37.9% for Republicans in 2012 Presidential Election. In Hialeah (Miami-Dade County), 61.8% voted for Democrats and 38.0% for Republicans.
Elections
Type
Democrats
Republicans
Other
Year
Indianapolis
Hialeah
Indianapolis
Hialeah
Indianapolis
Hialeah
2020
63.7%
53.5%
34.5%
46.2%
1.9%
0.3%
2016
58.2%
63.4%
35.6%
33.9%
6.2%
2.7%
2012
60.1%
61.8%
37.9%
38.0%
2.0%
0.3%
2008
63.8%
58.1%
35.4%
41.9%
0.8%
0.0%
2004
50.6%
53.0%
48.7%
46.7%
0.7%
0.3%
2000
48.0%
52.7%
49.3%
46.4%
2.8%
0.9%
1996
44.6%
57.3%
47.8%
37.9%
7.7%
4.8%
Breakdown of population affiliated with a religious congregation
Type
Adherents
Congregations
Religion
Indianapolis
Hialeah
Indianapolis
Hialeah
CATHOLIC CHURCH
11.1%
21.8%
4.6%
4.5%
SOUTHERN BAPTIST CONVENTION
1.6%
3.2%
5.7%
21.8%
AMERICAN BAPTIST CHURCHES IN THE USA
1.2%
0.0%
3.4%
0.2%
LUTHERAN CHURCH
0.8%
0.1%
1.5%
0.8%
EVANGELICAL LUTHERAN CHURCH IN AMERICA
0.5%
0.2%
1.6%
1.3%
SEVENTH DAY ADVENTIST CHURCH
0.5%
1.1%
1.6%
4.3%
EPISCOPAL CHURCH
0.4%
0.5%
1.1%
2.1%
MUSLIM ESTIMATE
0.3%
0.9%
1.1%
1.0%
Weather
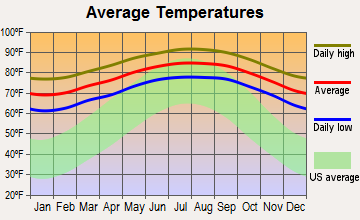
There is a stark contrast when it comes to weather in Indianapolis and Hialeah. Indianapolis experiences four distinctive seasons, including cold winters and humid summers. Tornadoes can also be a concern. On the other hand, Hialeah benefits from a tropical monsoon climate which means warm winters and hot, rainy summers. Its proximity to the Atlantic Ocean provides breezy relief from the heat.
Weather and climate
Type
Indianapolis
Hialeah
Temperature - Average
52.1°F
77.9°F
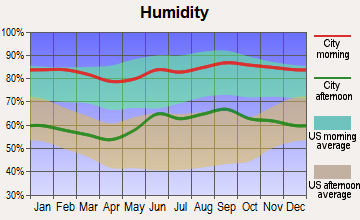
Humidity - Average morning or afternoon humidity
77%
77.3%
Humidity - Differences between morning and afternoon humidity
31%
31%
Humidity - Maximum monthly morning or afternoon humidity
86%
86%
Humidity - Minimum monthly morning or afternoon humidity
55%
55%
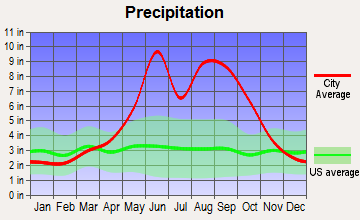
Precipitation - Yearly average
40.6 in
63.5 in
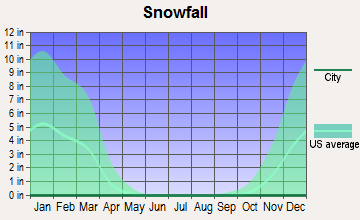
Snowfall - Yearly average
51 in
0 in
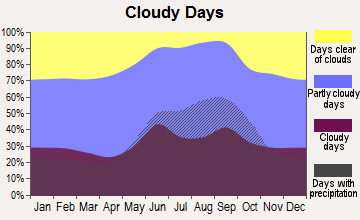
Clouds - Number of days clear of clouds
14.7%
12.3%
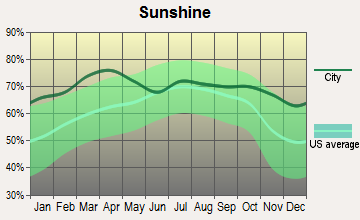
Sunshine amount - Average
56.2%
76.8%
Sunshine amount - Differences during a year
33%
16%
Sunshine amount - Maximum monthly
65%
79%
Sunshine amount - Minimum monthly
32%
63%
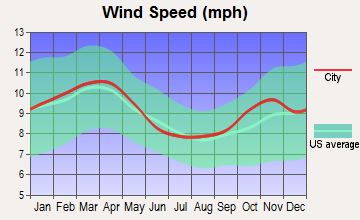
Wind speed - Average
10.3 mph
9.1 mph
Average climate in Indianapolis, Indiana
Average climate in Hialeah, Florida
Air pollution
Type
AQI
CO
NO2
OZONE
PB
PM10
PM25
SO2
Year
Indianapolis
Hialeah
Indianapolis
Hialeah
Indianapolis
Hialeah
Indianapolis
Hialeah
Indianapolis
Indianapolis
Hialeah
Indianapolis
Hialeah
Indianapolis
Hialeah
2018
94
72
0.58
0.24
13.2
5.4
23.1
27.8
N/A
N/A
18.2
15.5
10.4
8.1
0.3
0.3
2017
87
80
0.82
0.24
12.4
6.1
23.0
27.4
N/A
N/A
17.6
N/A
10.1
8.4
0.4
0.3
2016
91
68
0.62
0.25
13.0
5.5
22.5
29.3
N/A
N/A
18.0
N/A
9.9
7.1
0.4
0.0
2015
89
62
0.73
0.22
14.9
3.4
22.9
26.2
N/A
N/A
19.7
N/A
9.9
8.2
1.1
0.0
2014
100
71
0.62
0.23
16.1
4.6
25.1
27.7
N/A
N/A
20.6
N/A
12.1
8.0
3.2
0.0
2013
94
64
0.69
0.18
11.5
3.4
26.3
27.3
N/A
N/A
19.9
N/A
12.8
7.9
2.6
0.0
2012
103
71
0.65
0.19
10.4
3.4
25.7
28.6
N/A
N/A
20.8
N/A
12.9
8.7
2.9
0.0
2011
105
72
0.68
0.12
11.3
3.7
22.9
28.3
N/A
N/A
N/A
N/A
16.3
8.7
2.4
0.0
2010
101
77
0.54
0.33
12.7
5.0
21.6
29.4
N/A
N/A
N/A
N/A
15.9
9.1
3.3
0.0
2009
97
67
0.73
0.52
11.4
4.2
23.2
28.8
N/A
N/A
N/A
N/A
13.8
9.1
1.9
0.0
2008
91
95
0.62
0.59
11.5
4.2
N/A
31.0
0.010
N/A
N/A
18.0
13.2
10.5
3.0
0.0
2007
103
94
0.69
0.65
13.1
5.4
N/A
33.5
0.011
N/A
N/A
21.9
14.9
10.5
3.6
0.0
2006
95
87
0.59
0.57
14.5
6.4
N/A
34.6
0.009
N/A
N/A
22.3
14.5
10.2
3.6
0.0
2005
121
75
0.65
0.52
15.2
6.5
N/A
31.8
0.014
N/A
N/A
18.8
18.0
8.7
4.3
0.0
2004
104
69
0.62
1.03
15.8
6.4
N/A
31.3
0.010
N/A
N/A
19.5
15.1
8.5
4.6
0.3
2003
113
70
0.67
1.11
16.6
7.2
N/A
29.5
0.010
N/A
N/A
N/A
15.8
8.4
4.2
0.4
2002
125
75
0.76
0.73
17.4
6.5
N/A
30.2
0.009
N/A
N/A
N/A
16.8
8.4
3.9
2.1
2001
105
84
0.81
0.74
16.6
6.8
N/A
30.2
0.031
N/A
N/A
N/A
16.3
9.1
3.8
1.5
2000
98
66
0.87
0.81
17.3
7.3
N/A
31.1
N/A
N/A
N/A
N/A
N/A
N/A
4.5
1.3
Natural disasters
Type
Indianapolis
Hialeah
Tornado activity compared to U.S. average
226.7%
66.7%
Earthquake activity compared to U.S. average
179.6%
1.1%
Natural disasters compared to U.S. average
16%
10%
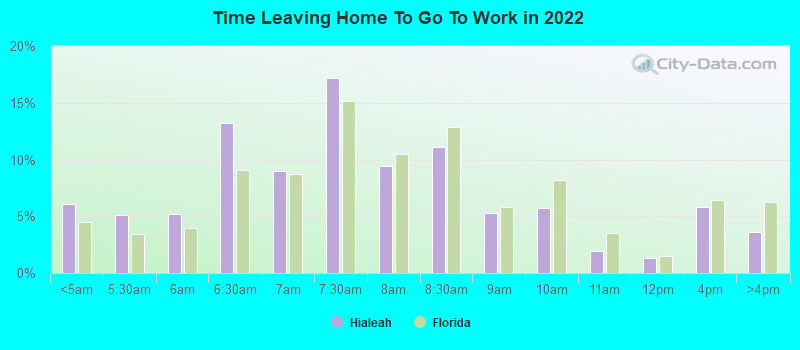
Transportation
Indianapolis provides extensive bus services, supplemented by bike shares and e-scooters. However, owning a car is beneficial due to the city's sprawling nature. Hialeah, due to its denser nature, has extensive public transportation options, including buses, the Miami-Dade Transit's Metrorail, and Tri-Rail.
Transport
Type
Indianapolis
Hialeah
Amtrak stations
1
0
Amtrak stations nearby
1
3
FAA registered aircraft
739
47
FAA registered aircraft manufacturers and dealers
18
2
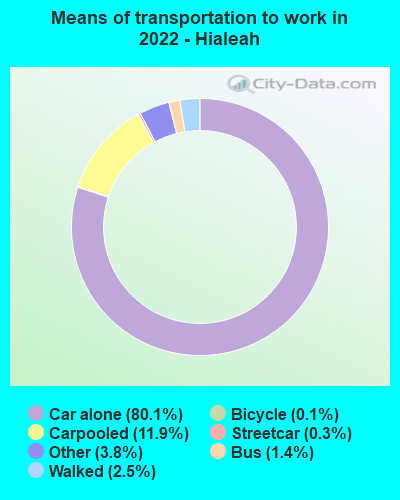
Means of transportation to work
Type
Indianapolis
Hialeah
Bicycle
0.5%
0.1%
Bus
1.2%
1.5%
Carpooled
8.5%
10.2%
Car alone
87.3%
85%
Railroad
0%
0.1%
Subway
0%
0.2%
Walked
1.6%
1.2%
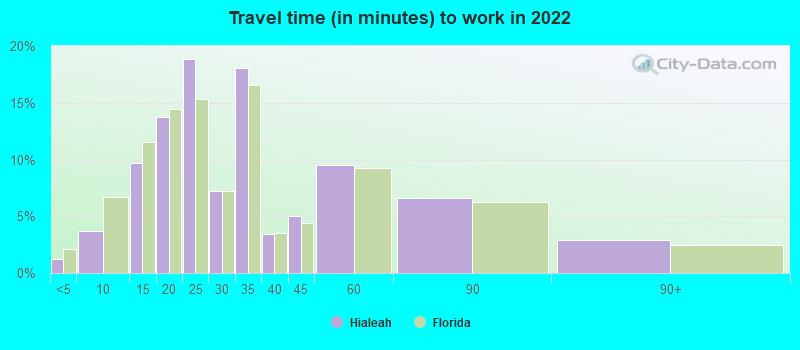
Average travel time to work
Type
Indianapolis
Hialeah
Average
28.1 min
31.1 min
Other means
22.5 min
27.8 min
Public transportation
40.2 min
47.6 min
Private vehicle occupancy
Type
Indianapolis
Hialeah
Average
1.2
1.2
Drove alone
88.2%
88.7%
In 2 person carpool
9.4%
7.4%
In 3 person carpool
1.3%
0.6%
In 4 person carpool
0.5%
1.4%
In 5-6 person carpool
0.4%
1.6%
In 7+ person carpool
0.1%
0.2%
How many people usually rode to work in the car, truck or van.
Real Estate
Home prices in Indianapolis remain affordable compared to the national average with opportunities for downtown living and suburban lifestyles. In contrast, real estate in Hialeah is expensive, commensurate with a Florida city in the Miami metropolitan area, and options are more limited due to the city's size.
Neighborhoods
Indianapolis offers a diverse range of neighborhoods, each with their distinct community vibes, from the hipster Broad Ripple to the family-friendly Carmel. Meanwhile, Hialeah is more homogenous concerning neighborhoods, with most areas reflecting the city's characteristic dense, urban feel, but each still offering its unique Latin flavor.
Houses and residents
Type
Indianapolis
Hialeah
Houses
399,820
78,076
Average household size (people)
2.4
3.1
Median year apartment built
1977
1975
Median year house/condo built
1971
1973
Length of stay in the house since moving in
13 years
15.4 years
Houses occupied
358,150 (89.6%)
75,692 (96.9%)
Houses occupied by owners
201,149 (56.2%)
35,676 (47.1%)
Houses occupied by renters
157,001 (43.8%)
40,016 (52.9%)
Median rent asked for vacant for-rent units
$876.58
$712.50
Median monthly housing costs
$980
$1,239
Median price asked for vacant for-sale houses and condos
$283,027
$578,978
Estimated median house or condo value
$188,700
$324,000
Median numbers of rooms
5.5
4.4
Median number of rooms in apartments
4.3
3.9
Median number of rooms in houses and condos
6.5
5.2
Median house price - detached houses
$231,490
$353,442
Median house price - in 2-unit structures
$257,253
$207,624
Median house price - in 3-to-4-unit structures
$240,688
$218,498
Median house price - in 5 or more unit structures
$247,275
$239,263
Median house price - mobile homes
$58,413
$433,672
Median house price - Townhouses or other attached units
$222,424
$285,621
Median house price - All housing units
$229,666
$317,773
Median house age
48
46
Renting percentage
44.2%
49.4%
Housing density (houses/condos per square mile)
1,106.1
4,057.7
House value disparities
36.1%
24.8%
Household income disparities
44.4%
45.8%
Median household income for houses/condes with a mortgage
$86,008
$64,386
Median household income for apartments without a mortgage
$61,922
$44,969
Housing units without a mortgage
4,552 (3.2%)
436 (2.3%)
Housing units with both a second mortgage and home equity loan
9,787 (6.8%)
756 (4%)
Housing units with a mortgage
138,622 (96.8%)
18,412 (97.7%)
Housing units with a home equity loan
271 (0.2%)
53 (0.3%)
Housing units with a second mortgage
12,987 (9.1%)
850 (4.5%)
House/condo owner moved in on average (years ago)
11
15
House/condo renter moved in on average (years ago)
1
3
Housing units lacking complete kitchen facilities
3.4%
2.1%
Housing units lacking complete plumbing facilities
1.1%
1.1%
Housing units in structures
Housing units in structures
Indianapolis
Hialeah
One, detached
59.0%
39.3%
One, attached
9.2%
9.0%
Two
2.5%
1.3%
3 or 4
6.2%
6.5%
5 to 9
7.7%
8.2%
10 to 19
6.3%
5.7%
20 to 49
3.1%
14.4%
50 or more
5.0%
15.1%
Mobile homes
1.0%
0.5%
Boats, RVs, vans, etc.
0.0%
0.1%
Median real estate property taxes paid for housing units
Self-employed workers in own not incorporated business
17,131
14,316
State government workers
15,502
1,118
Unpaid family workers
1,601
379
Industries and Occupations
Indianapolis is home to several major corporations, including Eli Lilly and Anthem Inc, and has a strong manufacturing sector. In contrast, Hialeah's economy includes healthcare, education, and retail occupations with many residents working in nearby Miami.
Healthcare in Indianapolis is ranked among the best in the nation, with Indiana University Health system leading the sector. In Hialeah healthcare is also easily accessible, with Palmetto General Hospital being the key provider.
Health (county statistics)
Type
Indianapolis
Hialeah
General health status score of residents in this county from 1 (poor) to 5 (excellent)
Indianapolis boasts solid infrastructure, with reliable public services and organized city planning. Hialeah also has established infrastructure but struggles with traffic congestion given its densely populated nature and proximity to Miami.
Infrastructure
Type
Indianapolis
Hialeah
Hospitals
76
6
TV stations
19
27
Bank branches located here
259
53
Bank institutions located here
27
22
Main business address for public companies
28
2
Drinking water stations with no reported violations in the past
1
1
Drinking water stations with reported violations in the past
HMDA - Conventional home purchase loans - Applications denied
Year
Indianapolis
Hialeah
1999
3,358
0
2000
3,562
267
2001
2,649
265
2002
1,915
244
2003
2,519
696
2004
3,702
983
2005
6,057
1,502
2006
5,811
2,294
2007
3,456
1,204
2008
1,247
319
2009
565
73
Culture and Food
Indianapolis offers a diverse cultural scene, including renowned museums, music festivals, and a burgeoning food scene that stretches from international cuisine to hearty midwestern fare. Hialeah is a mosaic of Latin culture reflected in its food, music, and festivals, with a culinary scene dominated by Cuban and other Latin cuisines.
Sports Teams
Sports play a significant role in Indianapolis with professional teams like the Indianapolis Colts (NFL) and Indiana Pacers (NBA), and events such as the annual Indianapolis 500. Hialeah does not have its sports teams but is in close proximity to Miami, which hosts the Miami Heat (NBA), Miami Dolphins (NFL), and Miami Marlins (MLB).


 Indianapolis, IN and
  Hialeah, FL : 1,020.1 miles