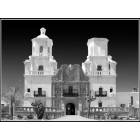
Houston, Texas, and Tucson, Arizona, offer unique experiences for residents and visitors. While Houston is known as a multicultural metropolis and the epicenter for the oil and gas industry, Tucson shines with its sunny weather, spectacular desert landscapes, and Mexican-American cultural heritage. This comparison will address crucial aspects such as crime/safety, weather, cost of living, and many more to provide an encompassing look at life in both cities.
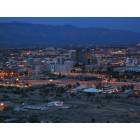
Distance between
Houston, TX and
Tucson, AZ : 934.7 miles
Houston's population is larger by 321%. Its population has grown by 334,619 people (17.1%) since 2000. The population of Tucson has grown by 56,543 people (11.6%) during that time.
In regards to crime and safety, Tucson slightly surpasses Houston with a lower crime rate. Houston has a higher crime rate compared to the national average, mainly driven by property crimes. Tucson also faces challenges with property crimes but to a lesser extent than Houston. Both cities have initiated various law enforcement programs to improve safety, but it's important to research specific neighborhoods before moving or visiting.
City-data.com crime index counts serious crimes and violent crime more heavily. It adjusts for the number of visitors and daily workers commuting into cities. (higher means more crime, U.S. average = 301.1)
City-data.com crime index counts serious crimes and violent crime more heavily. It adjusts for the number of visitors and daily workers commuting into cities. (higher means more crime, U.S. average = 301.1)
Sex Offenders
According to our data, there are 7,869 registered sex offenders living in Houston and 1,389 registered sex offenders living in . The ratio of residents to sex offenders in Houston is 293 to 1; the ratio in Tucson is 382 to 1. The number of registered sex offenders compared to the number of residents is larger in Houston than in Tucson.
Cost of Living
In terms of cost of living, Tucson comes out ahead with an overall lower cost of living compared to Houston, primarily due to lower housing costs. Groceries, health care, and transportation also tend to be less expensive in Tucson than in Houston. Both cities, however, are generally more affordable than other major US cities.
Income Tax
In terms of income tax, Texas, and by extension Houston, has no state income tax, making it more advantageous for high earners. On the other hand, Arizona has a progressive income tax structure, and residents of Tucson need to pay both state and city income taxes.
Property Tax
Property tax rates vary widely across different areas in both cities, but they're generally higher in Houston, due to the lack of a state income tax in Texas. However, Tucson residents still face a relatively high property tax rate compared to the national average.
Sales Tax
The combined sales tax rate is higher in Houston than in Tucson. Texas has a higher state sales tax rate than Arizona, and this, coupled with the additional local sales taxes in Houston, results in a higher overall rate compared to Tucson.
Income
Type
Houston
Tucson
Estimated median household income
$55,499
$50,306
Estimated per capita income
$36,265
$27,821
Cost of living index (U.S. average is 100)
97.2
90.1
If you make $50,000 in Tucson, you will have to make $53,940 in Houston to maintain the same standard of living.
Geographical Conditions
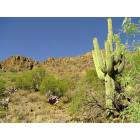
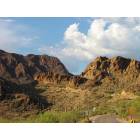
While Houston is flat and located near the coast, Tucson is surrounded by five minor ranges of mountains. Tucson's scenic landscapes and outdoor recreational opportunities are potentially more attractive for nature enthusiasts.
Both Houston and Tucson offer a selection of highly-rated public schools and universities. Houston is home to prestigious institutions like Rice University, while Tucson houses the well-regarded University of Arizona. In general, the student to teacher ratio is better in Tucson than in Houston, which might make Tucson more attractive to families.
Houston's economy is diverse with strong sectors in energy, aeronautics, and healthcare. In Tucson, the economy is skewed towards education, healthcare, and the military. While Houston generally provides more high-paying job opportunities owing to its economic diversification, Tucson's developing tech scene and significant aerospace sector can provide competitive job opportunities too.
Biggest Employers
Houston's biggest employers include The Texas Medical Center, Houston Independent School District, and energy giants like ExxonMobil and Shell. Tucson's economic landscape is quite different, with the University of Arizona, Raytheon Technologies, and the Davis-Monthan Air Force Base among the largest employers.
There were 7,146 building permits issued in Houston in 2012 (4571 more than in 2011) compared to 1,134 building permits issued in Tucson in 2012 (832 more than in 2011).
In Houston (Harris County), 49.4% voted for Democrats and 49.3% for Republicans in 2012 Presidential Election. In Tucson (Pima County), 52.7% voted for Democrats and 45.7% for Republicans.
Elections
Type
Democrats
Republicans
Other
Year
Houston
Tucson
Houston
Tucson
Houston
Tucson
2020
56.0%
58.4%
42.7%
39.8%
1.3%
1.7%
2016
54.0%
53.3%
41.6%
39.7%
4.4%
7.0%
2012
49.4%
52.7%
49.3%
45.7%
1.3%
1.6%
2008
50.5%
52.4%
48.9%
46.3%
0.6%
1.4%
2004
44.6%
52.7%
54.9%
46.7%
0.5%
0.6%
2000
43.0%
51.4%
54.4%
43.3%
2.6%
5.3%
1996
45.2%
52.2%
49.2%
39.4%
5.6%
8.5%
Breakdown of population affiliated with a religious congregation
Type
Adherents
Congregations
Religion
Houston
Tucson
Houston
Tucson
CATHOLIC CHURCH
18.1%
20.8%
3.6%
7.9%
SOUTHERN BAPTIST CONVENTION
14.2%
2.3%
26.8%
10.4%
MUSLIM ESTIMATE
2.9%
0.0%
1.6%
0.2%
EPISCOPAL CHURCH
1.0%
0.8%
1.4%
1.4%
LUTHERAN CHURCH
0.7%
0.4%
1.5%
1.4%
EVANGELICAL LUTHERAN CHURCH IN AMERICA
0.3%
0.9%
1.1%
2.5%
SEVENTH DAY ADVENTIST CHURCH
0.3%
0.3%
1.7%
1.9%
Weather
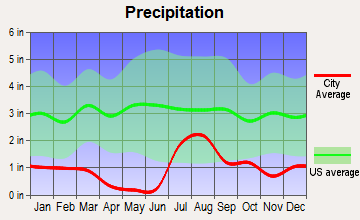
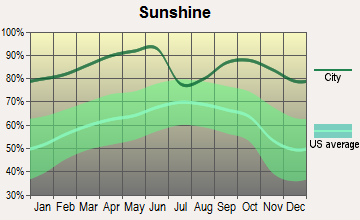
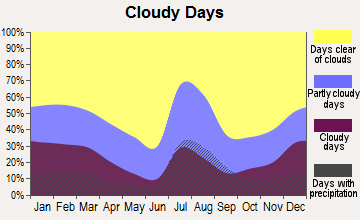
Houston typically experiences a warm climate with summers that are hot and humid. In contrast, Tucson has a desert climate characterized by very hot summers and mild winters. Tucson also receives more sunlight hours annually, making it a popular destination for those seeking year-round sunshine. Conversely, Houston's proximity to the Gulf of Mexico makes it susceptible to hurricanes.
Weather and climate
Type
Houston
Tucson
Temperature - Average
69.7°F
70°F
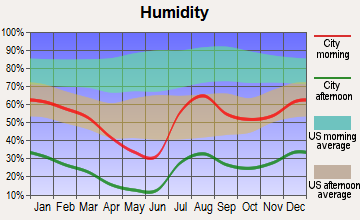
Humidity - Average morning or afternoon humidity
80.3%
38.6%
Humidity - Differences between morning and afternoon humidity
36.7%
46%
Humidity - Maximum monthly morning or afternoon humidity
92.8%
58%
Humidity - Minimum monthly morning or afternoon humidity
56.1%
12%
Precipitation - Yearly average
52.9 in
12 in
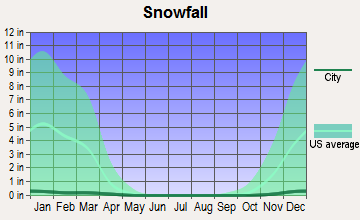
Snowfall - Yearly average
0.6 in
2 in
Clouds - Number of days clear of clouds
15%
32.3%
Sunshine amount - Average
60.4%
92.8%
Sunshine amount - Differences during a year
24%
15%
Sunshine amount - Maximum monthly
67%
94%
Sunshine amount - Minimum monthly
43%
79%
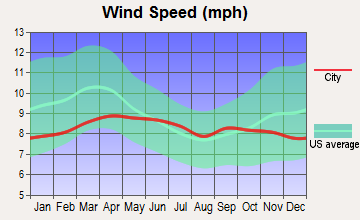
Wind speed - Average
8.2 mph
8.3 mph
Average climate in Houston, Texas
Average climate in Tucson, Arizona
Air pollution
Type
AQI
CO
NO2
OZONE
PB
PM10
PM25
SO2
Year
Houston
Tucson
Houston
Tucson
Houston
Tucson
Houston
Tucson
Houston
Tucson
Houston
Tucson
Houston
Tucson
2018
102
87
0.19
0.19
9.2
8.3
21.5
32.0
N/A
N/A
29.9
N/A
10.0
5.5
0.3
0.1
2017
96
73
0.16
0.18
9.4
8.4
23.1
31.7
N/A
N/A
32.2
N/A
9.1
7.1
0.3
0.1
2016
91
68
0.16
0.21
10.4
7.9
22.7
29.7
N/A
N/A
25.3
N/A
8.6
4.5
0.2
0.1
2015
109
62
0.15
0.21
10.1
8.7
21.7
29.7
N/A
N/A
25.4
N/A
9.9
5.1
0.2
0.2
2014
98
74
0.24
0.19
10.4
10.0
21.8
28.8
N/A
N/A
28.0
N/A
10.2
5.6
0.3
0.2
2013
106
94
0.25
0.17
11.1
10.4
23.0
30.4
N/A
N/A
30.9
N/A
10.6
6.8
0.4
0.2
2012
115
73
0.25
0.20
11.6
11.8
23.8
30.0
N/A
N/A
31.2
N/A
11.1
5.6
0.5
0.2
2011
118
81
0.27
0.22
10.8
11.9
24.6
31.0
N/A
N/A
29.7
N/A
11.5
5.8
0.8
0.3
2010
110
68
0.25
0.29
12.8
10.8
22.8
30.5
N/A
N/A
25.5
N/A
11.4
N/A
1.1
0.5
2009
115
82
0.21
0.25
10.5
11.2
22.1
29.2
N/A
N/A
31.9
N/A
11.4
N/A
1.0
0.5
2008
105
81
0.30
0.29
13.1
12.2
22.1
29.2
0.006
N/A
32.0
N/A
12.4
N/A
1.3
0.9
2007
119
75
0.31
0.37
15.2
13.4
20.5
28.7
0.006
N/A
27.3
N/A
13.5
N/A
1.9
0.9
2006
134
74
0.32
0.41
14.6
15.3
22.3
27.7
0.006
N/A
17.3
N/A
13.0
N/A
2.3
0.6
2005
126
76
0.42
0.43
16.3
15.1
22.8
26.0
0.005
N/A
17.8
N/A
13.9
N/A
3.5
0.7
2004
137
77
0.44
0.49
17.7
15.6
20.4
25.6
0.010
N/A
14.0
N/A
N/A
N/A
3.2
1.2
2003
146
81
0.62
0.57
17.0
17.2
20.9
27.1
0.009
N/A
19.2
N/A
N/A
N/A
3.2
1.2
2002
128
76
0.55
0.56
16.1
16.9
19.7
26.8
0.007
N/A
19.9
N/A
N/A
N/A
1.7
1.0
2001
147
70
0.44
0.55
18.4
16.4
19.6
26.1
0.008
N/A
23.2
N/A
N/A
N/A
2.5
0.8
2000
136
78
0.50
0.50
17.0
16.7
22.0
26.4
0.008
N/A
N/A
N/A
N/A
N/A
3.1
2.3
Natural disasters
Type
Houston
Tucson
Tornado activity compared to U.S. average
187.3%
8.9%
Earthquake activity compared to U.S. average
63.9%
1,584.9%
Natural disasters compared to U.S. average
32%
13%
Transportation
Public transit in Houston is relatively developed, with a light rail system and comprehensive bus network. Conversely, Tucson's public transit primarily consists of a bus network, but plans are underway to develop more transportation modes. Houston's commute times are typically longer due to its size and traffic.
Transport
Type
Houston
Tucson
Amtrak stations
1
1
Amtrak stations nearby
2
1
FAA registered aircraft
1
983
FAA registered aircraft manufacturers and dealers
44
14
Means of transportation to work
Type
Houston
Tucson
Bicycle
0.5%
1%
Bus
2.4%
1.9%
Carpooled
11.1%
11.5%
Car alone
81.2%
81.9%
Motorcycle
0.1%
0.5%
Railroad
0.1%
0%
Taxicab
0.1%
0.1%
Walked
1.6%
2.3%
Average travel time to work
Type
Houston
Tucson
Average
32 min
26 min
Other means
27.1 min
21.6 min
Public transportation
47.6 min
42.5 min
Private vehicle occupancy
Type
Houston
Tucson
Average
1.2
1.2
Drove alone
86.4%
86.3%
In 2 person carpool
9.7%
10.1%
In 3 person carpool
2.4%
2.5%
In 4 person carpool
0.9%
1%
In 5-6 person carpool
0.4%
0.1%
In 7+ person carpool
0.3%
0.1%
How many people usually rode to work in the car, truck or van.
Real Estate
Home prices and rents are generally higher in Houston compared to Tucson. However, Houston has a broader range of housing options from skyscraper apartments to suburban homes. Tucson's real estate market mainly consists of single-family homes and provides a more affordable entry point for home ownership.
Neighborhoods
Both cities offer a mix of neighborhoods that cater to different demographic groups. Houston is characterized by its variety of residential areas such as upscale River Oaks, family-friendly Spring Branch, and trendy Montrose. Tucson also offers a diverse mix of neighborhoods, from the historic El Presidio to the university-centric Sam Hughes.
Houses and residents
Type
Houston
Tucson
Houses
1,028,763
242,816
Average household size (people)
2.6
2.4
Median year apartment built
1985
1979
Median year house/condo built
1976
1978
Length of stay in the house since moving in
14.4 years
13.2 years
Houses occupied
924,981 (89.9%)
223,068 (91.9%)
Houses occupied by owners
390,226 (42.2%)
114,708 (51.4%)
Houses occupied by renters
534,755 (57.8%)
108,360 (48.6%)
Median rent asked for vacant for-rent units
$1,323
$801.80
Median monthly housing costs
$1,134
$951
Median price asked for vacant for-sale houses and condos
$334,556
$557,132
Estimated median house or condo value
$236,700
$224,800
Median numbers of rooms
4.4
4.9
Median number of rooms in apartments
3.5
4
Median number of rooms in houses and condos
6.1
5.8
Median house price - detached houses
$348,048
$262,219
Median house price - in 2-unit structures
$232,228
$147,793
Median house price - in 3-to-4-unit structures
$205,330
$125,313
Median house price - in 5 or more unit structures
$297,061
$135,055
Median house price - mobile homes
$68,903
$48,136
Median house price - occupied boats, rvs, vans etc.
$50,694
$53,411
Median house price - Townhouses or other attached units
$299,072
$210,375
Median house price - All housing units
$337,365
$234,849
Median house age
40
43
Renting percentage
54.6%
48.1%
Housing density (houses/condos per square mile)
1,775.5
1,247.3
House value disparities
40.9%
32.8%
Household income disparities
49%
44.9%
Median household income for houses/condes with a mortgage
$109,539
$76,356
Median household income for apartments without a mortgage
$65,707
$54,612
Housing units without a mortgage
4,386 (2.1%)
1,087 (1.5%)
Housing units with both a second mortgage and home equity loan
7,696 (3.6%)
2,785 (3.9%)
Housing units with a mortgage
207,809 (97.9%)
70,054 (98.5%)
Housing units with a home equity loan
421 (0.2%)
211 (0.3%)
Housing units with a second mortgage
11,969 (5.6%)
4,051 (5.7%)
House/condo owner moved in on average (years ago)
13
11
House/condo renter moved in on average (years ago)
1
1
Housing units lacking complete kitchen facilities
2.4%
1.2%
Housing units lacking complete plumbing facilities
1.5%
0.8%
Housing units in structures
Housing units in structures
Houston
Tucson
One, detached
43.2%
53.5%
One, attached
4.8%
8.3%
Two
2.2%
2.5%
3 or 4
4.4%
4.3%
5 to 9
7.1%
5.0%
10 to 19
10.9%
5.6%
20 to 49
7.7%
5.8%
50 or more
18.6%
8.6%
Mobile homes
0.9%
6.2%
Boats, RVs, vans, etc.
0.1%
0.2%
Median real estate property taxes paid for housing units
Self-employed workers in own not incorporated business
75,956
14,487
State government workers
38,359
17,981
Unpaid family workers
2,429
709
Industries and Occupations
Houston is widely known for its robust oil, aeronautics, and healthcare industries. In contrast, Tucson is more famous for education, tourism, and its growing technology and aerospace industries. Most jobs in Houston are in management, business, science, and arts, while Tucson's major occupations center around service, sales, and office jobs.
Houston shines in this category with the Texas Medical Center, the largest medical center globally, offering world-class healthcare. Tucson, while lacking such a large healthcare hub, still provides quality healthcare with several reputable hospitals.
Health (county statistics)
Type
Houston
Tucson
General health status score of residents in this county from 1 (poor) to 5 (excellent)
Houston, being the fourth largest city in the U.S., boasts impressive infrastructure with many skyscrapers, advanced highways, and large airports. In contrast, Tucson’s infrastructure is smaller and less developed, but it is improving with plans to expand its airport and downtown revitalization efforts in place.
Infrastructure
Type
Houston
Tucson
Hospitals
156
24
TV stations
26
20
Arenas or stadiums
6
2
Bank branches located here
755
159
Bank institutions located here
81
17
Main business address for public companies
197
6
Drinking water stations with no reported violations in the past
49
0
Drinking water stations with reported violations in the past
HMDA - Conventional home purchase loans - Applications denied
Year
Houston
Tucson
1999
9,163
3,131
2000
0
1,601
2001
0
912
2002
0
778
2003
8,173
1,409
2004
11,803
2,041
2005
15,127
2,872
2006
16,911
2,833
2007
10,643
1,601
2008
4,410
714
2009
2,279
386
Culture and Food
Houston takes pride in its diverse food scene, influenced by its multicultural population. At the same time, Tucson, a UNESCO City of Gastronomy, is known for its Mexican-American cuisine. Both cities offer a rich cultural scene with museums, festivals, and performing arts venues, but Houston's cultural offerings are more diverse due to its larger size and more diverse population.
Sports Teams
Houston sports enthusiasts can cheer for a range of professional teams, including the Houston Texans (NFL), Houston Astros (MLB), and Houston Rockets (NBA). In contrast, Tucson does not have any major professional sports teams but boasts a passionate fan base for the University of Arizona's NCAA teams.


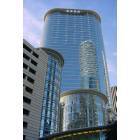
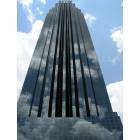
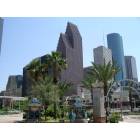


 Houston, TX
 Tucson, AZ