When comparing Houston, TX with Manhattan, NY, many factors like safety, weather, cost of living, and job opportunities are critical for those considering moving or just visiting. Each city offers distinct lifestyles, economic prospects, and cultural experiences. While Houston is appreciated for its lower cost of living and diverse economy, Manhattan is known for its bustling city life, attractive job market, and rich cultural scene. Let's delve into the nuances of each aspect to draw a detailed comparison.
When it comes to safety, both cities have their own challenges. While Houston has a higher crime rate overall compared to the US average, Manhattan's crime rate is lower than the NYC average but higher than some major US cities. Both places have set initiatives to reduce crime, but it's important for residents and tourists to take individual precautions depending on the neighborhood.
Cost of Living
When it comes to the cost of living, Houston is significantly less expensive than Manhattan. This is particularly tangible in housing prices. For those looking to relocate, it is easier to own a home in Houston. Everyday expenses, such as groceries and transportation, are also generally cheaper in Houston.
Income Tax
Texas, including Houston, has no state income tax, which is a significant benefit for residents. Manhattan, on the other hand, is subject to New York State and City income taxes, which can be quite high in comparison.
Property Tax
Property taxes differ markedly. Houston's property tax rates are higher than Manhattan's. However, considering real estate prices, the total amount paid may still be lower in Houston due to its comparatively cheaper real estate.
Sales Tax
Sales tax in Houston is 8.25%, while Manhattan imposes a steep tax of 8.875%. This difference may impact the cost of goods and services in each location.
Income
Type
Houston
Manhattan
Estimated median household income
$55,499
$84,435
Estimated per capita income
$36,265
$76,589
Cost of living index (U.S. average is 100)
97.2
185.3
If you make $50,000 in Houston, you will have to make $95,319 in Manhattan to maintain the same standard of living.
Geographical Conditions
Houston is mostly flat and prone to flooding. Manhattan, being an island, is surrounded by the East, Hudson, and Harlem rivers, with Central Park offering a significant green space.
Geographical information
Type
Houston
Manhattan
Land area
579.4 sq. miles
23 sq. miles
Population density
3,949.2 people per sq. mile
70,629 people per sq. mile
Relative area comparison
Houston, TX Manhattan, NY
Education
Both cities have a great education system with prestigious public and private schools. Houston is home to the renowned Rice University while Manhattan boasts colleges like Columbia University and New York University. Each city offers a host of educational opportunities for continued learning beyond school.
Houston's economy is fueled by the energy industry, with a focus on oil and gas. In contrast, Manhattan's economy is a diverse mix of finance, fashion, media, and tech sectors. The job market in both cities is strong but mainly depends on your field of expertise.
Biggest Employers
In Houston, the biggest employers are the Texas Medical Center and ExxonMobil. For Manhattan, it's JPMorgan Chase and Citigroup. Both places offer varied job opportunities with some of the most significant players in their respective industries.
In Houston (Harris County), 49.4% voted for Democrats and 49.3% for Republicans in 2012 Presidential Election. In Manhattan (New York County), 83.9% voted for Democrats and 14.9% for Republicans.
Elections
Type
Democrats
Republicans
Other
Year
Houston
Manhattan
Houston
Manhattan
Houston
Manhattan
2020
56.0%
86.5%
42.7%
12.2%
1.3%
1.2%
2016
54.0%
86.7%
41.6%
9.7%
4.4%
3.6%
2012
49.4%
83.9%
49.3%
14.9%
1.3%
1.2%
2008
50.5%
86.1%
48.9%
13.5%
0.6%
0.3%
2004
44.6%
82.3%
54.9%
16.8%
0.5%
0.9%
2000
43.0%
80.0%
54.4%
14.5%
2.6%
5.5%
1996
45.2%
80.0%
49.2%
13.8%
5.6%
6.3%
Breakdown of population affiliated with a religious congregation
Type
Adherents
Congregations
Religion
Houston
Manhattan
Houston
Manhattan
CATHOLIC CHURCH
18.1%
20.4%
3.6%
12.6%
SOUTHERN BAPTIST CONVENTION
14.2%
0.2%
26.8%
2.9%
MUSLIM ESTIMATE
2.9%
2.7%
1.6%
2.4%
EPISCOPAL CHURCH
1.0%
1.7%
1.4%
5.3%
LUTHERAN CHURCH
0.7%
0.0%
1.5%
0.6%
SEVENTH DAY ADVENTIST CHURCH
0.3%
0.3%
1.7%
2.4%
AMERICAN BAPTIST CHURCHES IN THE USA
0.0%
1.6%
0.1%
4.7%
PATRIAR PARISHE RUSSIAN ORTHODO CHURCH USA
0.0%
0.4%
0.0%
0.2%
Weather
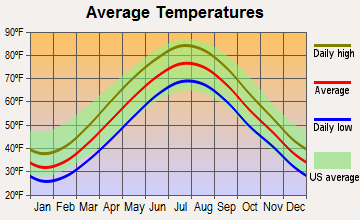
Weather is quite contrasting between these two places. Houston falls in a subtropical region, experiencing hot, humid summers and mild winters. On the other hand, in Manhattan, there are four distinct seasons with hot, humid summers and freezing winters. Manhattan's weather is quite unpredictable.
Weather and climate
Type
Houston
Manhattan
Temperature - Average
69.7°F
54.6°F
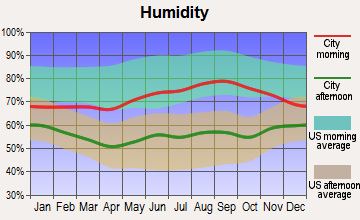
Humidity - Average morning or afternoon humidity
80.3%
67.4%
Humidity - Differences between morning and afternoon humidity
36.7%
30%
Humidity - Maximum monthly morning or afternoon humidity
92.8%
77%
Humidity - Minimum monthly morning or afternoon humidity
56.1%
47%
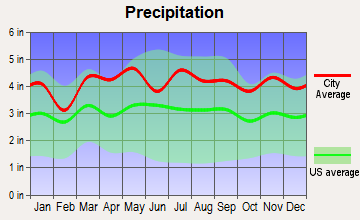
Precipitation - Yearly average
52.9 in
49.6 in
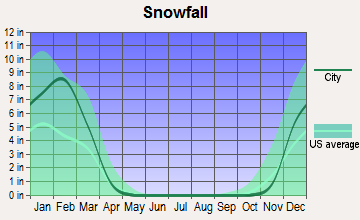
Snowfall - Yearly average
0.6 in
57.4 in
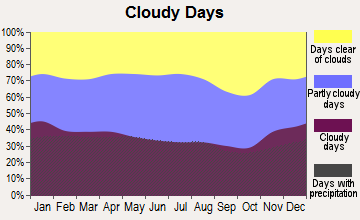
Clouds - Number of days clear of clouds
15%
17.8%
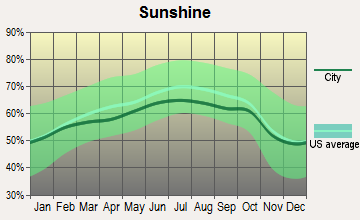
Sunshine amount - Average
60.4%
60.2%
Sunshine amount - Differences during a year
24%
20%
Sunshine amount - Maximum monthly
67%
64%
Sunshine amount - Minimum monthly
43%
44%
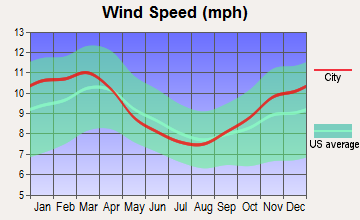
Wind speed - Average
8.2 mph
6.7 mph
Average climate in Houston, Texas
Average climate in Manhattan, New York
Air pollution
Type
AQI
CO
NO2
OZONE
PB
PM10
PM25
SO2
Year
Houston
Manhattan
Houston
Manhattan
Houston
Manhattan
Houston
Manhattan
Houston
Manhattan
Manhattan
Houston
Manhattan
Houston
Manhattan
2018
102
94
0.19
0.29
9.2
17.3
21.5
23.9
N/A
N/A
N/A
N/A
10.0
7.9
0.3
0.5
2017
96
97
0.16
0.16
9.4
17.4
23.1
24.0
N/A
N/A
N/A
N/A
9.1
7.7
0.3
0.4
2016
91
94
0.16
0.28
10.4
18.1
22.7
24.2
N/A
N/A
N/A
N/A
8.6
7.7
0.2
0.6
2015
109
100
0.15
0.36
10.1
18.9
21.7
23.0
N/A
N/A
N/A
N/A
9.9
8.6
0.2
1.0
2014
98
95
0.24
0.40
10.4
19.1
21.8
22.3
N/A
N/A
N/A
N/A
10.2
8.3
0.3
1.1
2013
106
97
0.25
0.43
11.1
19.5
23.0
22.6
N/A
N/A
N/A
N/A
10.6
9.0
0.4
1.1
2012
115
99
0.25
0.46
11.6
18.6
23.8
23.4
N/A
N/A
N/A
N/A
11.1
9.3
0.5
1.7
2011
118
108
0.27
0.46
10.8
20.7
24.6
22.2
N/A
N/A
N/A
N/A
11.5
10.9
0.8
2.7
2010
110
113
0.25
0.45
12.8
19.3
22.8
23.3
N/A
N/A
N/A
N/A
11.4
10.4
1.1
2.7
2009
115
104
0.21
0.51
10.5
21.9
22.1
18.8
N/A
N/A
N/A
N/A
11.4
10.7
1.0
3.8
2008
105
110
0.30
0.49
13.1
23.0
22.1
19.8
0.006
0.013
N/A
N/A
12.4
12.3
1.3
4.6
2007
119
121
0.31
0.56
15.2
24.4
20.5
19.4
0.006
0.016
N/A
N/A
13.5
13.1
1.9
5.5
2006
134
116
0.32
0.64
14.6
24.6
22.3
18.9
0.006
0.018
N/A
N/A
13.0
12.9
2.3
6.5
2005
126
112
0.42
0.77
16.3
26.7
22.8
18.4
0.005
N/A
N/A
N/A
13.9
N/A
3.5
8.2
2004
137
108
0.44
0.77
17.7
26.7
20.4
17.3
0.010
0.030
N/A
N/A
N/A
N/A
3.2
8.0
2003
146
107
0.62
0.83
17.0
27.8
20.9
17.5
0.009
0.024
26.9
N/A
N/A
N/A
3.2
8.2
2002
128
122
0.55
0.78
16.1
27.9
19.7
18.7
0.007
0.008
25.9
N/A
N/A
N/A
1.7
7.3
2001
147
123
0.44
0.79
18.4
29.4
19.6
19.4
0.008
0.020
25.0
N/A
N/A
N/A
2.5
8.7
2000
136
115
0.50
0.90
17.0
30.2
22.0
15.0
0.008
0.022
22.2
N/A
N/A
N/A
3.1
8.4
Natural disasters
Type
Houston
Manhattan
Tornado activity compared to U.S. average
187.3%
59.1%
Earthquake activity compared to U.S. average
63.9%
31.1%
Natural disasters compared to U.S. average
32%
18%
Transportation
Manhattan boasts an extensive public transit system, including subways and buses, promoting car-free commuting. Houston, despite having a public transit system, is much more car-dependent given its spread-out nature.
Transport
Type
Houston
Manhattan
Amtrak stations
1
0
Amtrak stations nearby
2
3
FAA registered aircraft
1
2
FAA registered aircraft manufacturers and dealers
44
0
Means of transportation to work
Type
Houston
Manhattan
Bicycle
0.5%
0.9%
Bus
2.4%
10.1%
Carpooled
11.1%
3.4%
Car alone
81.2%
7.6%
Railroad
0.1%
1.1%
Streetcar
0%
0.1%
Subway
0%
43.6%
Taxicab
0.1%
4.7%
Walked
1.6%
21.9%
Average travel time to work
Type
Houston
Manhattan
Average
32 min
30.3 min
Real Estate
Manhattan, known for its sky-high real estate prices, offers limited space. On the other hand, Houston's real estate is considerably more affordable with greater availability of spacious homes and apartments.
Neighborhoods
Houston's neighborhoods like River Oaks and The Heights offer a perfect blend of urban and suburban feel, while neighborhoods in Manhattan, such as SoHo or Tribeca, provide an intense urban experience buzzing with activity.
Houses and residents
Type
Houston
Manhattan
Houses
1,028,763
798,144
Average household size (people)
2.6
2
Houses occupied
924,981 (89.9%)
738,644 (92.5%)
Houses occupied by owners
390,226 (42.2%)
148,695 (20.1%)
Houses occupied by renters
534,755 (57.8%)
589,949 (79.9%)
Median rent asked for vacant for-rent units
$1,323
$1,690
Median price asked for vacant for-sale houses and condos
$334,556
$3,393,315
Estimated median house or condo value
$236,700
$940,900
Median number of rooms in apartments
3.5
3.2
Median number of rooms in houses and condos
6.1
4
Renting percentage
54.6%
77.2%
Housing density (houses/condos per square mile)
1,775.5
34,757
Household income disparities
49%
47.8%
Housing units without a mortgage
4,386 (2.1%)
1,104 (40.3%)
Housing units with both a second mortgage and home equity loan
7,696 (3.6%)
13 (0.5%)
Housing units with a mortgage
207,809 (97.9%)
1,636 (59.7%)
Housing units with a home equity loan
421 (0.2%)
140 (5.1%)
Housing units with a second mortgage
11,969 (5.6%)
140 (5.1%)
Housing units lacking complete kitchen facilities
2.4%
2%
Housing units lacking complete plumbing facilities
Self-employed workers in own not incorporated business
75,956
69,517
State government workers
38,359
15,544
Unpaid family workers
2,429
1,861
Industries and Occupations
Major industries in Houston include energy, healthcare, and aeronautics. Manhattan is the hub of finance, fashion, legal services, media, advertising, and technology. Job seekers can find numerous opportunities in both cities, given they are in line with dominant local industries.
Both cities have excellent healthcare facilities. Houston is known for its Texas Medical Centre, the largest medical complex in the world. Manhattan offers top-notch healthcare establishments like the NYU Langone Health and Mount Sinai Hospital.
Health (county statistics)
Type
Houston
Manhattan
General health status score of residents in this county from 1 (poor) to 5 (excellent)
Houston tends to have more suburban areas with homes possessing yards and garages. Manhattan, with its high-rise buildings, offers a true urban city vibe. The infrastructure in both cities caters to their respective demands well, providing ample facilities for recreation, work, and living.
Infrastructure
Type
Houston
Manhattan
TV stations
26
30
Culture and Food
Both Houston and Manhattan have rich, diverse cultures mirrored in their arts scenes and eateries. Houston's food scene is known for its Tex-Mex and BBQ, while Manhattan is famous for diverse global cuisines and Michelin star restaurants.
Sports Teams
Sports fans have lots to cheer in both cities. Houston has the Texans (NFL), Rockets (NBA), and Astros (MLB). Manhattan is home to iconic teams, including the Knicks (NBA), Yankees (MLB), and Rangers (NHL).


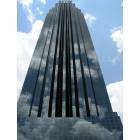
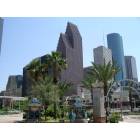


 Houston, TX
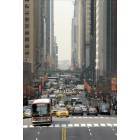
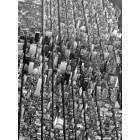
 Manhattan, NY