Houston, Texas, and Atlanta, Georgia, are two bustling cities in the United States with distinct personalities. Houston, as the fourth-largest city in the U.S., has a strong economy largely influenced by its energy industry and a diverse food culture, while Atlanta is the cultural and economic center of the peach state with thriving arts scenes and renowned higher education institutions. This comparison examines the specifics of their crime rates, cost of living, weather, education, economy, infrastructure, tax situation and various other factors that influence life quality and appeal for both residential relocations and tourism.
Distance between
Houston, TX and
Atlanta, GA : 701.1 miles
Houston's population is larger by 361%. Its population has grown by 334,619 people (17.1%) since 2000. The population of Atlanta has grown by 79,987 people (19.2%) during that time.
Both Atlanta and Houston unfortunately have crime rates larger than the U.S. average. Atlanta's crime rate is especially high, particularly for property crimes. In contrast, Houston's overall crime rate is just slightly above the U.S. average, with a similar rate for property crimes. Both cities have been investing heavily in maintaining public safety and infrastructural security. Each city has their own safer neighborhoods, warranting diligent research for prospective renters or homebuyers.
City-data.com crime index counts serious crimes and violent crime more heavily. It adjusts for the number of visitors and daily workers commuting into cities. (higher means more crime, U.S. average = 301.1)
City-data.com crime index counts serious crimes and violent crime more heavily. It adjusts for the number of visitors and daily workers commuting into cities. (higher means more crime, U.S. average = 301.1)
Sex Offenders
According to our data, there are 7,869 registered sex offenders living in Houston and 1,974 registered sex offenders living in . The ratio of residents to sex offenders in Houston is 293 to 1; the ratio in Atlanta is 239 to 1. The number of registered sex offenders compared to the number of residents in Houston is near to than in Atlanta.
Cost of Living
According to the cost of living index, the cost of living in Houston is generally lower than in Atlanta. Housing is the greatest contributor to the cost difference. Food, health, and transportation costs are also moderately lower in Houston compared to Atlanta. Both cities, however, are pricier than the average U.S. city in terms of living costs.
Income Tax
One notable advantage of living in Houston is that Texas has no state income tax. In contrast, Georgia has a progressive state income tax, ranging from 1% to 6% depending on income level.
Property Tax
Property tax rates in Texas are among the highest in the country, which Houston inherits. In contrast, Georgia has more average property tax rates, providing Atlanta with a more moderate housing tax burden.
Sales Tax
Texas has a statewide sales tax rate of 6.25%, which can be augmented by local municipalities, bringing Houston's total to 8.25%. Georgia's state sales tax is 4%, but inclusive of local taxes Atlanta reaches 8.9%.
Income
Type
Houston
Atlanta
Estimated median household income
$55,499
$74,107
Estimated per capita income
$36,265
$55,051
Cost of living index (U.S. average is 100)
97.2
104.3
If you make $50,000 in Houston, you will have to make $53,652 in Atlanta to maintain the same standard of living.
Geographical Conditions
Houston is near the Gulf of Mexico at almost sea level, rendering it susceptible to hurricanes and flooding. Atlanta is situated among rolling hills in the northern part of Georgia, hence significantly further from the coast. It has a higher elevation relieving it from most coastal concerns.
Both cities have quality educational institutions. However, Atlanta is known for its higher education institutions like Georgia Tech and Emory University. Houston's education system is strongest in primary and secondary education with top-rated public and private schools. In terms of public spending on education, both cities are quite similar.
Houston has a strong economy influenced by the oil and gas industry, alongside strong health care, aerospace and import/export sectors. Atlanta’s economy is more diverse, with significant contributions from the media, logistics, professional and business services, Information Technology, and the health care sectors. Both cities claim a lower unemployment rate than the national average.
Biggest Employers
In Houston, some of the biggest employers are energy corporations like Exxon Mobil and Chevron. In Atlanta, the biggest employers include Delta Airlines, Emory University/Emory Healthcare, and The Home Depot.
There were 7,146 building permits issued in Houston in 2012 (4571 more than in 2011) compared to 855 building permits issued in Atlanta in 2012 (628 more than in 2011).
In Houston (Harris County), 49.4% voted for Democrats and 49.3% for Republicans in 2012 Presidential Election. In Atlanta (Fulton County), 64.3% voted for Democrats and 34.5% for Republicans.
Elections
Type
Democrats
Republicans
Other
Year
Houston
Atlanta
Houston
Atlanta
Houston
Atlanta
2020
56.0%
72.6%
42.7%
26.2%
1.3%
1.2%
2016
54.0%
67.8%
41.6%
26.9%
4.4%
5.3%
2012
49.4%
64.3%
49.3%
34.5%
1.3%
1.2%
2008
50.5%
67.2%
48.9%
32.2%
0.6%
0.6%
2004
44.6%
59.4%
54.9%
40.0%
0.5%
0.7%
2000
43.0%
57.9%
54.4%
39.9%
2.6%
2.2%
1996
45.2%
58.9%
49.2%
36.9%
5.6%
4.1%
Breakdown of population affiliated with a religious congregation
Type
Adherents
Congregations
Religion
Houston
Atlanta
Houston
Atlanta
CATHOLIC CHURCH
18.1%
9.9%
3.6%
2.4%
SOUTHERN BAPTIST CONVENTION
14.2%
7.9%
26.8%
14.7%
MUSLIM ESTIMATE
2.9%
1.4%
1.6%
1.7%
EPISCOPAL CHURCH
1.0%
2.1%
1.4%
2.1%
LUTHERAN CHURCH
0.7%
0.1%
1.5%
0.7%
EVANGELICAL LUTHERAN CHURCH IN AMERICA
0.3%
0.6%
1.1%
1.5%
SEVENTH DAY ADVENTIST CHURCH
0.3%
1.2%
1.7%
1.5%
AMERICAN BAPTIST CHURCHES IN THE USA
0.0%
0.8%
0.1%
1.1%
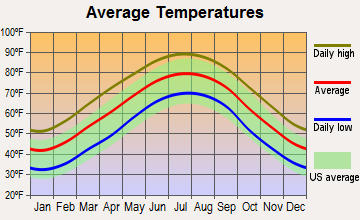
Weather
Houston's weather is characterized by long, hot summers and mild winters with higher amounts of rainfall throughout the year as it's closer to the Gulf Coast. Mild snowfall is extremely rare. Atlanta, on the other hand, leans towards a humid subtropical climate with hot, humid summers and mild, but occasionally chilly winters. The city can experience light snowfall in winter.
Weather and climate
Type
Houston
Atlanta
Temperature - Average
69.7°F
61.7°F
Humidity - Average morning or afternoon humidity
80.3%
73.9%
Humidity - Differences between morning and afternoon humidity
36.7%
38%
Humidity - Maximum monthly morning or afternoon humidity
92.8%
87%
Humidity - Minimum monthly morning or afternoon humidity
56.1%
49%
Precipitation - Yearly average
52.9 in
51.4 in
Snowfall - Yearly average
0.6 in
4 in
Clouds - Number of days clear of clouds
15%
18.3%
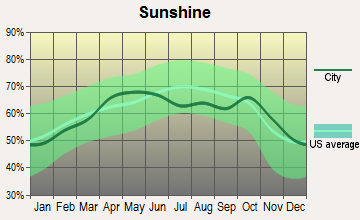
Sunshine amount - Average
60.4%
65.6%
Sunshine amount - Differences during a year
24%
17%
Sunshine amount - Maximum monthly
67%
67%
Sunshine amount - Minimum monthly
43%
50%
Wind speed - Average
8.2 mph
9 mph
Average climate in Houston, Texas
Average climate in Atlanta, Georgia
Air pollution
Type
AQI
CO
NO2
OZONE
PB
PM10
PM25
SO2
Year
Houston
Atlanta
Houston
Atlanta
Houston
Atlanta
Houston
Atlanta
Houston
Atlanta
Atlanta
Houston
Atlanta
Houston
Atlanta
2018
102
84
0.19
0.27
9.2
N/A
21.5
24.7
N/A
N/A
17.5
N/A
10.0
10.6
0.3
0.8
2017
96
87
0.16
0.31
9.4
N/A
23.1
24.7
N/A
N/A
17.5
N/A
9.1
11.3
0.3
1.2
2016
91
105
0.16
0.31
10.4
N/A
22.7
25.9
N/A
N/A
17.2
N/A
8.6
11.1
0.2
1.0
2015
109
91
0.15
0.31
10.1
N/A
21.7
23.9
N/A
N/A
17.6
N/A
9.9
10.2
0.2
0.9
2014
98
88
0.24
0.31
10.4
N/A
21.8
24.0
N/A
N/A
18.4
N/A
10.2
9.1
0.3
1.1
2013
106
88
0.25
0.30
11.1
N/A
23.0
23.7
N/A
N/A
18.0
N/A
10.6
8.7
0.4
1.0
2012
115
109
0.25
0.33
11.6
N/A
23.8
26.2
N/A
N/A
19.5
N/A
11.1
9.8
0.5
1.1
2011
118
98
0.27
0.33
10.8
N/A
24.6
27.5
N/A
N/A
21.2
N/A
11.5
12.0
0.8
1.7
2010
110
102
0.25
0.35
12.8
N/A
22.8
25.8
N/A
N/A
18.5
N/A
11.4
12.5
1.1
1.9
2009
115
96
0.21
N/A
10.5
N/A
22.1
25.2
N/A
N/A
18.5
N/A
11.4
13.8
1.0
1.7
2008
105
99
0.30
0.53
13.1
15.3
22.1
31.2
0.006
0.003
22.5
N/A
12.4
16.3
1.3
2.5
2007
119
124
0.31
0.45
15.2
17.0
20.5
33.1
0.006
0.003
29.4
N/A
13.5
18.1
1.9
2.7
2006
134
129
0.32
0.58
14.6
17.9
22.3
31.3
0.006
0.003
22.9
N/A
13.0
19.7
2.3
3.4
2005
126
123
0.42
0.55
16.3
17.2
22.8
29.0
0.005
0.005
25.5
N/A
13.9
15.8
3.5
3.2
2004
137
118
0.44
0.54
17.7
16.9
20.4
28.8
0.010
0.004
22.9
N/A
N/A
14.6
3.2
2.8
2003
146
112
0.62
0.56
17.0
16.4
20.9
26.7
0.009
0.004
22.2
N/A
N/A
15.4
3.2
3.0
2002
128
120
0.55
0.60
16.1
19.4
19.7
27.9
0.007
N/A
23.2
N/A
N/A
13.1
1.7
3.0
2001
147
117
0.44
0.69
18.4
23.3
19.6
27.2
0.008
N/A
27.0
N/A
N/A
N/A
2.5
3.1
2000
136
132
0.50
0.50
17.0
22.9
22.0
31.2
0.008
N/A
28.4
N/A
N/A
N/A
3.1
3.2
Natural disasters
Type
Houston
Atlanta
Tornado activity compared to U.S. average
187.3%
159.5%
Earthquake activity compared to U.S. average
63.9%
153.4%
Natural disasters compared to U.S. average
32%
15%
Transportation
In terms of public transit, Atlanta leads with its MARTA rail system. Houston's METRO system is less pervasive and the city relies heavily on roads and highways. Both cities are notorious for heavy traffic; however, Houston has a higher dependence on cars.
Transport
Type
Houston
Atlanta
Amtrak stations
1
1
Amtrak stations nearby
2
1
FAA registered aircraft
1
1
FAA registered aircraft manufacturers and dealers
44
28
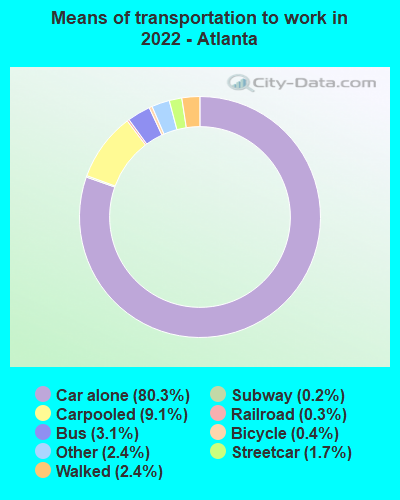
Means of transportation to work
Type
Houston
Atlanta
Bicycle
0.5%
0.5%
Bus
2.4%
2.1%
Carpooled
11.1%
7.6%
Car alone
81.2%
84%
Motorcycle
0.1%
0.1%
Railroad
0.1%
0.2%
Streetcar
0%
1.1%
Subway
0%
0.4%
Taxicab
0.1%
0.3%
Walked
1.6%
1.9%
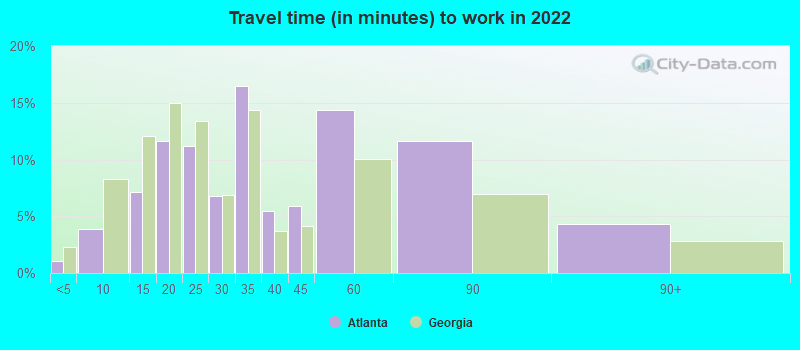
Average travel time to work
Type
Houston
Atlanta
Average
32 min
34.9 min
Other means
27.1 min
24.4 min
Public transportation
47.6 min
47.8 min
Private vehicle occupancy
Type
Houston
Atlanta
Average
1.2
1.1
Drove alone
86.4%
92.5%
In 2 person carpool
9.7%
6.7%
In 3 person carpool
2.4%
0.6%
In 4 person carpool
0.9%
0.3%
In 5-6 person carpool
0.4%
0%
In 7+ person carpool
0.3%
0%
How many people usually rode to work in the car, truck or van.
Real Estate
The real estate market in Houston is typically more affordable than in Atlanta. Houston offers more house for your money, though Atlanta offers a more robust condo and townhome market particularly attractive for single individuals or couples.
Neighborhoods
Both cities have diverse and unique neighborhoods. In Houston, you have upscale River Oaks and bohemian Montrose. Atlanta is home to the bustling Midtown and the historic yet vibrant Old Fourth Ward. Each city offers a mix of quiet, residential areas and bustling, urban spaces.
Houses and residents
Type
Houston
Atlanta
Houses
1,028,763
253,355
Average household size (people)
2.6
2.1
Median year apartment built
1985
1996
Median year house/condo built
1976
1976
Length of stay in the house since moving in
14.4 years
12.2 years
Houses occupied
924,981 (89.9%)
232,720 (91.9%)
Houses occupied by owners
390,226 (42.2%)
113,092 (48.6%)
Houses occupied by renters
534,755 (57.8%)
119,628 (51.4%)
Median rent asked for vacant for-rent units
$1,323
$1,226
Median monthly housing costs
$1,134
$1,504
Median price asked for vacant for-sale houses and condos
$334,556
$325,147
Estimated median house or condo value
$236,700
$375,500
Median numbers of rooms
4.4
4.5
Median number of rooms in apartments
3.5
3.5
Median number of rooms in houses and condos
6.1
6.2
Median house price - detached houses
$348,048
$585,854
Median house price - in 2-unit structures
$232,228
$359,451
Median house price - in 3-to-4-unit structures
$205,330
$453,504
Median house price - in 5 or more unit structures
$297,061
$356,868
Median house price - mobile homes
$68,903
$149,278
Median house price - Townhouses or other attached units
$299,072
$383,334
Median house price - All housing units
$337,365
$508,525
Median house age
40
34
Renting percentage
54.6%
55.1%
Housing density (houses/condos per square mile)
1,775.5
1,923
House value disparities
40.9%
36.3%
Household income disparities
49%
47.8%
Median household income for houses/condes with a mortgage
$109,539
$123,344
Median household income for apartments without a mortgage
$65,707
$75,939
Housing units without a mortgage
4,386 (2.1%)
1,022 (1.3%)
Housing units with both a second mortgage and home equity loan
7,696 (3.6%)
5,566 (7%)
Housing units with a mortgage
207,809 (97.9%)
78,250 (98.7%)
Housing units with a home equity loan
421 (0.2%)
58 (0.1%)
Housing units with a second mortgage
11,969 (5.6%)
7,203 (9.1%)
House/condo owner moved in on average (years ago)
13
7
House/condo renter moved in on average (years ago)
1
1
Housing units lacking complete kitchen facilities
2.4%
2%
Housing units lacking complete plumbing facilities
1.5%
1.5%
Housing units in structures
Housing units in structures
Houston
Atlanta
One, detached
43.2%
37.5%
One, attached
4.8%
6.6%
Two
2.2%
2.4%
3 or 4
4.4%
3.9%
5 to 9
7.1%
5.9%
10 to 19
10.9%
5.7%
20 to 49
7.7%
6.8%
50 or more
18.6%
30.7%
Mobile homes
0.9%
0.5%
Boats, RVs, vans, etc.
0.1%
0.0%
Median real estate property taxes paid for housing units
Self-employed workers in own not incorporated business
75,956
15,892
State government workers
38,359
13,288
Unpaid family workers
2,429
550
Industries and Occupations
Houston is known for the energy industry, particularly oil and gas, with many multinational corporations headquartered here. Meanwhile, Atlanta is a logistics hotspot due to its transportation networks, and also has a strong presence of media companies including CNN and Coca-Cola.
Both Houston and Atlanta have strong healthcare sectors. Houston is home to the Texas Medical Center, the largest medical center in the world. Atlanta boasts leading healthcare facilities including Emory Healthcare and the Centers for Disease Control and Prevention.
Health (county statistics)
Type
Houston
Atlanta
General health status score of residents in this county from 1 (poor) to 5 (excellent)
Houston boasts strong infrastructure due to its status as a global city. Its port is a significant global shipping hub. Atlanta is also firmly established with an extensive network of highways and the busiest airport in the world, Hartsfield-Jackson. Both cities have continuously invested in infrastructure improvements.
Infrastructure
Type
Houston
Atlanta
Hospitals
156
46
TV stations
26
22
Arenas or stadiums
6
6
Bank branches located here
755
235
Bank institutions located here
81
41
Main business address for public companies
197
85
Drinking water stations with no reported violations in the past
49
5
Drinking water stations with reported violations in the past
HMDA - Conventional home purchase loans - Applications denied
Year
Houston
Atlanta
1999
9,163
1,775
2000
0
1,902
2001
0
1,552
2002
0
1,683
2003
8,173
3,212
2004
11,803
4,962
2005
15,127
9,078
2006
16,911
10,866
2007
10,643
6,626
2008
4,410
2,140
2009
2,279
731
Culture and Food
Houston is renowned for its food scene, reflecting its diverse demographics with an abundance of different cuisines from barbeque to Vietnamese. Atlanta is famous for its Southern cuisine and is also a hotspot for arts and music, hosting numerous festivals throughout the year.
Sports Teams
Both cities are home to teams in all four major sports leagues. Houston is proud of the Rockets (NBA), Texans (NFL), Astros (MLB), and Dynamo (MLS). In Atlanta, the Braves (MLB), Falcons (NFL), Hawks (NBA), and United (MLS) have significant fanbases.


 Houston, TX
 Atlanta, GA