Fresno and Visalia, both located in California's Central Valley, offer residents different experiences and amenities. While Fresno is quite populous and known for its cultural diversity, bustling nightlife, and major city conveniences, Visalia, although smaller, offers a tighter-knit community feel and is closer to nature. Here, we'll deep-dive into the comparison between Fresno and Visalia, highlighting key points such as crime/safety, cost of living, and work opportunities to provide insights for those thinking of relocating or visiting these cities.
Distance between
Fresno, CA and
Visalia, CA : 41.5 miles
Fresno's population is larger by 281%. Its population has grown by 116,858 people (27.3%) since 2000. The population of Visalia has grown by 51,413 people (56.1%) during that time.
Fresno experiences a higher rate of crime compared to Visalia. While both cities have their share of safety issues, like any other urban area, Fresno’s larger population tends to contribute to higher crime rates. However, it's important to consider crime relative to specific neighborhoods because safety can vary significantly. Visalia generally has a lower crime rate and a reputation for being a safe place to live, with its smaller population and emphasis on community.
City-data.com crime index counts serious crimes and violent crime more heavily. It adjusts for the number of visitors and daily workers commuting into cities. (higher means more crime, U.S. average = 301.1)
City-data.com crime index counts serious crimes and violent crime more heavily. It adjusts for the number of visitors and daily workers commuting into cities. (higher means more crime, U.S. average = 301.1)
Sex Offenders
According to our data, there are 1,525 registered sex offenders living in Fresno and 301 registered sex offenders living in . The ratio of residents to sex offenders in Fresno is 342 to 1; the ratio in Visalia is 435 to 1. The number of registered sex offenders compared to the number of residents is larger in Fresno than in Visalia.
Cost of Living
The cost of living in Fresno is generally higher than in Visalia. Food, housing, and general expenses will likely be more in Fresno, thanks to its larger population and greater demand. However, salaries may also be higher in Fresno due to the greater variety of industries and employment opportunities.
Income Tax
As both cities are in California, state income tax applies equally to both. Ranging from 1% to 13.3% based on income classes.
Property Tax
Property tax rates in Fresno County, where Fresno is situated, and Tulare County, home to Visalia, are similar, both slightly above 1% of the home's assessed value.
Sales Tax
Sales tax in both cities is the same at 7.98%, combining state, county, and city taxes. This is consistent with the overall sales tax rate in California.
Income
Type
Fresno
Visalia
Estimated median household income
$61,250
$64,165
Estimated per capita income
$28,499
$29,976
Cost of living index (U.S. average is 100)
96.3
89.3
If you make $50,000 in Visalia, you will have to make $53,919 in Fresno to maintain the same standard of living.
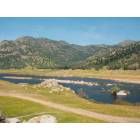
Geographical Conditions
Fresno is in the San Joaquin Valley and is near three national parks, which provides ample opportunities for outdoor activities. Visalia is even closer to the Sierra Nevada Mountains, making it a great base for those who enjoy outdoor pursuits.
Both cities boast numerous public and private schools. Fresno has more universities compared to Visalia, including California State University, Fresno. Visalia, while lacking in higher education institutions, does maintain a strong reputation for its elementary and high schools.
Fresno has a diverse economy with industries such as healthcare, education, and agriculture playing significant roles. Recent years have seen growth in its tech sector as well. Visalia's economy is more focused on agriculture, particularly dairy production, but it also has a notable healthcare sector.
Biggest Employers
The biggest employers in Fresno are Community Medical Centers, Saint Agnes Medical Center, and California State University. In Visalia, most people work in the Kaweah Delta Medical Center, the College of the Sequoias, or the Visalia Unified School District.
There were 1,911 building permits issued in Fresno in 2012 (1205 more than in 2011) compared to 748 building permits issued in Visalia in 2012 (477 more than in 2011).
In Fresno (Fresno County), 49.8% voted for Democrats and 48.0% for Republicans in 2012 Presidential Election. In Visalia (Tulare County), 41.2% voted for Democrats and 56.3% for Republicans.
Elections
Type
Democrats
Republicans
Other
Year
Fresno
Visalia
Fresno
Visalia
Fresno
Visalia
2020
53.0%
45.0%
45.2%
52.8%
1.8%
2.1%
2016
49.2%
41.8%
43.2%
51.2%
7.5%
7.1%
2012
49.8%
41.2%
48.0%
56.3%
2.2%
2.5%
2008
50.2%
41.5%
48.1%
56.8%
1.8%
1.7%
2004
42.0%
33.2%
57.8%
66.8%
0.3%
0.0%
2000
43.2%
36.9%
53.3%
60.5%
3.5%
2.6%
1996
45.3%
38.1%
47.4%
53.9%
7.3%
8.0%
Breakdown of population affiliated with a religious congregation
Type
Adherents
Congregations
Religion
Fresno
Visalia
Fresno
Visalia
CATHOLIC CHURCH
31.0%
23.2%
6.1%
6.4%
SOUTHERN BAPTIST CONVENTION
1.6%
1.0%
8.1%
7.6%
SEVENTH DAY ADVENTIST CHURCH
0.7%
0.9%
2.6%
3.7%
AMERICAN BAPTIST CHURCHES IN THE USA
0.6%
0.4%
2.4%
1.2%
EVANGELICAL LUTHERAN CHURCH IN AMERICA
0.5%
0.2%
2.0%
0.5%
MUSLIM ESTIMATE
0.3%
0.3%
0.6%
0.5%
LUTHERAN CHURCH
0.1%
0.3%
0.7%
1.2%
CHRISTIAN REFORMED CHURCH NORTH AMERICA
0.0%
0.3%
0.6%
0.2%
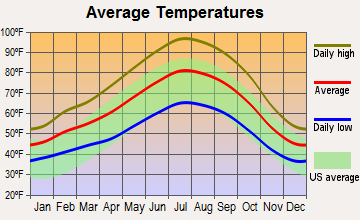
Weather
The weather in both Fresno and Visalia includes hot summers and mild winters. Fresno can reach higher temperatures in the summer, sometimes exceeding 100°F. Visalia, while still warm in the summertime, usually experiences slightly lower temperatures due to its closer proximity to the Sierra Nevada mountains.
Weather and climate
Type
Fresno
Visalia
Temperature - Average
63°F
62.5°F
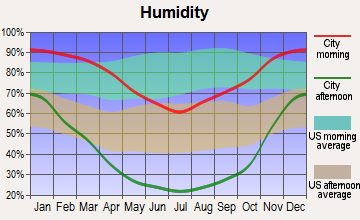
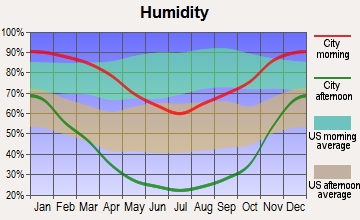
Humidity - Average morning or afternoon humidity
60.9%
60.2%
Humidity - Differences between morning and afternoon humidity
67%
65.5%
Humidity - Maximum monthly morning or afternoon humidity
88%
87%
Humidity - Minimum monthly morning or afternoon humidity
21%
21.4%
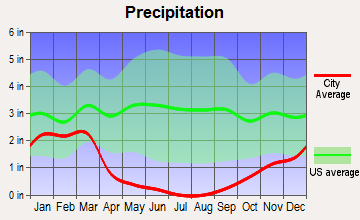
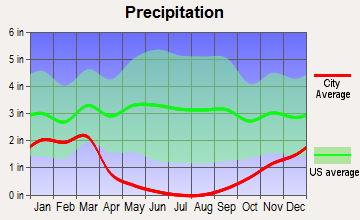
Precipitation - Yearly average
11.6 in
11.1 in
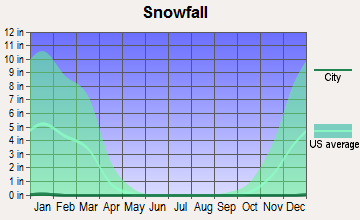
Snowfall - Yearly average
0 in
0 in
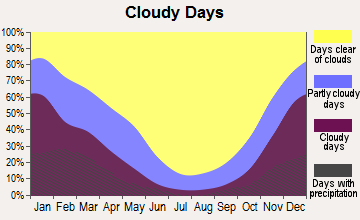
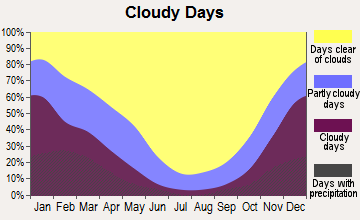
Clouds - Number of days clear of clouds
32.4%
32.3%
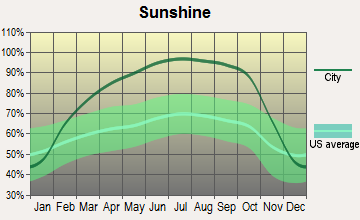
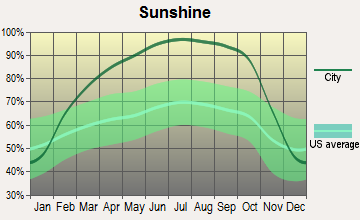
Sunshine amount - Average
82.8%
82.8%
Sunshine amount - Differences during a year
52%
51.8%
Sunshine amount - Maximum monthly
96%
95.9%
Sunshine amount - Minimum monthly
44%
44.1%
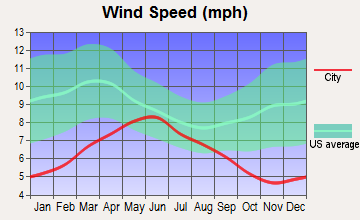
Wind speed - Average
6.5 mph
6.6 mph
Average climate in Fresno, California
Average climate in Visalia, California
Air pollution
Type
AQI
CO
NO2
OZONE
PB
PM10
PM25
SO2
Year
Fresno
Visalia
Fresno
Visalia
Fresno
Visalia
Fresno
Visalia
Fresno
Visalia
Fresno
Visalia
Fresno
Visalia
Fresno
2018
128
129
0.35
N/A
9.7
10.9
31.7
32.4
N/A
N/A
39.7
51.5
14.8
17.6
0.6
N/A
2017
132
136
0.35
N/A
9.2
10.7
33.2
33.1
N/A
N/A
38.3
46.1
14.3
16.8
0.6
N/A
2016
128
127
0.35
N/A
8.4
9.4
31.4
27.8
N/A
N/A
34.7
42.9
13.5
15.5
0.5
N/A
2015
134
129
0.32
N/A
8.7
9.6
31.1
29.7
N/A
N/A
34.2
43.7
13.9
14.7
0.5
N/A
2014
139
131
0.33
N/A
10.1
10.5
32.4
28.3
0.004
N/A
39.3
47.5
16.4
16.9
0.5
N/A
2013
136
138
0.37
N/A
11.1
12.7
31.0
26.0
0.005
N/A
43.3
48.3
19.1
18.9
0.6
N/A
2012
140
129
0.36
N/A
9.7
12.1
31.9
30.2
0.004
N/A
36.1
40.2
14.2
15.2
0.6
N/A
2011
139
137
0.34
N/A
8.7
11.8
33.5
27.1
N/A
N/A
30.2
34.0
21.1
17.5
0.8
N/A
2010
121
141
0.27
N/A
6.9
12.5
31.1
29.9
N/A
N/A
N/A
N/A
N/A
12.4
0.7
N/A
2009
107
139
0.31
N/A
7.3
14.7
29.6
30.6
N/A
N/A
N/A
N/A
N/A
16.5
1.6
N/A
2008
130
153
0.33
N/A
9.3
14.4
31.1
32.6
N/A
N/A
N/A
N/A
22.2
19.7
1.0
N/A
2007
146
146
0.34
N/A
10.0
14.8
28.4
27.0
N/A
N/A
N/A
N/A
26.0
22.5
0.7
N/A
2006
104
136
0.36
N/A
11.3
14.4
29.7
26.9
0.006
0.006
N/A
N/A
N/A
19.8
N/A
N/A
2005
101
141
0.33
0.41
10.7
15.7
28.1
26.4
N/A
N/A
N/A
N/A
N/A
19.9
N/A
N/A
2004
103
133
0.34
0.42
11.5
15.8
30.8
26.7
N/A
N/A
N/A
N/A
N/A
19.6
N/A
N/A
2003
115
140
0.44
0.48
15.0
17.6
31.2
27.3
N/A
N/A
N/A
N/A
N/A
19.8
1.2
N/A
2002
139
143
0.43
0.58
15.2
19.0
44.8
27.6
N/A
N/A
N/A
N/A
N/A
28.2
N/A
N/A
2001
143
122
0.42
0.58
15.1
17.6
47.3
28.0
N/A
N/A
N/A
N/A
N/A
N/A
N/A
N/A
2000
136
121
0.51
0.61
15.4
18.2
41.0
27.7
N/A
N/A
N/A
N/A
N/A
N/A
N/A
N/A
Natural disasters
Type
Fresno
Visalia
Tornado activity compared to U.S. average
9.9%
7%
Earthquake activity compared to U.S. average
8,613%
8,608.2%
Natural disasters compared to U.S. average
12%
14%
Transportation
Fresno's transit system is more advanced, featuring bus lines, airport connections, and highway access. Commute times in Fresno are typically longer due to the larger population and city size. On the other hand, Visalia, owing to its size, has less congestion, making commuting times shorter.
Transport
Type
Fresno
Visalia
Amtrak stations
1
0
Amtrak stations nearby
2
1
FAA registered aircraft
408
155
FAA registered aircraft manufacturers and dealers
36
10
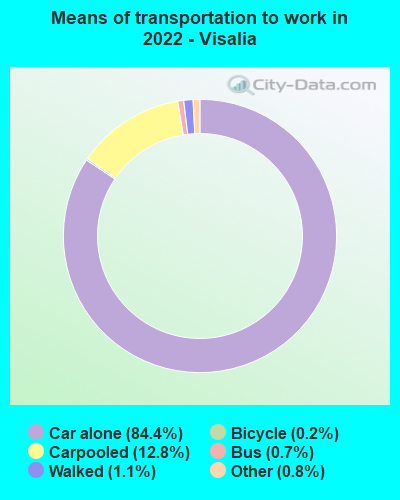
Means of transportation to work
Type
Fresno
Visalia
Bicycle
0.8%
0.2%
Bus
1.3%
0.7%
Carpooled
10.7%
11.3%
Car alone
84.4%
85.4%
Motorcycle
0.2%
0.3%
Taxicab
0.1%
0.2%
Walked
1.4%
1.3%
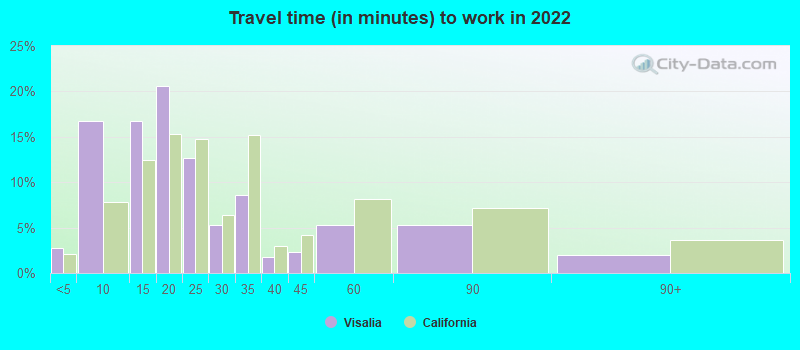
Average travel time to work
Type
Fresno
Visalia
Average
23.7 min
22 min
Other means
21.5 min
21.3 min
Public transportation
45.3 min
35.9 min
Private vehicle occupancy
Type
Fresno
Visalia
Average
1.2
1.2
Drove alone
88.3%
87.3%
In 2 person carpool
8.5%
9.1%
In 3 person carpool
1.8%
1.9%
In 4 person carpool
0.8%
0.6%
In 5-6 person carpool
0.5%
0.7%
In 7+ person carpool
0.1%
0.2%
How many people usually rode to work in the car, truck or van.
Real Estate
Both cities offer a range of housing options, but housing is generally more expensive in Fresno. The median home price in Fresno is higher than Visalia. Additionally, Fresno provides a wider range of urban living options compared to Visalia.
Neighborhoods
Fresno boasts diverse neighborhoods appealing to different lifestyles, boasting both urban and suburban environments. Visalia offers a smaller town vibe with a tight-knit community. Both cities have areas that are historic or modern, and each neighborhood has a unique feel.
Houses and residents
Type
Fresno
Visalia
Houses
188,756
49,257
Average household size (people)
3.1
3
Median year apartment built
1977
1985
Median year house/condo built
1983
1991
Length of stay in the house since moving in
12.6 years
12 years
Houses occupied
181,841 (96.3%)
47,660 (96.8%)
Houses occupied by owners
91,233 (50.2%)
25,784 (54.1%)
Houses occupied by renters
90,608 (49.8%)
21,876 (45.9%)
Median rent asked for vacant for-rent units
$958.34
$970.16
Median monthly housing costs
$1,209
$1,313
Median price asked for vacant for-sale houses and condos
$285,919
$263,420
Estimated median house or condo value
$321,300
$315,100
Median numbers of rooms
5
5.3
Median number of rooms in apartments
4
4.7
Median number of rooms in houses and condos
5.9
6
Median house price - detached houses
$375,492
$328,816
Median house price - in 2-unit structures
$184,112
$275,219
Median house price - in 3-to-4-unit structures
$196,355
$334,785
Median house price - in 5 or more unit structures
$287,684
$681,123
Median house price - mobile homes
$100,122
$59,049
Median house price - Townhouses or other attached units
$260,277
$215,718
Median house price - All housing units
$358,028
$318,714
Median house age
42
33
Renting percentage
50.9%
38.6%
Housing density (houses/condos per square mile)
1,808.6
1,723.7
House value disparities
29.4%
27.2%
Household income disparities
46.4%
46.6%
Median household income for houses/condes with a mortgage
$97,354
$102,730
Median household income for apartments without a mortgage
$73,445
$60,303
Housing units without a mortgage
1,037 (1.7%)
177 (0.9%)
Housing units with both a second mortgage and home equity loan
2,880 (4.8%)
982 (5.2%)
Housing units with a mortgage
59,354 (98.3%)
18,656 (99.1%)
Housing units with a home equity loan
68 (0.1%)
658 (3.5%)
Housing units with a second mortgage
4,120 (6.8%)
2,175 (11.5%)
House/condo owner moved in on average (years ago)
10
10
House/condo renter moved in on average (years ago)
3
2
Housing units lacking complete kitchen facilities
1.5%
1.3%
Housing units lacking complete plumbing facilities
0.4%
0.2%
Housing units in structures
Housing units in structures
Fresno
Visalia
One, detached
59.0%
72.9%
One, attached
3.2%
5.7%
Two
3.0%
4.0%
3 or 4
7.8%
6.3%
5 to 9
9.6%
4.3%
10 to 19
3.6%
1.0%
20 to 49
3.4%
1.1%
50 or more
7.5%
1.8%
Mobile homes
2.6%
2.7%
Boats, RVs, vans, etc.
0.1%
0.3%
Median real estate property taxes paid for housing units
Self-employed workers in own not incorporated business
14,428
3,982
State government workers
9,836
3,605
Unpaid family workers
890
0
Industries and Occupations
While both cities are rooted in agriculture due to their Central Valley location, Fresno has more diversity in its workforce and industries, driven by its larger population. Fresno's workforce spreads across healthcare, education, retail, and tech. Visalia's workforce is more focused on farming and related industries along with healthcare and education.
Fresno offers more extensive healthcare options due its larger size and population. Major medical centers and specialty clinics are present. Visalia, though smaller, still offers reliable healthcare thanks to the presence of the Kaweah Delta Health Care District.
Fresno's infrastructure is more developed, featuring a range of public facilities, including hospitals, parks, an airport, and a downtown area with high-rise buildings. Visalia, being smaller, has fewer amenities but still provides necessary facilities for its residents.
Infrastructure
Type
Fresno
Visalia
Hospitals
32
8
TV stations
4
0
Bank branches located here
98
31
Bank institutions located here
25
16
Drinking water stations with no reported violations in the past
5
3
Drinking water stations with reported violations in the past
HMDA - Conventional home purchase loans - Applications denied
Year
Fresno
Visalia
1999
717
108
2000
484
67
2001
462
58
2002
569
63
2003
1,510
244
2004
2,462
413
2005
3,394
575
2006
3,441
649
2007
2,138
375
2008
760
121
2009
354
50
Culture and Food
Fresno is known for its diverse culture and food scene, housing numerous ethnic communities such as Mexican, Armenian, and Hmong. It offers a vibrant nightlife and a wide variety of cultural events. Visalia has a less diverse, but still noteworthy food scene, with an emphasis on local and farm-to-table dining. It also provides access to various cultural experiences, though on a smaller scale.
Sports Teams
Being a larger city, Fresno is home to several minor league sports teams including the Fresno Grizzlies (baseball) and Fresno FC (soccer). Visalia, being smaller, doesn't host professional teams, but its Visalia Rawhide (minor league baseball) are adored by locals.


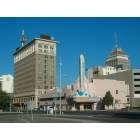
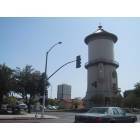

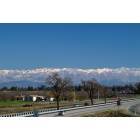
 Fresno, CA
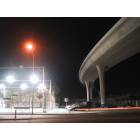
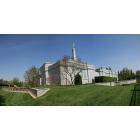
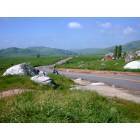
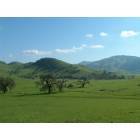
 Visalia, CA