Fort Worth, Texas, and Wichita, Kansas, are two distinctly different American cities with their unique attributes. Each city offers a specific quality of life that caters to specific individuals with differing lifestyle needs and preferences. This comparison will delve into the details of safety, weather, cost of living, education, economy, infrastructure, industries, biggest employers, real estate, neighborhoods, transportation, taxes, culture, sports, geography, and healthcare. Both cities offer something for residents and tourists.
Distance between
Fort Worth, TX and
Wichita, KS : 342.0 miles
Fort Worth's population is larger by 136%. Its population has grown by 400,814 people (75.0%) since 2000. The population of Wichita has grown by 51,415 people (14.9%) during that time.
The crime rate in Fort Worth, TX, is somewhat higher than the national average, and significantly higher compared to Wichita, KS. In particular, property crime rates are higher in Fort Worth. Wichita, however, features lower crime rates and a safer environment for both residents and tourists. It is essential to bear in mind that crime rates can vary significantly from one neighborhood to another within the same city.
City-data.com crime index counts serious crimes and violent crime more heavily. It adjusts for the number of visitors and daily workers commuting into cities. (higher means more crime, U.S. average = 301.1)
City-data.com crime index counts serious crimes and violent crime more heavily. It adjusts for the number of visitors and daily workers commuting into cities. (higher means more crime, U.S. average = 301.1)
Sex Offenders
According to our data, there are 3,152 registered sex offenders living in Fort Worth and 1,453 registered sex offenders living in . The ratio of residents to sex offenders in Fort Worth is 272 to 1; the ratio in Wichita is 268 to 1. The number of registered sex offenders compared to the number of residents in Fort Worth is near to than in Wichita.
Cost of Living
The cost of living in Fort Worth, Texas, is higher than Wichita, Kansas. This difference is primarily due to the higher cost of housing in Fort Worth. However, the slightly inflated cost of living in Fort Worth correlates with higher average wages, relatively offsetting this cost difference.
Income Tax
As already mentioned, Texas doesn't have a state income tax, which happens to be a massive advantage for those residing in Fort Worth. However, Wichita's residents are subject to Kansas state's income tax, which varies from 3.1% to 5.7%.
Property Tax
Property taxes differ in these two cities—Texas, and thus Fort Worth, has one of the highest average property tax rates in the country, while Kansas's rates are closer to the national average, making property taxes in Wichita considerably lower.
Sales Tax
Texas residents benefit from the absence of state income tax, with a higher base sales tax at 8.25% in Fort Worth. Kansas has a lower base sales tax rate at 6.5% but does charge a state income tax, affecting Wichita's residents.
Income
Type
Fort Worth
Wichita
Estimated median household income
$68,235
$56,293
Estimated per capita income
$34,106
$30,942
Cost of living index (U.S. average is 100)
95.4
81.7
If you make $50,000 in Wichita, you will have to make $58,384 in Fort Worth to maintain the same standard of living.
Geographical Conditions
Fort Worth is located in North Central Texas, offering residents and tourists a mix of city living and proximity to outdoor recreational activities in Texas's wide-open spaces. Wichita is located in South Central Kansas, presenting a flatter geography, and is nestled on the Arkansas River.
Both cities indicate high emphasis on education. Fort Worth is home to the renowned Texas Christian University and a host of other tertiary institutions while Wichita is the home to Wichita State University. Both cities offer sound K-12 education, with Wichita public schools priding themselves on their specialty programs.
Fort Worth's economy leans more toward education, healthcare, and government sectors. In contrast, Wichita's economy is primarily based on manufacturing, healthcare, and professional and business services. Job growth is significant in both cities, albeit slightly more promising in Fort Worth in recent years.
Biggest Employers
In Fort Worth, some of the biggest employers include Lockheed Martin Aeronautics, American Airlines, and Texas Health Resources. On the other hand, aviation giants such as Spirit AeroSystems, Koch Industries, and Wesley Healthcare govern the employment field in Wichita.
There were 7,236 building permits issued in Fort Worth in 2012 (4810 more than in 2011) compared to 760 building permits issued in Wichita in 2012 (351 more than in 2011).
In Fort Worth (Tarrant County), 41.4% voted for Democrats and 57.1% for Republicans in 2012 Presidential Election. In Wichita (Sedgwick County), 39.4% voted for Democrats and 58.3% for Republicans.
Elections
Type
Democrats
Republicans
Other
Year
Fort Worth
Wichita
Fort Worth
Wichita
Fort Worth
Wichita
2020
49.3%
42.9%
49.1%
54.7%
1.6%
2.4%
2016
43.2%
36.3%
51.8%
54.4%
5.0%
9.3%
2012
41.4%
39.4%
57.1%
58.3%
1.4%
2.3%
2008
43.8%
42.5%
55.5%
55.2%
0.7%
2.3%
2004
37.0%
36.6%
62.5%
62.3%
0.5%
1.2%
2000
36.9%
38.4%
60.9%
57.5%
2.3%
4.1%
1996
41.6%
35.8%
50.9%
56.1%
7.5%
8.1%
Breakdown of population affiliated with a religious congregation
Type
Adherents
Congregations
Religion
Fort Worth
Wichita
Fort Worth
Wichita
SOUTHERN BAPTIST CONVENTION
17.3%
5.9%
33.3%
9.9%
CATHOLIC CHURCH
11.1%
15.0%
1.9%
5.9%
MUSLIM ESTIMATE
2.2%
0.2%
0.9%
0.7%
LUTHERAN CHURCH
0.5%
1.4%
0.9%
1.8%
SEVENTH DAY ADVENTIST CHURCH
0.4%
0.4%
1.6%
1.3%
EPISCOPAL CHURCH
0.3%
0.5%
0.8%
1.3%
EVANGELICAL LUTHERAN CHURCH IN AMERICA
0.3%
0.5%
0.9%
1.6%
AMERICAN BAPTIST CHURCHES IN THE USA
0.0%
0.6%
0.1%
3.1%
SALVATION ARMY
0.0%
0.4%
0.2%
0.4%
Weather
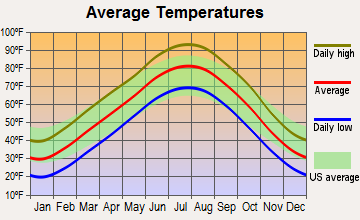
When it comes to weather, Fort Worth, TX, sustains a hotter summer compared to Wichita, KS, but a milder winter. Whereas Wichita experiences all four seasons, with hot summers and cold, sometimes snowy, winters. Visitors to either city would need to plan and pack accordingly based on the time of year they're traveling.
Weather and climate
Type
Fort Worth
Wichita
Temperature - Average
65°F
56.3°F
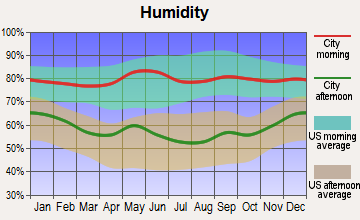
Humidity - Average morning or afternoon humidity
71.4%
73.4%
Humidity - Differences between morning and afternoon humidity
34.1%
34%
Humidity - Maximum monthly morning or afternoon humidity
82.1%
84%
Humidity - Minimum monthly morning or afternoon humidity
48%
50%
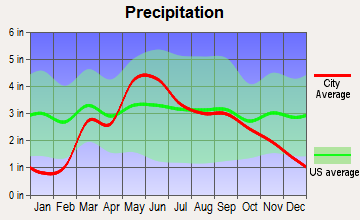
Precipitation - Yearly average
35 in
30.9 in
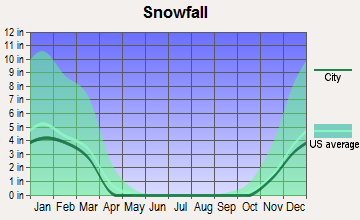
Snowfall - Yearly average
4.2 in
30 in
Clouds - Number of days clear of clouds
22.8%
21.3%
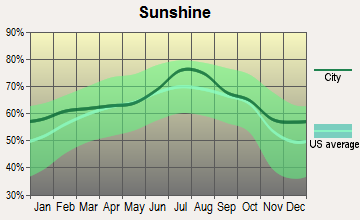
Sunshine amount - Average
66.6%
70.2%
Sunshine amount - Differences during a year
20%
20%
Sunshine amount - Maximum monthly
74%
76%
Sunshine amount - Minimum monthly
54%
56%
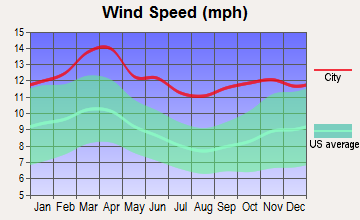
Wind speed - Average
10.3 mph
12.5 mph
Average climate in Fort Worth, Texas
Average climate in Wichita, Kansas
Air pollution
Type
AQI
CO
NO2
OZONE
PM10
PM25
SO2
Year
Fort Worth
Wichita
Fort Worth
Wichita
Fort Worth
Wichita
Fort Worth
Wichita
Wichita
Fort Worth
Wichita
Fort Worth
Wichita
2018
67
67
N/A
N/A
5.8
7.8
27.1
28.1
25.8
N/A
N/A
6.2
N/A
1.1
2017
67
66
N/A
N/A
6.2
6.8
27.2
29.1
22.1
N/A
N/A
6.9
N/A
1.2
2016
56
65
N/A
N/A
6.3
6.8
25.5
27.6
21.5
N/A
N/A
N/A
N/A
0.6
2015
61
61
N/A
N/A
6.5
7.2
24.8
28.4
21.1
N/A
N/A
N/A
N/A
1.0
2014
56
70
0.22
N/A
6.8
7.7
26.6
30.0
23.4
N/A
N/A
N/A
N/A
1.4
2013
64
66
0.25
0.25
6.4
8.9
26.5
30.1
20.8
N/A
N/A
N/A
N/A
0.6
2012
87
91
0.26
0.26
7.8
9.9
30.3
32.2
24.1
N/A
N/A
N/A
N/A
1.2
2011
79
89
0.23
0.22
7.9
12.2
30.7
33.5
22.6
N/A
N/A
N/A
N/A
1.5
2010
70
73
0.23
0.45
8.5
8.3
27.7
32.0
20.2
N/A
N/A
N/A
N/A
0.7
2009
81
69
0.25
0.31
8.7
8.2
29.5
29.3
19.9
N/A
N/A
N/A
N/A
0.8
2008
69
66
0.25
0.36
9.6
8.9
25.8
24.0
20.9
N/A
N/A
N/A
N/A
1.7
2007
75
70
0.30
0.47
10.6
9.5
24.6
21.7
21.2
N/A
N/A
N/A
N/A
1.4
2006
90
82
0.34
0.46
10.2
10.0
29.7
29.7
22.3
N/A
N/A
N/A
N/A
0.4
2005
102
80
0.34
0.55
10.9
11.4
28.4
27.8
21.5
N/A
11.3
N/A
0.9
0.3
2004
78
60
0.39
0.37
10.6
9.3
25.4
27.8
20.2
N/A
N/A
N/A
N/A
0.1
2003
82
74
0.40
0.30
11.1
10.0
27.2
29.2
21.8
N/A
N/A
N/A
N/A
0.1
2002
94
79
0.37
0.54
11.8
8.1
25.8
31.7
22.4
N/A
N/A
N/A
N/A
0.1
2001
16
86
0.48
0.40
N/A
5.2
N/A
34.2
23.7
N/A
N/A
N/A
N/A
0.2
2000
17
84
0.55
0.55
N/A
5.0
N/A
30.6
22.8
N/A
N/A
N/A
N/A
0.3
Natural disasters
Type
Fort Worth
Wichita
Tornado activity compared to U.S. average
249.6%
202.4%
Earthquake activity compared to U.S. average
562.8%
922.9%
Natural disasters compared to U.S. average
23%
16%
Transportation
Public transportation in Fort Worth is robust, with the city offering bus services, commuter rail connections, and bike-share programs. Wichita, being smaller, has a less extensive public transportation system but boasts shorter average commute times.
Transport
Type
Fort Worth
Wichita
Amtrak stations
1
0
Amtrak stations nearby
1
0
FAA registered aircraft
2
2
FAA registered aircraft manufacturers and dealers
19
69
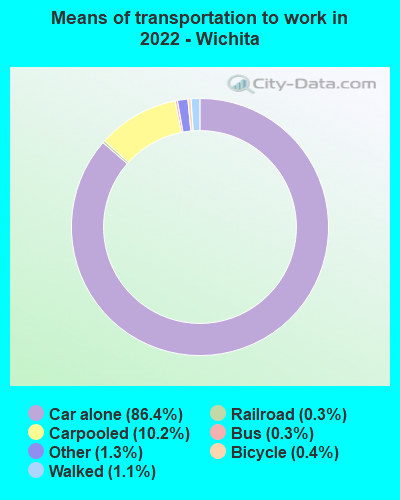
Means of transportation to work
Type
Fort Worth
Wichita
Bicycle
0.1%
0.3%
Bus
0.4%
0.5%
Carpooled
11%
9.1%
Car alone
85.8%
87%
Motorcycle
0.1%
0.1%
Walked
1.3%
1.1%
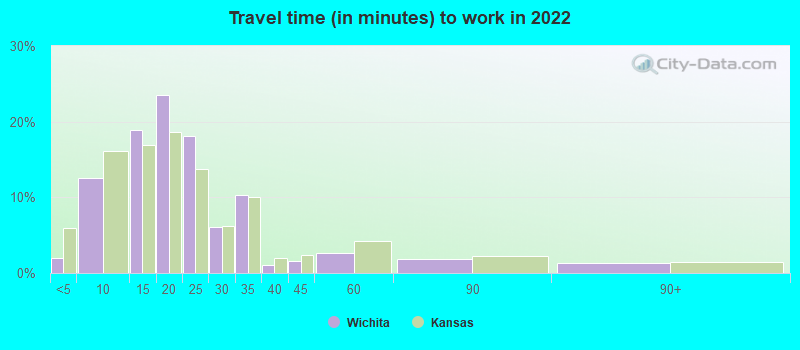
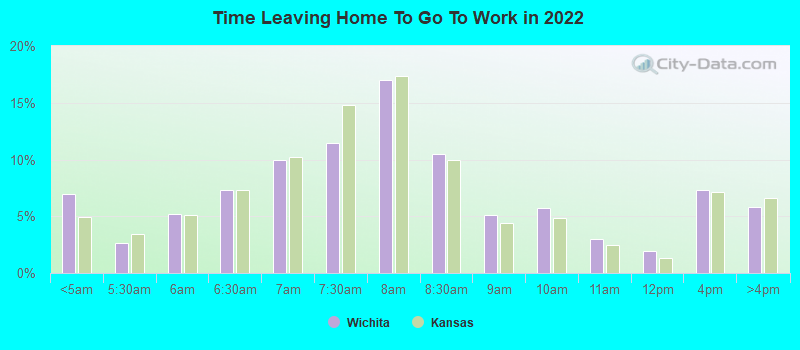
Average travel time to work
Type
Fort Worth
Wichita
Average
28.5 min
21.6 min
Other means
25.3 min
18.7 min
Public transportation
41.8 min
42.3 min
Private vehicle occupancy
Type
Fort Worth
Wichita
Average
1.2
1.2
Drove alone
87.6%
89.1%
In 2 person carpool
8.5%
8.3%
In 3 person carpool
2.5%
1.6%
In 4 person carpool
1.1%
0.5%
In 5-6 person carpool
0.3%
0.3%
In 7+ person carpool
0.1%
0.2%
How many people usually rode to work in the car, truck or van.
Real Estate
Fort Worth’s real estate is pricey compared to Wichita, with a higher median house price. However, home appreciation has been trending upwards in both cities, offering solid real estate investment potential.
Neighborhoods
Fort Worth features diverse neighborhoods from the historic, art-focused Near Southside to the downtown area, which is bustling with activity. Wichita comprises comfortable residential neighborhoods and vibrant downtown areas like Old Town, each providing a healthy mix of suburban and urban living.
Houses and residents
Type
Fort Worth
Wichita
Houses
361,341
176,357
Average household size (people)
2.8
2.5
Median year apartment built
1991
1974
Median year house/condo built
1995
1978
Length of stay in the house since moving in
11.2 years
12.1 years
Houses occupied
334,286 (92.5%)
156,668 (88.8%)
Houses occupied by owners
185,197 (55.4%)
91,527 (58.4%)
Houses occupied by renters
149,089 (44.6%)
65,141 (41.6%)
Median rent asked for vacant for-rent units
$1,068
$1,022
Median monthly housing costs
$1,328
$884
Median price asked for vacant for-sale houses and condos
$288,576
$269,752
Estimated median house or condo value
$249,000
$165,700
Median numbers of rooms
5.3
5.7
Median number of rooms in apartments
4.2
4.3
Median number of rooms in houses and condos
6.3
7
Median house price - detached houses
$279,885
$217,536
Median house price - in 2-unit structures
Over $1,000,000
$140,687
Median house price - in 3-to-4-unit structures
$337,081
$121,965
Median house price - in 5 or more unit structures
$298,062
$117,517
Median house price - mobile homes
$58,470
$87,984
Median house price - occupied boats, rvs, vans etc.
$16,069
$100,474
Median house price - Townhouses or other attached units
$279,957
$146,455
Median house price - All housing units
$279,281
$210,445
Median house age
29
47
Renting percentage
40.8%
38.7%
Housing density (houses/condos per square mile)
1,235.2
1,299.1
House value disparities
31.8%
37.5%
Household income disparities
43.6%
44.1%
Median household income for houses/condes with a mortgage
$106,170
$82,935
Median household income for apartments without a mortgage
$72,147
$60,554
Housing units without a mortgage
2,986 (2.4%)
1,747 (3%)
Housing units with both a second mortgage and home equity loan
3,696 (3%)
4,222 (7.3%)
Housing units with a mortgage
121,099 (97.6%)
56,370 (97%)
Housing units with a home equity loan
66 (0.1%)
321 (0.6%)
Housing units with a second mortgage
5,171 (4.2%)
5,142 (8.8%)
House/condo owner moved in on average (years ago)
8
10
House/condo renter moved in on average (years ago)
1
1
Housing units lacking complete kitchen facilities
1.8%
3.7%
Housing units lacking complete plumbing facilities
0.7%
2.6%
Housing units in structures
Housing units in structures
Fort Worth
Wichita
One, detached
65.4%
65.1%
One, attached
2.9%
5.6%
Two
1.6%
4.6%
3 or 4
4.1%
4.7%
5 to 9
5.8%
3.6%
10 to 19
6.5%
5.3%
20 to 49
4.6%
4.3%
50 or more
7.0%
4.6%
Mobile homes
2.1%
2.0%
Boats, RVs, vans, etc.
0.0%
0.1%
Median real estate property taxes paid for housing units
Self-employed workers in own not incorporated business
27,257
8,733
State government workers
8,587
7,037
Unpaid family workers
392
256
Industries and Occupations
Fort Worth's leading industries include aerospace, technology, healthcare, and education. Wichita is known as the "Air Capital of the World," with major aerospace companies like Spirit AeroSystems and Textron Aviation calling it home. Healthcare and education also play significant roles in employment.
Both cities offer access to highly rated healthcare facilities. Fort Worth benefits from its proximity to Dallas's renowned health institutions. Wichita prides itself on its extensive local healthcare network, which includes an outpost of Mayo Clinic.
Health (county statistics)
Type
Fort Worth
Wichita
General health status score of residents in this county from 1 (poor) to 5 (excellent)
Fort Worth benefits from being part of the larger Dallas-Fort Worth metropolitan area, offering excellent infrastructure for businesses, residents, and tourists alike. Wichita, while smaller, features well-planned highways and public facilities that make it an efficient place for both living and conducting business.
Infrastructure
Type
Fort Worth
Wichita
Hospitals
76
24
TV stations
25
13
Arenas or stadiums
7
1
Bank branches located here
175
138
Bank institutions located here
42
34
Main business address for public companies
24
5
Drinking water stations with no reported violations in the past
3
0
Drinking water stations with reported violations in the past
HMDA - Conventional home purchase loans - Applications denied
Year
Fort Worth
Wichita
1999
3,575
2,785
2000
2,473
2,308
2001
2,109
1,808
2002
1,701
1,227
2003
2,183
1,260
2004
3,202
1,320
2005
4,261
1,401
2006
4,161
1,272
2007
2,871
1,037
2008
1,256
569
2009
585
324
Culture and Food
Both cities offer a rich cultural scene. Fort Worth is known for its art galleries, live music scene, and rodeos. Wichita is known for its food, music festivals, and performing arts scene. Each city presents a unique blend of historical and contemporary culture.
Sports Teams
For sports enthusiasts, Fort Worth offers proximity to Dallas's professional sports teams, including the Dallas Cowboys (NFL), Dallas Mavericks (NBA), and Texas Rangers (MLB). Wichita doesn't host a major professional sports franchise but does have a fervent college sports culture, particularly basketball, at Wichita State University.


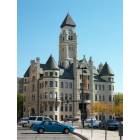

 Fort Worth, TX
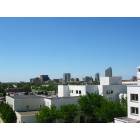
 Wichita, KS