Comparing life in Fort Worth, Texas, and Riverside, California poses an interesting study in contrasts. While both cities present unique opportunities based on their geographical location, industries, and cultural heritage, there are marked differences in their cost of living, taxation policies, and local climates. This deep dive into crime and safety, weather, cost of living, educational opportunities, work and economy, infrastructure, industries, biggest employers, real estate prospects, neighborhoods, public transit, city/state taxes, sports, geography, and health care seeks to give a comprehensive picture of life in both cities.
Distance between
Fort Worth, TX and
Riverside, CA : 1,159.1 miles
Fort Worth's population is larger by 195%. Its population has grown by 400,814 people (75.0%) since 2000. The population of Riverside has grown by 62,095 people (24.3%) during that time.
In terms of crime, Fort Worth has higher crime rates compared to national averages, though it is safer than many cities its size. Riverside, on the other hand, has crime rates lower than national averages. Both cities showcase effective local law enforcement and community engagement. However, as with any city, certain neighborhoods experience more crime than others.
City-data.com crime index counts serious crimes and violent crime more heavily. It adjusts for the number of visitors and daily workers commuting into cities. (higher means more crime, U.S. average = 301.1)
City-data.com crime index counts serious crimes and violent crime more heavily. It adjusts for the number of visitors and daily workers commuting into cities. (higher means more crime, U.S. average = 301.1)
Sex Offenders
According to our data, there are 3,152 registered sex offenders living in Fort Worth and 648 registered sex offenders living in . The ratio of residents to sex offenders in Fort Worth is 272 to 1; the ratio in Riverside is 501 to 1. The number of registered sex offenders compared to the number of residents is larger in Fort Worth than in Riverside.
Cost of Living
The cost of living in Fort Worth is significantly lower than that of Riverside. Housing, in particular, is much more affordable in Fort Worth, where the median home price is nearly half that of Riverside's. Moreover, groceries, healthcare, and transportation costs are also lower in Fort Worth. However, California's minimum wage is higher than Texas', which somewhat offsets the cost difference.
Income Tax
Texas shakes up the tax equation by having no state income tax, a significant advantage for those living in Fort Worth. This is in contrast to California, which has one of the highest state individual income tax rates in the U.S., affecting Riverside residents.
Property Tax
Property taxes in Fort Worth are higher than the national average—the median property tax in Tarrant County, where Fort Worth is located, is around 2.9%. Meanwhile, Riverside County has average property taxes at around 1.1% of a property's assessed fair market value.
Sales Tax
Texas has a higher state sales tax rate than California, but it doesn't have local sales taxes. Fort Worth residents therefore pay a total sales tax of 8.25%. Meanwhile, Riverside residents shoulder a 7.25% state sales tax, but with additional local sales taxes, the total can reach up to 8.75%.
Income
Type
Fort Worth
Riverside
Estimated median household income
$68,235
$76,558
Estimated per capita income
$34,106
$29,013
Cost of living index (U.S. average is 100)
95.4
83
If you make $50,000 in Riverside, you will have to make $57,470 in Fort Worth to maintain the same standard of living.
Geographical Conditions
Fort Worth spreads over rolling hills and prairies, and has several lakes. Riverside is bordered by the Santa Ana River and has a beautiful backdrop of mountains, making for very different geographical conditions in the two cities.
Education is a strong point for both cities. Fort Worth boasts excellent public and private schools, as well as higher education institutions such as Texas Christian University. Riverside is home to the highly respected University of California, Riverside, and a number of other quality schools. Both cities take pride in their dedicated educators and innovative education approaches.
Economically, Fort Worth has a strong and diverse economy with a focus on industries including aerospace, defense, and logistics. Riverside's economy, on the other hand, is more weighted towards the service sector with a strong emphasis on education, healthcare, and retail sectors. Both cities boast growing economies and host a number of Fortune 500 companies.
Biggest Employers
The biggest employers in Fort Worth are American Airlines, Lockheed Martin, and the Fort Worth Independent School District. In Riverside, the largest employers include the University of California, Riverside, Riverside Community Hospital, and the Riverside Unified School District.
There were 7,236 building permits issued in Fort Worth in 2012 (4810 more than in 2011) compared to 293 building permits issued in Riverside in 2012 (250 more than in 2011).
In Fort Worth (Tarrant County), 41.4% voted for Democrats and 57.1% for Republicans in 2012 Presidential Election. In Riverside (Riverside County), 49.6% voted for Democrats and 48.0% for Republicans.
Elections
Type
Democrats
Republicans
Other
Year
Fort Worth
Riverside
Fort Worth
Riverside
Fort Worth
Riverside
2020
49.3%
53.0%
49.1%
45.0%
1.6%
2.0%
2016
43.2%
49.7%
51.8%
44.4%
5.0%
5.9%
2012
41.4%
49.6%
57.1%
48.0%
1.4%
2.4%
2008
43.8%
50.4%
55.5%
48.1%
0.7%
1.5%
2004
37.0%
41.3%
62.5%
58.2%
0.5%
0.6%
2000
36.9%
45.0%
60.9%
51.6%
2.3%
3.4%
1996
41.6%
43.0%
50.9%
45.6%
7.5%
11.3%
Breakdown of population affiliated with a religious congregation
Type
Adherents
Congregations
Religion
Fort Worth
Riverside
Fort Worth
Riverside
SOUTHERN BAPTIST CONVENTION
17.3%
1.2%
33.3%
11.2%
CATHOLIC CHURCH
11.1%
27.5%
1.9%
4.5%
MUSLIM ESTIMATE
2.2%
0.5%
0.9%
0.7%
LUTHERAN CHURCH
0.5%
0.3%
0.9%
1.8%
SEVENTH DAY ADVENTIST CHURCH
0.4%
0.9%
1.6%
3.4%
EPISCOPAL CHURCH
0.3%
0.2%
0.8%
1.4%
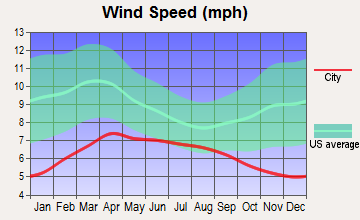
Weather
Weather-wise, the climates of these two cities are drastically different. Fort Worth, situated in North Texas, experiences a humid subtropical climate with hot summers and mild winters. Riverside, in contrast, enjoys a Mediterranean climate with warm, dry summers and mild, wet winters, generally boasting more sunshine and less annual rainfall than Fort Worth.
Weather and climate
Type
Fort Worth
Riverside
Temperature - Average
65°F
66°F
Humidity - Average morning or afternoon humidity
71.4%
66.7%
Humidity - Differences between morning and afternoon humidity
34.1%
21.4%
Humidity - Maximum monthly morning or afternoon humidity
82.1%
73.5%
Humidity - Minimum monthly morning or afternoon humidity
48%
52.1%
Precipitation - Yearly average
35 in
10.3 in
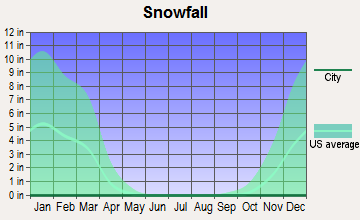
Snowfall - Yearly average
4.2 in
0 in
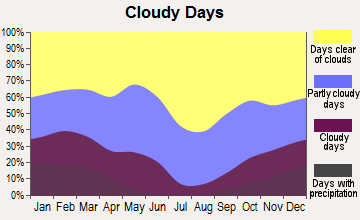
Clouds - Number of days clear of clouds
22.8%
27.3%
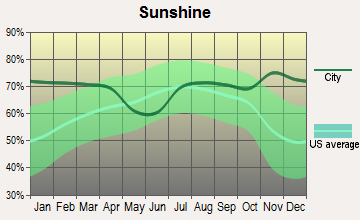
Sunshine amount - Average
66.6%
78.2%
Sunshine amount - Differences during a year
20%
21.5%
Sunshine amount - Maximum monthly
74%
84.2%
Sunshine amount - Minimum monthly
54%
62.6%
Wind speed - Average
10.3 mph
4.5 mph
Average climate in Fort Worth, Texas
Average climate in Riverside, California
Air pollution
Type
AQI
CO
NO2
OZONE
PB
PM10
PM25
SO2
Year
Fort Worth
Riverside
Fort Worth
Riverside
Fort Worth
Riverside
Fort Worth
Riverside
Riverside
Riverside
Fort Worth
Riverside
Fort Worth
Riverside
2018
67
153
N/A
0.35
5.8
14.4
27.1
29.8
0.006
N/A
44.6
N/A
N/A
13.6
N/A
0.4
2017
67
151
N/A
0.34
6.2
14.7
27.2
31.5
0.004
N/A
48.4
N/A
N/A
14.8
N/A
0.3
2016
56
140
N/A
0.33
6.3
14.8
25.5
30.9
0.006
N/A
44.4
N/A
N/A
14.5
N/A
0.2
2015
61
147
N/A
0.33
6.5
14.5
24.8
30.8
0.004
N/A
43.6
N/A
N/A
15.4
N/A
0.3
2014
56
147
0.22
0.37
6.8
15.9
26.6
30.7
0.006
N/A
34.1
N/A
N/A
16.5
N/A
0.3
2013
64
147
0.25
0.38
6.4
16.4
26.5
29.2
0.006
N/A
33.2
N/A
N/A
16.4
N/A
0.2
2012
87
148
0.26
0.35
7.8
16.4
30.3
30.2
0.007
N/A
32.3
N/A
N/A
16.0
N/A
0.3
2011
79
150
0.23
0.37
7.9
16.3
30.7
32.0
0.006
N/A
33.1
N/A
N/A
15.2
N/A
0.3
2010
70
144
0.23
0.42
8.5
17.8
27.7
30.9
0.008
N/A
31.9
N/A
N/A
15.5
N/A
1.3
2009
81
151
0.25
0.37
8.7
20.0
29.5
29.0
0.009
N/A
38.0
N/A
N/A
19.6
N/A
1.5
2008
69
157
0.25
0.41
9.6
20.5
25.8
30.0
0.010
N/A
43.6
N/A
N/A
16.3
N/A
0.9
2007
75
135
0.30
0.65
10.6
20.8
24.6
28.3
0.011
N/A
N/A
N/A
N/A
N/A
N/A
1.6
2006
90
129
0.34
0.58
10.2
21.0
29.7
28.0
0.005
N/A
N/A
N/A
N/A
N/A
N/A
1.4
2005
102
134
0.34
0.53
10.9
22.8
28.4
27.3
0.012
N/A
N/A
N/A
11.3
N/A
0.9
3.3
2004
78
142
0.39
0.72
10.6
18.5
25.4
29.5
0.013
N/A
N/A
N/A
N/A
N/A
N/A
3.1
2003
82
144
0.40
0.75
11.1
22.7
27.2
28.5
0.013
N/A
N/A
N/A
N/A
N/A
N/A
2.0
2002
94
142
0.37
0.82
11.8
24.9
25.8
28.5
0.015
N/A
N/A
N/A
N/A
N/A
N/A
0.2
2001
16
145
0.48
0.79
N/A
25.7
N/A
26.1
0.025
N/A
N/A
N/A
N/A
N/A
N/A
0.9
2000
17
157
0.55
0.82
N/A
24.2
N/A
25.0
0.031
N/A
N/A
N/A
N/A
N/A
N/A
1.2
Natural disasters
Type
Fort Worth
Riverside
Tornado activity compared to U.S. average
249.6%
17.4%
Earthquake activity compared to U.S. average
562.8%
7,322.6%
Natural disasters compared to U.S. average
23%
46%
Transportation
Both cities have reliable public transit systems. Fort Worth has the Trinity Metro, while Riverside has the Riverside Transit Agency. Both cities are also car-centric, with many residents relying on personal vehicles for commuting. However, traffic can be challenging, particularly in Riverside due to its proximity to Los Angeles.
Transport
Type
Fort Worth
Riverside
Amtrak stations
1
1
Amtrak stations nearby
1
3
FAA registered aircraft
2
307
FAA registered aircraft manufacturers and dealers
19
15
Means of transportation to work
Type
Fort Worth
Riverside
Bicycle
0.1%
0.5%
Bus
0.4%
0.9%
Carpooled
11%
9%
Car alone
85.8%
85.7%
Motorcycle
0.1%
0.3%
Railroad
0%
0.4%
Walked
1.3%
2.3%
Average travel time to work
Type
Fort Worth
Riverside
Average
28.5 min
31.3 min
Other means
25.3 min
28.7 min
Public transportation
41.8 min
45.3 min
Private vehicle occupancy
Type
Fort Worth
Riverside
Average
1.2
1.1
Drove alone
87.6%
89.1%
In 2 person carpool
8.5%
8.4%
In 3 person carpool
2.5%
2%
In 4 person carpool
1.1%
0.2%
In 5-6 person carpool
0.3%
0.2%
In 7+ person carpool
0.1%
0.1%
How many people usually rode to work in the car, truck or van.
Real Estate
Real estate in Fort Worth is much more affordable than in Riverside. The median home price in Fort Worth is significantly lower, making it a more appealing city for home buyers. Riverside, however, offers a diverse real estate market, with properties ranging from affordable starter homes to luxury estates.
Neighborhoods
Fort Worth is known for its vibrant neighborhoods, including the historic Stockyards, the cultural hub of the Near Southside, and the affluent Westover Hills. Riverside likewise offers a range of neighborhoods, boasting areas with historic homes, such as the Wood Streets, and upscale communities like Canyon Crest.
Houses and residents
Type
Fort Worth
Riverside
Houses
361,341
94,246
Average household size (people)
2.8
3.2
Median year apartment built
1991
1982
Median year house/condo built
1995
1974
Length of stay in the house since moving in
11.2 years
14.2 years
Houses occupied
334,286 (92.5%)
91,110 (96.7%)
Houses occupied by owners
185,197 (55.4%)
51,211 (56.2%)
Houses occupied by renters
149,089 (44.6%)
39,899 (43.8%)
Median rent asked for vacant for-rent units
$1,068
$1,277
Median monthly housing costs
$1,328
$1,680
Median price asked for vacant for-sale houses and condos
$288,576
$414,585
Estimated median house or condo value
$249,000
$483,300
Median numbers of rooms
5.3
5.2
Median number of rooms in apartments
4.2
3.9
Median number of rooms in houses and condos
6.3
6.1
Median house price - detached houses
$279,885
$548,362
Median house price - in 2-unit structures
Over $1,000,000
$525,372
Median house price - in 3-to-4-unit structures
$337,081
$450,463
Median house price - in 5 or more unit structures
$298,062
$408,213
Median house price - mobile homes
$58,470
$81,780
Median house price - Townhouses or other attached units
$279,957
$442,670
Median house price - All housing units
$279,281
$529,360
Median house age
29
44
Renting percentage
40.8%
44.3%
Housing density (houses/condos per square mile)
1,235.2
1,206.8
House value disparities
31.8%
21%
Household income disparities
43.6%
40.5%
Median household income for houses/condes with a mortgage
$106,170
$104,161
Median household income for apartments without a mortgage
$72,147
$71,925
Housing units without a mortgage
2,986 (2.4%)
393 (1%)
Housing units with both a second mortgage and home equity loan
3,696 (3%)
1,312 (3.3%)
Housing units with a mortgage
121,099 (97.6%)
39,744 (99%)
Housing units with a home equity loan
66 (0.1%)
123 (0.3%)
Housing units with a second mortgage
5,171 (4.2%)
2,112 (5.3%)
House/condo owner moved in on average (years ago)
8
13
House/condo renter moved in on average (years ago)
1
3
Housing units lacking complete kitchen facilities
1.8%
2.5%
Housing units lacking complete plumbing facilities
0.7%
0.4%
Housing units in structures
Housing units in structures
Fort Worth
Riverside
One, detached
65.4%
63.1%
One, attached
2.9%
5.6%
Two
1.6%
1.1%
3 or 4
4.1%
3.7%
5 to 9
5.8%
6.8%
10 to 19
6.5%
7.0%
20 to 49
4.6%
4.6%
50 or more
7.0%
6.4%
Mobile homes
2.1%
1.8%
Median real estate property taxes paid for housing units
Self-employed workers in own not incorporated business
27,257
8,164
State government workers
8,587
8,293
Unpaid family workers
392
199
Industries and Occupations
The primary industries in Fort Worth are aviation, defense, and logistics, while Riverside's leading industries are education, healthcare, and retail. Corresponding with these industries, the most common occupations in each city respectively are aircraft mechanics, registered nurses, and retail salespeople. Manufacturing also plays a significant role in both cities.
In terms of health care, Fort Worth has state-of-the-art hospitals and clinics including the Texas Health Resources and Cook Children’s Medical Center. Riverside is also known for its excellent healthcare facilities, with Riverside Community Hospital and Kaiser Permanente among its top providers.
Health (county statistics)
Type
Fort Worth
Riverside
General health status score of residents in this county from 1 (poor) to 5 (excellent)
Both Fort Worth and Riverside have well-developed infrastructures, with extensive roads, public transit systems, and utilities. Riverside's location in Southern California provides easy access to major cities such as Los Angeles and San Diego, while Fort Worth's central U.S. location positions it as a major transportation hub.
Infrastructure
Type
Fort Worth
Riverside
Hospitals
76
20
TV stations
25
5
Bank branches located here
175
61
Bank institutions located here
42
18
Main business address for public companies
24
2
Drinking water stations with no reported violations in the past
3
2
Drinking water stations with reported violations in the past
HMDA - Conventional home purchase loans - Applications denied
Year
Fort Worth
Riverside
1999
3,575
794
2000
2,473
375
2001
2,109
310
2002
1,701
405
2003
2,183
1,399
2004
3,202
1,892
2005
4,261
2,728
2006
4,161
3,235
2007
2,871
1,568
2008
1,256
544
2009
585
285
Culture and Food
Both cities boast diverse cultures with unique food scenes. Fort Worth is famous for its Tex-Mex cuisine and world-class barbecue. Riverside showcases a mix of traditional American and international flavors, with a notable emphasis on fresh, locally sourced foods due to its location in California's agricultural region.
Sports Teams
Fort Worth residents are die-hard fans of the Dallas Cowboys (NFL), Texas Rangers (MLB), and the Dallas Stars (NHL). Meanwhile, Riverside doesn't have any major league teams of its own but is situated close enough to Los Angeles for residents to support teams like the Lakers (NBA), Dodgers (MLB), and Kings (NHL).


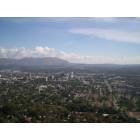
 Fort Worth, TX
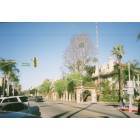
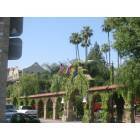
 Riverside, CA