
Relative area comparison
 Fort Worth, TX
 Lubbock, TX

 | 2020s Midpoint: Top 50 US Cities... (376 replies) |
| Rank The Major American Metros by Climate (230 replies) |
| Demographics Thread - 2023 (221 replies) |
| Top 200 Most Influential Urban Areas in the USA (186 replies) |
| City/Metro Homicides of 2022 (2524 replies) |
| Control city on highway signs in your state (224 replies) |
Fort Worth, TX and
Lubbock, TX : 268.9 miles
Fort Worth's population is larger by 258%. Its population has grown by 400,814 people (75.0%) since 2000. The population of Lubbock has grown by 61,429 people (30.8%) during that time.
| Population | ||
| Type | Fort Worth | Lubbock |
|---|---|---|
| Population | 935,508 | 260,993 |
| Female / male percentage | 52.2% / 47.8%
|
51.6% / 48.4%
|
According to our data, there are 3,152 registered sex offenders living in Fort Worth and 599 registered sex offenders living in .
The ratio of residents to sex offenders in Fort Worth is 272 to 1; the ratio in Lubbock is 422 to 1.
The number of registered sex offenders compared to the number of residents is larger in Fort Worth than in Lubbock.
| Income | ||
| Type | Fort Worth | Lubbock |
|---|---|---|
| Estimated median household income | $68,235 | $54,747 |
| Estimated per capita income | $34,106 | $30,618 |
| Cost of living index (U.S. average is 100) | 95.4 | 83.8 |
If you make $50,000 in Lubbock, you will have to make $56,921 in Fort Worth to maintain the same standard of living.
| Geographical information | ||
| Type | Fort Worth | Lubbock |
|---|---|---|
| Land area | 292.5 sq. miles | 114.8 sq. miles |
| Population density | 3,197.9 people per sq. mile | 2,273.3 people per sq. mile |
Fort Worth, TX
Lubbock, TX
| Education level (25-year-olds and older) | ||
| Type | Fort Worth | Lubbock |
|---|---|---|
| Bachelor's degree or higher | 31.6% | 34.2% |
| Graduate or professional degree | 11.5% | 13.4% |
| High school or higher | 83.4% | 89.8% |
There were 7,236 building permits issued in Fort Worth in 2012 (4810 more than in 2011) compared to 2,454 building permits issued in Lubbock in 2012 (1825 more than in 2011).
In Fort Worth (Tarrant County), 41.4% voted for Democrats and 57.1% for Republicans in 2012 Presidential Election. In Lubbock (Lubbock County), 28.8% voted for Democrats and 69.6% for Republicans.
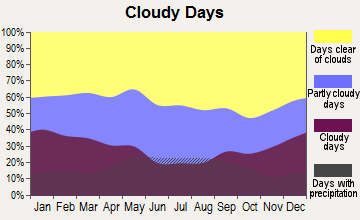
| Weather and climate | ||
| Type | Fort Worth | Lubbock |
|---|---|---|
| Temperature - Average | 65°F | 59.7°F |
| Humidity - Average morning or afternoon humidity | 71.4% | 64.4% |
| Humidity - Differences between morning and afternoon humidity | 34.1% | 42.3% |
| Humidity - Maximum monthly morning or afternoon humidity | 82.1% | 79.7% |
| Humidity - Minimum monthly morning or afternoon humidity | 48% | 37.4% |
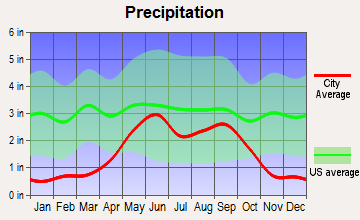
| Precipitation - Yearly average | 35 in | 19 in |
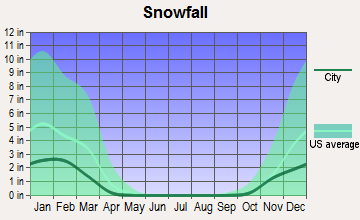
| Snowfall - Yearly average | 4.2 in | 16.7 in |
| Clouds - Number of days clear of clouds | 22.8% | 26.6% |
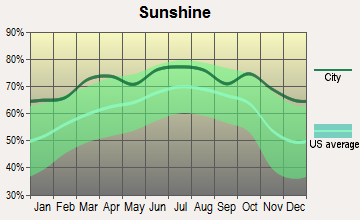
| Sunshine amount - Average | 66.6% | 78.7% |
| Sunshine amount - Differences during a year | 20% | 16.7% |
| Sunshine amount - Maximum monthly | 74% | 80% |
| Sunshine amount - Minimum monthly | 54% | 63.3% |
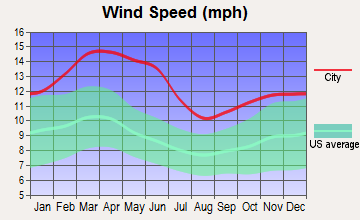
| Wind speed - Average | 10.3 mph | 12.8 mph |
| Natural disasters | ||
| Type | Fort Worth | Lubbock |
|---|---|---|
| Tornado activity compared to U.S. average | 249.6% | 166% |
| Earthquake activity compared to U.S. average | 562.8% | 535.5% |
| Natural disasters compared to U.S. average | 23% | 14% |
| Transport | ||
| Type | Fort Worth | Lubbock |
|---|---|---|
| Amtrak stations | 1 | 0 |
| Amtrak stations nearby | 1 | 0 |
| FAA registered aircraft | 2 | 293 |
| FAA registered aircraft manufacturers and dealers | 19 | 0 |
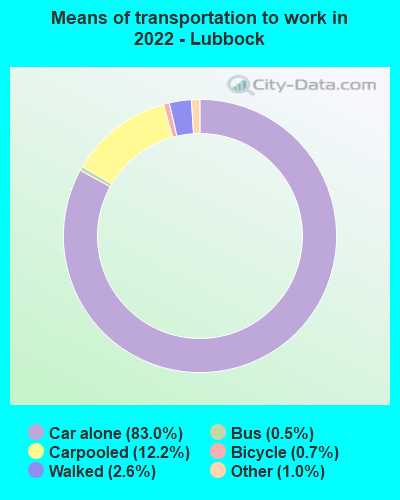
| Means of transportation to work | ||
| Type | Fort Worth | Lubbock |
|---|---|---|
| Bicycle | 0.1% | 0.3% |
| Bus | 0.4% | 0.8% |
| Carpooled | 11% | 9.6% |
| Car alone | 85.8% | 86.4% |
| Motorcycle | 0.1% | 0.2% |
| Walked | 1.3% | 1.9% |
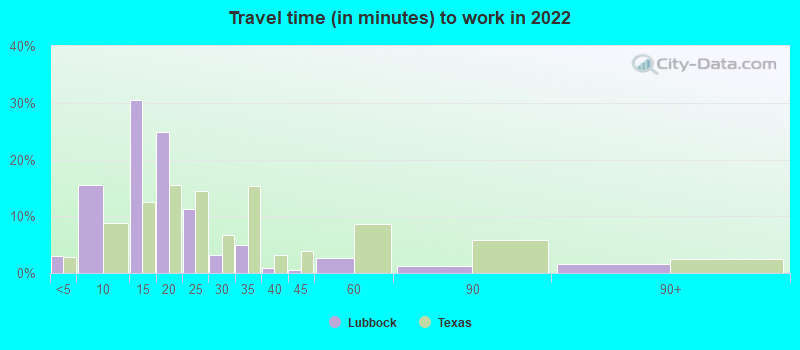
| Average travel time to work | ||
| Type | Fort Worth | Lubbock |
|---|---|---|
| Average | 28.5 min | 18.2 min |
| Other means | 25.3 min | 18 min |
| Public transportation | 41.8 min | 31.3 min |
| Private vehicle occupancy | ||
| Type | Fort Worth | Lubbock |
|---|---|---|
| Average | 1.2 | 1.2 |
| Drove alone | 87.6% | 89.3% |
| In 2 person carpool | 8.5% | 7.9% |
| In 3 person carpool | 2.5% | 1% |
| In 4 person carpool | 1.1% | 0.6% |
| In 5-6 person carpool | 0.3% | 1.2% |
How many people usually rode to work in the car, truck or van.
| Houses and residents | ||
| Type | Fort Worth | Lubbock |
|---|---|---|
| Houses | 361,341 | 113,800 |
| Average household size (people) | 2.8 | 2.5 |
| Median year apartment built | 1991 | 1985 |
| Median year house/condo built | 1995 | 1985 |
| Length of stay in the house since moving in | 11.2 years | 12.4 years |
| Houses occupied | 334,286 (92.5%) | 104,426 (91.8%) |
| Houses occupied by owners | 185,197 (55.4%) | 53,722 (51.4%) |
| Houses occupied by renters | 149,089 (44.6%) | 50,704 (48.6%) |
| Median rent asked for vacant for-rent units | $1,068 | $760.15 |
| Median monthly housing costs | $1,328 | $1,010 |
| Median price asked for vacant for-sale houses and condos | $288,576 | $431,965 |
| Estimated median house or condo value | $249,000 | $171,400 |
| Median numbers of rooms | 5.3 | 5.2 |
| Median number of rooms in apartments | 4.2 | 4 |
| Median number of rooms in houses and condos | 6.3 | 6.2 |
| Median house price - detached houses | $279,885 | $217,964 |
| Median house price - in 2-unit structures | Over $1,000,000 | $266,863 |
| Median house price - in 3-to-4-unit structures | $337,081 | $270,056 |
| Median house price - in 5 or more unit structures | $298,062 | $186,477 |
| Median house price - mobile homes | $58,470 | $60,138 |
| Median house price - occupied boats, rvs, vans etc. | $16,069 | $28,841 |
| Median house price - Townhouses or other attached units | $279,957 | $159,383 |
| Median house price - All housing units | $279,281 | $215,105 |
| Median house age | 29 | 37 |
| Renting percentage | 40.8% | 45.4% |
| Housing density (houses/condos per square mile) | 1,235.2 | 991.2 |
| House value disparities | 31.8% | 37.4% |
| Household income disparities | 43.6% | 48.2% |
| Median household income for houses/condes with a mortgage | $106,170 | $96,150 |
| Median household income for apartments without a mortgage | $72,147 | $60,175 |
| Housing units without a mortgage | 2,986 (2.4%) | 244 (0.8%) |
| Housing units with both a second mortgage and home equity loan | 3,696 (3%) | 577 (1.9%) |
| Housing units with a mortgage | 121,099 (97.6%) | 29,683 (99.2%) |
| Housing units with a home equity loan | 66 (0.1%) | 0 (0%) |
| Housing units with a second mortgage | 5,171 (4.2%) | 705 (2.4%) |
| House/condo owner moved in on average (years ago) | 8 | 9 |
| House/condo renter moved in on average (years ago) | 1 | 1 |
| Housing units lacking complete kitchen facilities | 1.8% | 2.9% |
| Housing units lacking complete plumbing facilities | 0.7% | 1.9% |
| Median real estate property taxes paid for housing units | ||
| Type | Fort Worth | Lubbock |
|---|---|---|
| With mortgages | $5,254 (2%) | $3,594 (1.9%) |
| With no mortgages | $3,121 (1.5%) | $2,170 (1.4%) |
| Health (county statistics) | ||
| Type | Fort Worth | Lubbock |
|---|---|---|
| General health status score of residents in this county from 1 (poor) to 5 (excellent) | 3.4 | 3.3 |
| Average weight of females (lbs) | 159 lbs | 157.6 lbs |
| Average weight of males (lbs) | 197.2 lbs | 193.2 lbs |
| Residents exercised in the past month | 72.8% | 64.3% |
| Adult residents drank alcohol in the past 30 days | 74.1% | 40.6% |
| Residents smoked 100+ cigarettes in their lives | 42.6% | 41.8% |
| English speakers (speaking English at home) | ||
| Type | Fort Worth | Lubbock |
|---|---|---|
| Born in the United States residents | 89.1% | 88.4% |
| Foreign born residents | 10.1% | 18.2% |
| Native, born elsewhere residents | 47.6% | 65.7% |
| Total residents | 67.9% | 78.8% |
| Infrastructure | ||
| Type | Fort Worth | Lubbock |
|---|---|---|
| Hospitals | 76 | 36 |
| TV stations | 25 | 13 |
| Arenas or stadiums | 7 | 3 |
| Bank branches located here | 175 | 97 |
| Bank institutions located here | 42 | 22 |
| Main business address for public companies | 24 | 3 |
| Drinking water stations with no reported violations in the past | 3 | 3 |
| Drinking water stations with reported violations in the past | 19 | 22 |