When comparing Fort Worth, Texas to Jackson, Mississippi, you'll find differences and similarities in various dimensions such as crime and safety, weather, cost of living, and so on. The two cities boast unique cultural and geographical traits, catering to different tastes and preferences. For people seeking a bustling, modern city with a cowboy twist, Fort Worth is perfect. Jackson, on the other hand, stands out as a historical city, deeply rooted in Southern charm. This detailed comparison would give you insights into the experiences in both cities, whether you're planning to relocate permanently or merely exploring as a tourist.
Distance between
Fort Worth, TX and
Jackson, MS : 416.2 miles
Fort Worth's population is 5.2 times larger.Its population has grown by 400,814 people (75.0%) since 2000. The population of Jackson has decreased by 34,495 people (18.7%) during that time.
According to FBI crime reports, both cities deal with higher crime rates compared to the national average; however, Fort Worth has a slightly safer record than Jackson. Jackson ranks high for violent crimes, which is especially important for both relocating families and tourists to consider. Fort Worth, in contrast, continues to engage in community policing efforts to curb crime rates.
City-data.com crime index counts serious crimes and violent crime more heavily. It adjusts for the number of visitors and daily workers commuting into cities. (higher means more crime, U.S. average = 301.1)
City-data.com crime index counts serious crimes and violent crime more heavily. It adjusts for the number of visitors and daily workers commuting into cities. (higher means more crime, U.S. average = 301.1)
Sex Offenders
According to our data, there are 3,152 registered sex offenders living in Fort Worth and 607 registered sex offenders living in . The ratio of residents to sex offenders in Fort Worth is 272 to 1; the ratio in Jackson is 283 to 1. The number of registered sex offenders compared to the number of residents in Fort Worth is near to than in Jackson.
Cost of Living
The cost of living is noticeably cheaper in Jackson compared to Fort Worth, though both cities are still relatively affordable when compared to many other U.S cities. Housing stands as the most significant factor in the cost of living difference, with Jackson offering cheaper home prices.
Income Tax
Fort Worth residents enjoy the benefit of Texas not having any state income tax. However, in Jackson, the state of Mississippi levies an income tax ranging from 3% to 5%.
Property Tax
Property taxes vary widely in both cities, depending on the property's location and value. However, Texas, including Fort Worth, is known for having high property tax rates. Jackson and the rest of Mississippi enjoy much lower property tax rates.
Sales Tax
Sales tax in Fort Worth, Texas, is relatively high at 8.25%. However, there's no state income tax in Texas, which can compensate for the higher sales tax. Jackson, Mississippi, experiences a lesser sales tax rate at 7%, but Mississippi levies state income tax, which can range from 3% to 5%.
Income
Type
Fort Worth
Jackson
Estimated median household income
$68,235
$35,070
Estimated per capita income
$34,106
$21,684
Cost of living index (U.S. average is 100)
95.4
83.7
If you make $50,000 in Jackson, you will have to make $56,989 in Fort Worth to maintain the same standard of living.
Geographical Conditions
Fort Worth resides within the Cross Timbers region, resulting in a mix of cross timber, prairie, and rolling hills. On the other hand, Jackson sits atop an extinct volcanic chain and features diverse topographies with forests, rivers, and reservoirs.
Fort Worth houses numerous highly-rated public, private schools, and charter schools, as well as colleges and universities. Jackson, on the other hand, struggles with a lower average school rating but hosts a few internationally recognized Universities like Jackson State University.
Fort Worth's economy primarily focuses on sectors such as aerospace, technology, and healthcare. Jackson's economy leans on government, manufacturing, and health care sectors. The current economy in Fort Worth is more buoyant than Jackson's, boasting a lower unemployment rate and better job growth.
Biggest Employers
Fort Worth pride itself as a home to major employers, including American Airlines, Lockheed Martin Aeronautics, and Texas Health Resources. Jackson is mainly defined by public sector employers like the State of Mississippi, University of Mississippi Medical Center, and Jackson Public Schools.
There were 7,236 building permits issued in Fort Worth in 2012 (4810 more than in 2011) compared to 11 building permits issued in Jackson in 2012 (137 less than in 2011).
In Fort Worth (Tarrant County), 41.4% voted for Democrats and 57.1% for Republicans in 2012 Presidential Election. In Jackson (Hinds County), 71.7% voted for Democrats and 27.9% for Republicans.
Elections
Type
Democrats
Republicans
Other
Year
Fort Worth
Jackson
Fort Worth
Jackson
Fort Worth
Jackson
2020
49.3%
73.9%
49.1%
25.3%
1.6%
0.8%
2016
43.2%
71.1%
51.8%
26.6%
5.0%
2.3%
2012
41.4%
71.7%
57.1%
27.9%
1.4%
0.3%
2008
43.8%
69.6%
55.5%
30.4%
0.7%
0.0%
2004
37.0%
59.7%
62.5%
40.3%
0.5%
0.0%
2000
36.9%
53.6%
60.9%
43.3%
2.3%
3.1%
1996
41.6%
53.7%
50.9%
42.2%
7.5%
4.1%
Breakdown of population affiliated with a religious congregation
Type
Adherents
Congregations
Religion
Fort Worth
Jackson
Fort Worth
Jackson
SOUTHERN BAPTIST CONVENTION
17.3%
20.1%
33.3%
17.3%
CATHOLIC CHURCH
11.1%
3.0%
1.9%
2.2%
MUSLIM ESTIMATE
2.2%
0.3%
0.9%
0.5%
LUTHERAN CHURCH
0.5%
0.2%
0.9%
0.7%
SEVENTH DAY ADVENTIST CHURCH
0.4%
0.8%
1.6%
0.7%
EPISCOPAL CHURCH
0.3%
2.1%
0.8%
2.5%
PRESBYTERIAN CHURCH IN AMERICA
0.1%
1.9%
0.4%
3.2%
Weather
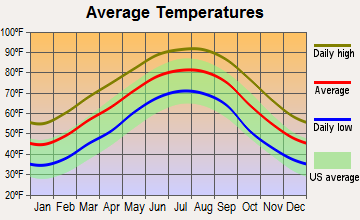
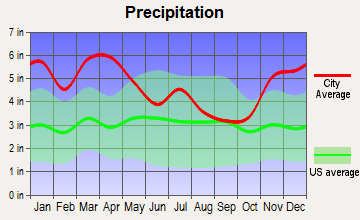
As for weather, Fort Worth has a humid subtropical climate, enjoying hot summers and mild winters with wet springs and falls. Jackson also experiences a humid subtropical climate but has hotter summers and a shorter cool season. Both cities are susceptible to severe weather conditions, like tornadoes, and it is relatively important to take note of these when visiting or planning to move.
Weather and climate
Type
Fort Worth
Jackson
Temperature - Average
65°F
64.1°F
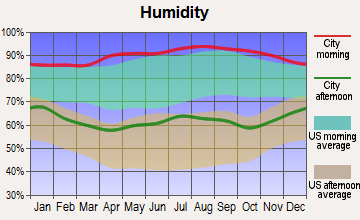
Humidity - Average morning or afternoon humidity
71.4%
79.4%
Humidity - Differences between morning and afternoon humidity
34.1%
40%
Humidity - Maximum monthly morning or afternoon humidity
82.1%
93%
Humidity - Minimum monthly morning or afternoon humidity
48%
53%
Precipitation - Yearly average
35 in
56 in
Snowfall - Yearly average
4.2 in
2 in
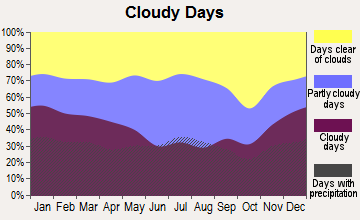
Clouds - Number of days clear of clouds
22.8%
18.6%
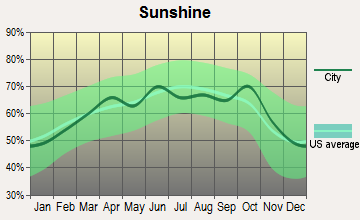
Sunshine amount - Average
66.6%
64.5%
Sunshine amount - Differences during a year
20%
23%
Sunshine amount - Maximum monthly
74%
70%
Sunshine amount - Minimum monthly
54%
47%
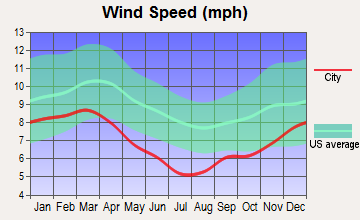
Wind speed - Average
10.3 mph
6.7 mph
Average climate in Fort Worth, Texas
Average climate in Jackson, Mississippi
Air pollution
Type
AQI
CO
NO2
OZONE
PM10
PM25
SO2
Year
Fort Worth
Jackson
Fort Worth
Jackson
Fort Worth
Jackson
Fort Worth
Jackson
Jackson
Fort Worth
Jackson
Fort Worth
Jackson
2018
67
80
N/A
0.14
5.8
6.8
27.1
26.5
20.4
N/A
N/A
9.8
N/A
0.5
2017
67
73
N/A
0.26
6.2
6.8
27.2
25.6
N/A
N/A
N/A
9.5
N/A
0.6
2016
56
70
N/A
0.22
6.3
6.4
25.5
27.0
N/A
N/A
N/A
9.5
N/A
0.5
2015
61
76
N/A
0.33
6.5
N/A
24.8
26.1
N/A
N/A
N/A
10.5
N/A
0.7
2014
56
75
0.22
0.22
6.8
N/A
26.6
25.3
N/A
N/A
N/A
10.9
N/A
0.7
2013
64
71
0.25
N/A
6.4
N/A
26.5
25.9
N/A
N/A
N/A
10.1
N/A
N/A
2012
87
73
0.26
N/A
7.8
N/A
30.3
27.9
N/A
N/A
N/A
10.5
N/A
N/A
2011
79
85
0.23
0.24
7.9
N/A
30.7
28.4
N/A
N/A
N/A
11.9
N/A
0.7
2010
70
73
0.23
N/A
8.5
N/A
27.7
27.6
N/A
N/A
N/A
11.0
N/A
N/A
2009
81
71
0.25
N/A
8.7
N/A
29.5
25.9
N/A
N/A
N/A
10.8
N/A
N/A
2008
69
74
0.25
N/A
9.6
N/A
25.8
27.8
N/A
N/A
N/A
11.7
N/A
N/A
2007
75
83
0.30
N/A
10.6
N/A
24.6
28.2
N/A
N/A
N/A
12.9
N/A
N/A
2006
90
85
0.34
N/A
10.2
N/A
29.7
32.5
N/A
N/A
N/A
12.0
N/A
N/A
2005
102
89
0.34
N/A
10.9
N/A
28.4
29.3
N/A
N/A
11.3
14.0
0.9
1.1
2004
78
84
0.39
N/A
10.6
N/A
25.4
25.2
N/A
N/A
N/A
12.5
N/A
0.9
2003
82
79
0.40
N/A
11.1
N/A
27.2
26.0
N/A
N/A
N/A
13.1
N/A
1.3
2002
94
72
0.37
N/A
11.8
N/A
25.8
25.4
N/A
N/A
N/A
12.9
N/A
1.5
2001
16
62
0.48
N/A
N/A
N/A
N/A
28.3
N/A
N/A
N/A
N/A
N/A
1.6
2000
17
73
0.55
N/A
N/A
N/A
N/A
31.4
N/A
N/A
N/A
N/A
N/A
1.5
Natural disasters
Type
Fort Worth
Jackson
Tornado activity compared to U.S. average
249.6%
268.3%
Earthquake activity compared to U.S. average
562.8%
301.5%
Natural disasters compared to U.S. average
23%
14%
Transportation
Transportation is more developed in Fort Worth, with Trinity Metro providing public transportation, including buses and rail. Fort Worth also facilitates better commuting with its accessible highways and roads. Jackson's public transportation, operated by JATRAN, offers fewer routes and schedules, making commuting with public transit limited.
Transport
Type
Fort Worth
Jackson
Amtrak stations
1
1
Amtrak stations nearby
1
1
FAA registered aircraft
2
102
FAA registered aircraft manufacturers and dealers
19
0
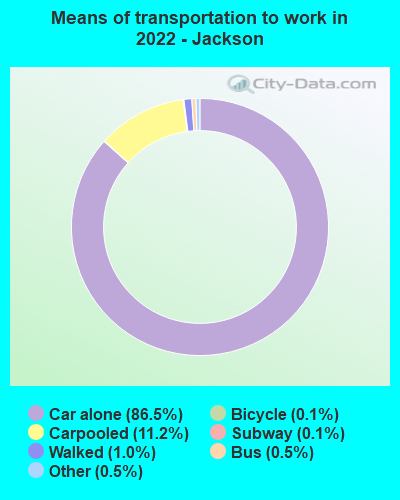
Means of transportation to work
Type
Fort Worth
Jackson
Bicycle
0.1%
0.1%
Bus
0.4%
0.5%
Carpooled
11%
10.8%
Car alone
85.8%
86.9%
Motorcycle
0.1%
0%
Subway
0%
0.1%
Taxicab
0.1%
0.2%
Walked
1.3%
1%
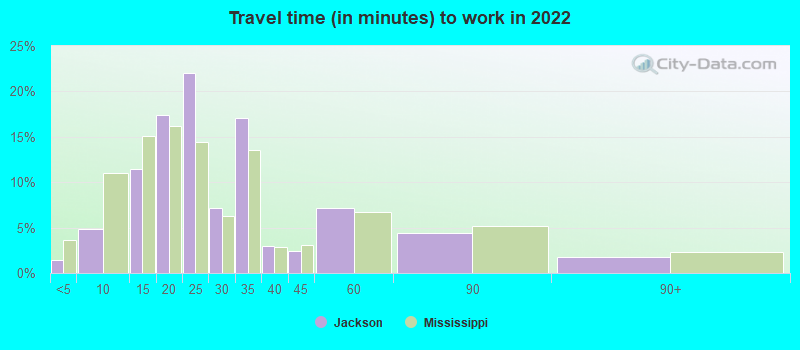
Average travel time to work
Type
Fort Worth
Jackson
Average
28.5 min
26.9 min
Other means
25.3 min
20.4 min
Public transportation
41.8 min
37.7 min
Private vehicle occupancy
Type
Fort Worth
Jackson
Average
1.2
1.2
Drove alone
87.6%
87.3%
In 2 person carpool
8.5%
9.7%
In 3 person carpool
2.5%
1.8%
In 4 person carpool
1.1%
0.5%
In 5-6 person carpool
0.3%
0.2%
How many people usually rode to work in the car, truck or van.
Real Estate
Real estate in Fort Worth is more expensive than in Jackson. However, the housing market is more robust in Fort Worth, with better turnover rates and a greater appreciation for property values.
Neighborhoods
Fort Worth boasts diverse and vibrant neighborhoods like Sundance Square, Arlington Heights, and Tanglewood, offering a variety of entertainment, dining options, and cultural attractions. Jackson's neighborhoods like Fondren and Belhaven are known for their southern charm, arts, music scenes, and historic homes.
Houses and residents
Type
Fort Worth
Jackson
Houses
361,341
74,637
Average household size (people)
2.8
2.6
Median year apartment built
1991
1969
Median year house/condo built
1995
1966
Length of stay in the house since moving in
11.2 years
16.8 years
Houses occupied
334,286 (92.5%)
62,140 (83.3%)
Houses occupied by owners
185,197 (55.4%)
28,891 (46.5%)
Houses occupied by renters
149,089 (44.6%)
33,249 (53.5%)
Median rent asked for vacant for-rent units
$1,068
$636.86
Median monthly housing costs
$1,328
$887
Median price asked for vacant for-sale houses and condos
$288,576
$93,133
Estimated median house or condo value
$249,000
$101,500
Median numbers of rooms
5.3
5.3
Median number of rooms in apartments
4.2
4.7
Median number of rooms in houses and condos
6.3
6.7
Median house price - detached houses
$279,885
$157,221
Median house price - in 2-unit structures
Over $1,000,000
$112,007
Median house price - in 3-to-4-unit structures
$337,081
$66,599
Median house price - in 5 or more unit structures
$298,062
$140,616
Median house price - mobile homes
$58,470
$50,741
Median house price - Townhouses or other attached units
$279,957
$230,182
Median house price - All housing units
$279,281
$155,015
Median house age
29
54
Renting percentage
40.8%
46.9%
Housing density (houses/condos per square mile)
1,235.2
711.5
House value disparities
31.8%
48.4%
Household income disparities
43.6%
48.8%
Median household income for houses/condes with a mortgage
$106,170
$60,786
Median household income for apartments without a mortgage
$72,147
$38,610
Housing units without a mortgage
2,986 (2.4%)
211 (1.4%)
Housing units with both a second mortgage and home equity loan
3,696 (3%)
748 (5.1%)
Housing units with a mortgage
121,099 (97.6%)
14,400 (98.6%)
Housing units with a home equity loan
66 (0.1%)
219 (1.5%)
Housing units with a second mortgage
5,171 (4.2%)
1,482 (10.1%)
House/condo owner moved in on average (years ago)
8
18
House/condo renter moved in on average (years ago)
1
1
Housing units lacking complete kitchen facilities
1.8%
6.7%
Housing units lacking complete plumbing facilities
0.7%
9.2%
Housing units in structures
Housing units in structures
Fort Worth
Jackson
One, detached
65.4%
68.3%
One, attached
2.9%
1.4%
Two
1.6%
2.0%
3 or 4
4.1%
5.3%
5 to 9
5.8%
9.7%
10 to 19
6.5%
4.8%
20 to 49
4.6%
3.5%
50 or more
7.0%
4.0%
Mobile homes
2.1%
1.2%
Median real estate property taxes paid for housing units
Self-employed workers in own not incorporated business
27,257
4,044
State government workers
8,587
7,585
Unpaid family workers
392
34
Industries and Occupations
In Fort Worth, the top industries are aeronautics, healthcare, and telecommunications, whereas in Jackson, the prominent sectors include government, manufacturing, and healthcare. Both cities have considerable career opportunities in their respective dominant sectors.
Both cities have excellent healthcare facilities. Fort Worth is close to Dallas, home to some world-class medical institutions. Jackson hosts the state’s only academic medical center.
Health (county statistics)
Type
Fort Worth
Jackson
General health status score of residents in this county from 1 (poor) to 5 (excellent)
Both cities have architectural charm, though Fort Worth offers more modern developed infrastructure. Jackson has a historical feel to its buildings, and it has been making efforts to improve infrastructure. Many roads and buildings in Jackson, however, are in need of repair.
Infrastructure
Type
Fort Worth
Jackson
Hospitals
76
24
TV stations
25
13
Arenas or stadiums
7
2
Bank branches located here
175
61
Bank institutions located here
42
12
Main business address for public companies
24
4
Drinking water stations with no reported violations in the past
3
1
Drinking water stations with reported violations in the past
HMDA - Conventional home purchase loans - Applications denied
Year
Fort Worth
Jackson
1999
3,575
742
2000
2,473
683
2001
2,109
665
2002
1,701
611
2003
2,183
674
2004
3,202
1,025
2005
4,261
1,673
2006
4,161
1,699
2007
2,871
925
2008
1,256
319
2009
585
94
Culture and Food
Both cities offer rich cultural experiences. Fort Worth showcases a unique blend of cowboy culture and modern arts, whereas Jackson is rooted in deep southern tradition and history. Fort Worth is known for its BBQ and Mexican food, while Jackson is famed for its soul food and seafood.
Sports Teams
Sports enthusiasts would love Fort Worth for being close to Dallas, and enjoying access to teams like Dallas Cowboys (NFL), Texas Rangers (MLB), and Dallas Mavericks (NBA). Jackson lacks major league sports teams but supports local college and minor league sports.


 Fort Worth, TX
 Jackson, MS