Living in Fort Worth and Irving, both based in Texas, offers unique experiences based on their cultural histories, geographic locations, economic dynamics, and the quality of life. Both cities have their own charm and character, but also distinct differences. Exploring areas like crime and safety, weather, cost of living, employment opportunities, education, and healthcare, will offer insights into what life is like in each city and aid in making an informed decision should you consider relocating or just visiting.
Distance between
Fort Worth, TX and
Irving, TX : 22.6 miles
Fort Worth's population is larger by 268%. Its population has grown by 400,814 people (75.0%) since 2000. The population of Irving has grown by 62,583 people (32.7%) during that time.
Crime rates in both Irving and Fort Worth are above the national average, with Fort Worth slightly higher. However, Fort Worth has been working diligently on its community policing efforts, which has seen some reduction in crime. Irving has a relatively lower crime rate, making it slightly safer. However, it's essential to keep in mind that crime can vary greatly from neighborhood to neighborhood in both cities.
City-data.com crime index counts serious crimes and violent crime more heavily. It adjusts for the number of visitors and daily workers commuting into cities. (higher means more crime, U.S. average = 301.1)
City-data.com crime index counts serious crimes and violent crime more heavily. It adjusts for the number of visitors and daily workers commuting into cities. (higher means more crime, U.S. average = 301.1)
Sex Offenders
According to our data, there are 3,152 registered sex offenders living in Fort Worth and 172 registered sex offenders living in . The ratio of residents to sex offenders in Fort Worth is 272 to 1; the ratio in Irving is 1,385 to 1. The number of registered sex offenders compared to the number of residents is much larger in Fort Worth than that in Irving.
Cost of Living
The cost of living in Fort Worth is slightly lower than in Irving. Housing tends to be less expensive in Fort Worth, while groceries, utilities, and transportation are somewhat lower in Irving. Healthcare costs are comparable in both cities.
Income Tax
There's no state or city income tax in Texas, which applies to both Fort Worth and Irving.
Property Tax
Property taxes in the state of Texas are relatively high. However, Fort Worth has a somewhat lower property tax rate than Irving.
Sales Tax
Texas as a state does not have an income tax which applies to both cities. However, Fort Worth has a slightly lower sales tax rate than Irving.
Income
Type
Fort Worth
Irving
Estimated median household income
$68,235
$70,340
Estimated per capita income
$34,106
$36,210
Cost of living index (U.S. average is 100)
95.4
95.5
If you make $50,000 in Fort Worth, you will have to make $50,052 in Irving to maintain the same standard of living.
Geographical Conditions
Fort Worth is situated inland, characterized by its mostly flat landscape with few hills. Irving is closer to the Dallas/Fort Worth International Airport and has mostly flat and arable land.
Irving boasts higher educational statistics than Fort Worth. Irving Independent School District has a high graduation rate and several blue-ribbon schools. Comparatively, Fort Worth Independent School District has struggled to match Irving's success, but there are still many great schools in the district.
Both cities have robust economies, with Fort Worth traditionally having a stronger focus on manufacturing, while Irving is known for its tech industry. The unemployment rate is lower in Irving, and they offer higher average salaries than in Fort Worth.
Biggest Employers
Fort Worth's biggest employers include American Airlines, Lockheed Martin, and Texas Health Resources. Irving boasts several large employers as well, such as ExxonMobil, Verizon, and Citi Group.
There were 7,236 building permits issued in Fort Worth in 2012 (4810 more than in 2011) compared to 366 building permits issued in Irving in 2012 (26 more than in 2011).
In Fort Worth (Tarrant County), 41.4% voted for Democrats and 57.1% for Republicans in 2012 Presidential Election. In Irving (Dallas County), 57.3% voted for Democrats and 41.8% for Republicans.
Elections
Type
Democrats
Republicans
Other
Year
Fort Worth
Irving
Fort Worth
Irving
Fort Worth
Irving
2020
49.3%
65.1%
49.1%
33.4%
1.6%
1.4%
2016
43.2%
60.8%
51.8%
34.7%
5.0%
4.5%
2012
41.4%
57.3%
57.1%
41.8%
1.4%
1.0%
2008
43.8%
57.4%
55.5%
42.0%
0.7%
0.6%
2004
37.0%
49.0%
62.5%
50.4%
0.5%
0.5%
2000
36.9%
45.0%
60.9%
52.7%
2.3%
2.4%
1996
41.6%
46.0%
50.9%
46.8%
7.5%
7.2%
Breakdown of population affiliated with a religious congregation
Type
Adherents
Congregations
Religion
Fort Worth
Irving
Fort Worth
Irving
SOUTHERN BAPTIST CONVENTION
17.3%
11.0%
33.3%
31.1%
CATHOLIC CHURCH
11.1%
18.9%
1.9%
2.4%
MUSLIM ESTIMATE
2.2%
3.6%
0.9%
1.1%
LUTHERAN CHURCH
0.5%
0.3%
0.9%
0.7%
SEVENTH DAY ADVENTIST CHURCH
0.4%
0.5%
1.6%
1.7%
EPISCOPAL CHURCH
0.3%
1.0%
0.8%
1.5%
EVANGELICAL LUTHERAN CHURCH IN AMERICA
0.3%
0.3%
0.9%
0.9%
Weather
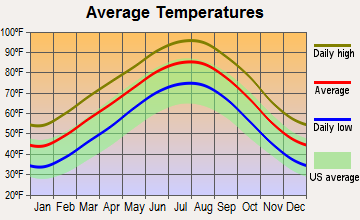
Both cities experience a hot, humid summer and mild to cold winters. Fort Worth tends to be slightly hotter than Irving because of its inland location and exposure to the winds from the Mexican Gulf. Tornadoes can occur in both cities, but with the right safety precautions, this should not be a major concern for both residents and tourists.
Weather and climate
Type
Fort Worth
Irving
Temperature - Average
65°F
65.6°F
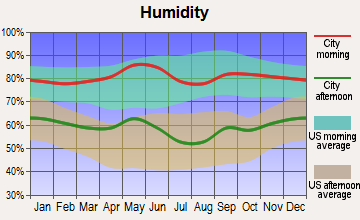
Humidity - Average morning or afternoon humidity
71.4%
71.3%
Humidity - Differences between morning and afternoon humidity
34.1%
34%
Humidity - Maximum monthly morning or afternoon humidity
82.1%
82%
Humidity - Minimum monthly morning or afternoon humidity
48%
48%
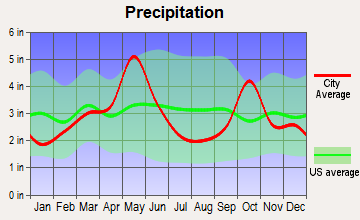
Precipitation - Yearly average
35 in
35.2 in
Snowfall - Yearly average
4.2 in
4.2 in
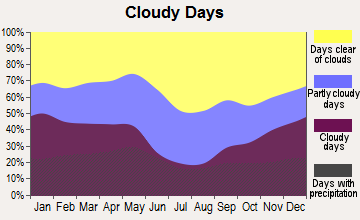
Clouds - Number of days clear of clouds
22.8%
22.8%
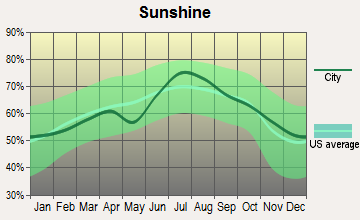
Sunshine amount - Average
66.6%
66.6%
Sunshine amount - Differences during a year
20%
20%
Sunshine amount - Maximum monthly
74%
74%
Sunshine amount - Minimum monthly
54%
54%
Wind speed - Average
10.3 mph
10.3 mph
Average climate in Fort Worth, Texas
Average climate in Irving, Texas
Air pollution
Type
AQI
CO
NO2
OZONE
PB
PM25
SO2
Year
Fort Worth
Irving
Fort Worth
Irving
Fort Worth
Irving
Fort Worth
Irving
Irving
Fort Worth
Irving
Fort Worth
Irving
2018
67
86
N/A
N/A
5.8
5.8
27.1
28.6
N/A
N/A
N/A
9.7
N/A
0.4
2017
67
84
N/A
N/A
6.2
5.7
27.2
28.9
N/A
N/A
N/A
9.1
N/A
0.3
2016
56
81
N/A
N/A
6.3
6.2
25.5
27.3
N/A
N/A
N/A
8.4
N/A
0.2
2015
61
83
N/A
N/A
6.5
6.6
24.8
26.9
N/A
N/A
N/A
8.9
N/A
0.3
2014
56
83
0.22
0.22
6.8
6.4
26.6
28.0
N/A
N/A
N/A
9.9
N/A
0.3
2013
64
96
0.25
0.25
6.4
7.0
26.5
29.1
N/A
N/A
N/A
13.0
N/A
0.2
2012
87
112
0.26
0.26
7.8
8.4
30.3
31.4
N/A
N/A
N/A
12.0
N/A
0.3
2011
79
97
0.23
0.23
7.9
8.9
30.7
31.3
N/A
N/A
N/A
11.9
N/A
0.6
2010
70
76
0.23
0.23
8.5
9.2
27.7
28.5
N/A
N/A
N/A
N/A
N/A
0.7
2009
81
88
0.25
0.25
8.7
9.1
29.5
29.3
N/A
N/A
N/A
N/A
N/A
0.5
2008
69
88
0.25
0.25
9.6
9.8
25.8
29.0
0.121
N/A
N/A
N/A
N/A
0.5
2007
75
94
0.30
0.30
10.6
10.8
24.6
26.0
0.070
N/A
N/A
N/A
N/A
0.3
2006
90
105
0.34
0.34
10.2
10.7
29.7
30.8
0.106
N/A
N/A
N/A
N/A
0.7
2005
102
110
0.34
0.34
10.9
12.7
28.4
30.0
0.142
N/A
11.3
11.1
0.9
0.9
2004
78
96
0.39
0.39
10.6
11.9
25.4
26.6
0.099
N/A
N/A
N/A
N/A
0.8
2003
82
102
0.40
0.40
11.1
13.0
27.2
27.9
0.121
N/A
N/A
N/A
N/A
1.0
2002
94
100
0.37
0.37
11.8
13.6
25.8
26.0
0.080
N/A
N/A
N/A
N/A
0.4
2001
16
100
0.48
0.48
N/A
14.1
N/A
27.2
0.069
N/A
N/A
N/A
N/A
1.0
2000
17
109
0.55
0.55
N/A
14.5
N/A
28.1
0.092
N/A
N/A
N/A
N/A
1.1
Natural disasters
Type
Fort Worth
Irving
Tornado activity compared to U.S. average
249.6%
255.8%
Earthquake activity compared to U.S. average
562.8%
574.6%
Natural disasters compared to U.S. average
23%
21%
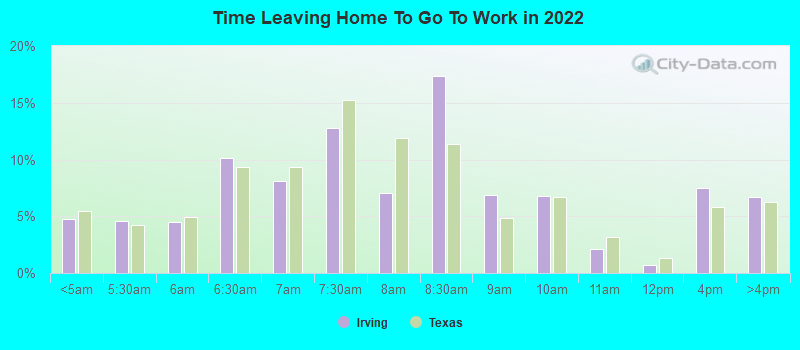
Transportation
Both cities offer excellent public transit systems. Fort Worth's transit system includes buses, trams, and bike-sharing programs. Commuting times are typically longer in Fort Worth due to its larger area. Irving, closer to Dallas, benefits from its location.
Transport
Type
Fort Worth
Irving
Amtrak stations
1
0
Amtrak stations nearby
1
1
FAA registered aircraft
2
112
FAA registered aircraft manufacturers and dealers
19
5
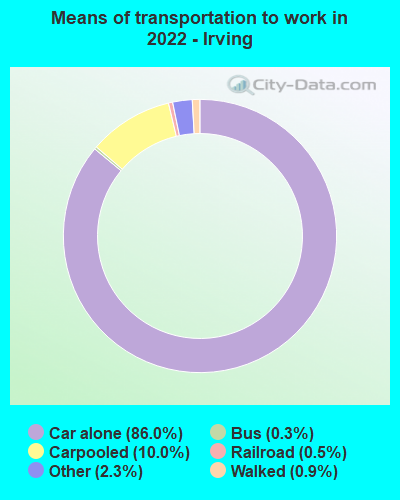
Means of transportation to work
Type
Fort Worth
Irving
Bicycle
0.1%
0%
Bus
0.4%
0.4%
Carpooled
11%
9.9%
Car alone
85.8%
85.5%
Motorcycle
0.1%
0.1%
Railroad
0%
0.4%
Subway
0%
0.1%
Taxicab
0.1%
0.2%
Walked
1.3%
1.3%
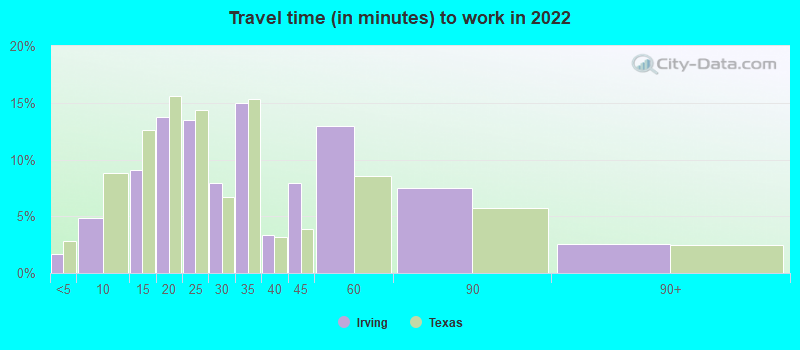
Average travel time to work
Type
Fort Worth
Irving
Average
28.5 min
31.5 min
Other means
25.3 min
24.2 min
Public transportation
41.8 min
44.1 min
Private vehicle occupancy
Type
Fort Worth
Irving
Average
1.2
1.2
Drove alone
87.6%
87.2%
In 2 person carpool
8.5%
8.8%
In 3 person carpool
2.5%
2.9%
In 4 person carpool
1.1%
0.7%
In 5-6 person carpool
0.3%
0.3%
How many people usually rode to work in the car, truck or van.
Real Estate
Real estate prices are generally lower in Fort Worth compared to Irving, offering more affordability for potential homeowners. However, both cities have seen a steady increase in property values, indicating a healthy real estate market.
Neighborhoods
Both cities boast diverse neighborhoods catering to different lifestyles. Fort Worth blends urban and suburban living, while Irving is mostly a commuter city with neighborhoods that cater to professionals working in nearby Dallas.
Houses and residents
Type
Fort Worth
Irving
Houses
361,341
100,800
Average household size (people)
2.8
2.6
Median year apartment built
1991
1987
Median year house/condo built
1995
1983
Length of stay in the house since moving in
11.2 years
11.7 years
Houses occupied
334,286 (92.5%)
95,309 (94.6%)
Houses occupied by owners
185,197 (55.4%)
34,544 (36.2%)
Houses occupied by renters
149,089 (44.6%)
60,765 (63.8%)
Median rent asked for vacant for-rent units
$1,068
$1,063
Median monthly housing costs
$1,328
$1,330
Median price asked for vacant for-sale houses and condos
$288,576
$665,016
Estimated median house or condo value
$249,000
$274,100
Median numbers of rooms
5.3
4.2
Median number of rooms in apartments
4.2
3.5
Median number of rooms in houses and condos
6.3
6.1
Median house price - detached houses
$279,885
$337,489
Median house price - in 2-unit structures
Over $1,000,000
$126,853
Median house price - in 3-to-4-unit structures
$337,081
$134,257
Median house price - in 5 or more unit structures
$298,062
$217,218
Median house price - mobile homes
$58,470
$125,168
Median house price - Townhouses or other attached units
$279,957
$250,693
Median house price - All housing units
$279,281
$321,036
Median house age
29
35
Renting percentage
40.8%
61.6%
Housing density (houses/condos per square mile)
1,235.2
1,499.4
House value disparities
31.8%
33.7%
Household income disparities
43.6%
42.4%
Median household income for houses/condes with a mortgage
$106,170
$108,487
Median household income for apartments without a mortgage
$72,147
$78,490
Housing units without a mortgage
2,986 (2.4%)
261 (1.2%)
Housing units with both a second mortgage and home equity loan
3,696 (3%)
547 (2.6%)
Housing units with a mortgage
121,099 (97.6%)
21,104 (98.8%)
Housing units with a home equity loan
66 (0.1%)
79 (0.4%)
Housing units with a second mortgage
5,171 (4.2%)
681 (3.2%)
House/condo owner moved in on average (years ago)
8
10
House/condo renter moved in on average (years ago)
1
1
Housing units lacking complete kitchen facilities
1.8%
2.2%
Housing units lacking complete plumbing facilities
0.7%
1.5%
Housing units in structures
Housing units in structures
Fort Worth
Irving
One, detached
65.4%
39.8%
One, attached
2.9%
3.8%
Two
1.6%
2.0%
3 or 4
4.1%
5.8%
5 to 9
5.8%
11.3%
10 to 19
6.5%
15.2%
20 to 49
4.6%
7.0%
50 or more
7.0%
13.9%
Mobile homes
2.1%
1.3%
Median real estate property taxes paid for housing units
Self-employed workers in own not incorporated business
27,257
9,391
State government workers
8,587
2,329
Unpaid family workers
392
283
Industries and Occupations
Fort Worth has a diverse economic structure with industries ranging from aviation, healthcare, to education. Irving is home to several Fortune 500 companies which attract professionals in high-tech industries, finance, and global logistics.
Both cities have excellent healthcare facilities. Fort Worth has more hospitals and clinics per capita while Irving's convenient location gives residents quick access to renowned medical facilities in the surrounding cities like Dallas.
Health (county statistics)
Type
Fort Worth
Irving
General health status score of residents in this county from 1 (poor) to 5 (excellent)
Fort Worth's infrastructure has benefited from its larger nature and history, boasting a well-designed highway system and several well-established neighborhoods. Irving, while smaller, also offers good infrastructure, with modern amenities and numerous parks and recreational facilities.
Infrastructure
Type
Fort Worth
Irving
Hospitals
76
12
TV stations
25
26
Arenas or stadiums
7
1
Bank branches located here
175
52
Bank institutions located here
42
20
Main business address for public companies
24
26
Drinking water stations with no reported violations in the past
3
0
Drinking water stations with reported violations in the past
HMDA - Conventional home purchase loans - Applications denied
Year
Fort Worth
Irving
1999
3,575
1,047
2000
2,473
375
2001
2,109
307
2002
1,701
239
2003
2,183
722
2004
3,202
647
2005
4,261
1,099
2006
4,161
1,041
2007
2,871
618
2008
1,256
368
2009
585
179
Culture and Food
Fort Worth, with its cowboy history and rich heritage, is a haven for cultural and food enthusiasts. Irving, with its multicultural environment, offers diverse food options and cultural experiences, including numerous events and festivals throughout the year.
Sports Teams
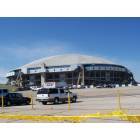
While Fort Worth doesn't have any major professional sports teams, it's home to a number of minor league and college sports teams. Irving was once home to the Dallas Cowboys until the team moved to Arlington.


 Fort Worth, TX
 Irving, TX