Both Fort Worth, Texas, and Cincinnati, Ohio, offer distinct living experiences peppered with their own local flair. Both cities offer vibrant cultures, strong economies, and varying climates. This report will provide a comprehensive comparison between Fort Worth and Cincinnati in terms of crime/safety, weather, cost of living, education, work and economy, infrastructure, industries and occupations, biggest employers, real-estate, neighborhoods, transportation/public transit/commuting, city/state sales tax, city/state income tax, city/state property tax, culture/food, sports teams, geographical conditions, and health care. The insights provided will assist individuals considering relocation or those merely visiting these cities.
Distance between
Fort Worth, TX and
Cincinnati, OH : 841.7 miles
Fort Worth's population is larger by 203%. Its population has grown by 400,814 people (75.0%) since 2000. The population of Cincinnati has decreased by 22,350 people (6.7%) during that time.
The overall crime rates in both cities have been above the national average, though they differ by type. In Fort Worth, property crime is more prevalent than violent crime. On the other hand, Cincinnati has higher rates of both property and violent crime when compared to Fort Worth. Both cities have invested significantly in community safety programs, public awareness campaigns, and police visibility to mitigate crime levels.
City-data.com crime index counts serious crimes and violent crime more heavily. It adjusts for the number of visitors and daily workers commuting into cities. (higher means more crime, U.S. average = 301.1)
City-data.com crime index counts serious crimes and violent crime more heavily. It adjusts for the number of visitors and daily workers commuting into cities. (higher means more crime, U.S. average = 301.1)
Sex Offenders
According to our data, there are 3,152 registered sex offenders living in Fort Worth and 1,060 registered sex offenders living in . The ratio of residents to sex offenders in Fort Worth is 272 to 1; the ratio in Cincinnati is 282 to 1. The number of registered sex offenders compared to the number of residents in Fort Worth is near to than in Cincinnati.
Cost of Living
The cost of living in Fort Worth is slightly lower than in Cincinnati. Housing is notably more affordable in Fort Worth compared to Cincinnati. Other costs, such as food, health care, utilities, and transportation, are comparable between the two cities.
Income Tax
Texas, including Fort Worth, has no state income tax, while Ohio residents, including those in Cincinnati, pay state income tax. The top rate is 4.797% for individuals earning $221,300 or more.
Property Tax
Homeowners in Fort Worth pay a higher property tax rate than those in Cincinnati. The average property tax rate in Tarrant County, where Fort Worth is located, is about 2.16%. In Hamilton County, where Cincinnati is located, the rate averages around 1.55%.
Sales Tax
Sales tax in Fort Worth, Texas, is 6.25% at the state level plus up to 2% for local taxes. In Cincinnati, Ohio, the state sales tax is 5.75%, with local taxes adding another 1.25% to 1.5% depending on location.
Income
Type
Fort Worth
Cincinnati
Estimated median household income
$68,235
$42,733
Estimated per capita income
$34,106
$34,519
Cost of living index (U.S. average is 100)
95.4
89
If you make $50,000 in Cincinnati, you will have to make $53,596 in Fort Worth to maintain the same standard of living.
Geographical Conditions
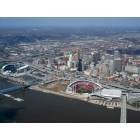
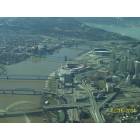
Fort Worth lies in North Central Texas and features flat terrain, ideal for urban development, while Cincinnati is located in the Midwest, alongside the Ohio River, offering beautiful riverfront views and notable hilly terrain.
Fort Worth and Cincinnati host highly-regarded educational institutions, but Cincinnati edges with a higher percentage of residents holding a Bachelor’s degree or higher. Cincinnati is also home to several notable universities, including the University of Cincinnati, while Fort Worth is proximate to reputable universities like Texas Christian University and the University of North Texas.
Both Fort Worth and Cincinnati have diverse economies. Fort Worth has a strong economy with sizable sectors in manufacturing, technology, and healthcare. Cincinnati, too, has a robust economy, with primary industries being manufacturing, health care, professional services, and retail trade.
Biggest Employers
Fort Worth's largest employers are American Airlines Group, Lockheed Martin Aeronautics, and Texas Health Resources. In Cincinnati, the top employers are the University of Cincinnati, Kroger, and Procter & Gamble.
There were 7,236 building permits issued in Fort Worth in 2012 (4810 more than in 2011) compared to 206 building permits issued in Cincinnati in 2012 (122 more than in 2011).
In Fort Worth (Tarrant County), 41.4% voted for Democrats and 57.1% for Republicans in 2012 Presidential Election. In Cincinnati (Hamilton County), 52.7% voted for Democrats and 46.4% for Republicans.
Elections
Type
Democrats
Republicans
Other
Year
Fort Worth
Cincinnati
Fort Worth
Cincinnati
Fort Worth
Cincinnati
2020
49.3%
57.2%
49.1%
41.3%
1.6%
1.5%
2016
43.2%
52.8%
51.8%
42.5%
5.0%
4.8%
2012
41.4%
52.7%
57.1%
46.4%
1.4%
0.9%
2008
43.8%
53.1%
55.5%
46.1%
0.7%
0.7%
2004
37.0%
47.3%
62.5%
52.7%
0.5%
0.0%
2000
36.9%
42.8%
60.9%
54.1%
2.3%
3.1%
1996
41.6%
43.1%
50.9%
50.1%
7.5%
6.8%
Breakdown of population affiliated with a religious congregation
Type
Adherents
Congregations
Religion
Fort Worth
Cincinnati
Fort Worth
Cincinnati
SOUTHERN BAPTIST CONVENTION
17.3%
1.2%
33.3%
6.5%
CATHOLIC CHURCH
11.1%
25.6%
1.9%
12.5%
MUSLIM ESTIMATE
2.2%
0.2%
0.9%
0.6%
LUTHERAN CHURCH
0.5%
0.3%
0.9%
1.5%
SEVENTH DAY ADVENTIST CHURCH
0.4%
0.2%
1.6%
0.9%
EPISCOPAL CHURCH
0.3%
1.1%
0.8%
3.0%
EVANGELICAL LUTHERAN CHURCH IN AMERICA
0.3%
0.6%
0.9%
1.8%
AMERICAN BAPTIST CHURCHES IN THE USA
0.0%
1.3%
0.1%
2.6%
VINEYARD USA
0.0%
1.8%
0.2%
1.1%
Weather
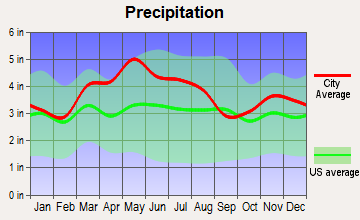
Fort Worth enjoys a warmer climate with hot, humid summers and mild winters. By contrast, Cincinnati experiences a humid continental climate, which includes hot, humid summers and chilly winters with occasional heavy snowfalls. For those who love warm weather, Fort Worth might be more attractive. On the other side, Cincinnati offers a change of seasons and the charm of wintry landscapes.
Weather and climate
Type
Fort Worth
Cincinnati
Temperature - Average
65°F
52.9°F
Humidity - Average morning or afternoon humidity
71.4%
75.8%
Humidity - Differences between morning and afternoon humidity
34.1%
34%
Humidity - Maximum monthly morning or afternoon humidity
82.1%
87%
Humidity - Minimum monthly morning or afternoon humidity
48%
53%
Precipitation - Yearly average
35 in
45 in
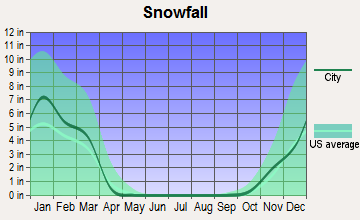
Snowfall - Yearly average
4.2 in
47.6 in
Clouds - Number of days clear of clouds
22.8%
13.5%
Sunshine amount - Average
66.6%
57.8%
Sunshine amount - Differences during a year
20%
33.1%
Sunshine amount - Maximum monthly
74%
67%
Sunshine amount - Minimum monthly
54%
33.9%
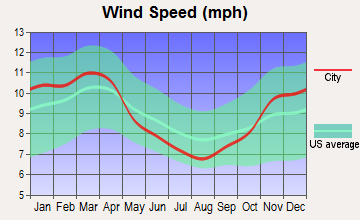
Wind speed - Average
10.3 mph
9 mph
Average climate in Fort Worth, Texas
Average climate in Cincinnati, Ohio
Air pollution
Type
AQI
CO
NO2
OZONE
PM10
PM25
SO2
Year
Fort Worth
Cincinnati
Fort Worth
Cincinnati
Fort Worth
Cincinnati
Fort Worth
Cincinnati
Cincinnati
Fort Worth
Cincinnati
Fort Worth
Cincinnati
2018
67
87
N/A
0.20
5.8
9.6
27.1
27.8
18.3
N/A
N/A
10.5
N/A
0.8
2017
67
81
N/A
0.23
6.2
8.5
27.2
29.2
18.8
N/A
N/A
9.2
N/A
1.1
2016
56
88
N/A
0.24
6.3
9.4
25.5
28.4
21.2
N/A
N/A
8.4
N/A
1.1
2015
61
91
N/A
0.26
6.5
11.0
24.8
26.4
21.5
N/A
N/A
9.5
N/A
1.5
2014
56
89
0.22
0.24
6.8
11.4
26.6
27.3
19.5
N/A
N/A
12.0
N/A
2.0
2013
64
92
0.25
0.24
6.4
11.5
26.5
27.0
22.9
N/A
N/A
11.9
N/A
2.6
2012
87
97
0.26
0.26
7.8
4.8
30.3
27.6
23.4
N/A
N/A
13.6
N/A
3.4
2011
79
102
0.23
0.26
7.9
12.9
30.7
28.1
22.1
N/A
N/A
13.1
N/A
4.0
2010
70
113
0.23
N/A
8.5
14.7
27.7
29.7
26.6
N/A
N/A
18.7
N/A
3.7
2009
81
77
0.25
N/A
8.7
14.4
29.5
25.6
22.6
N/A
N/A
8.2
N/A
2.2
2008
69
85
0.25
N/A
9.6
16.0
25.8
26.5
N/A
N/A
N/A
9.4
N/A
3.0
2007
75
100
0.30
N/A
10.6
17.1
24.6
30.2
N/A
N/A
N/A
12.7
N/A
4.0
2006
90
83
0.34
N/A
10.2
18.0
29.7
29.3
21.9
N/A
N/A
N/A
N/A
4.2
2005
102
110
0.34
0.49
10.9
20.6
28.4
30.9
N/A
N/A
11.3
N/A
0.9
5.6
2004
78
91
0.39
0.36
10.6
18.7
25.4
27.7
N/A
N/A
N/A
N/A
N/A
5.5
2003
82
86
0.40
0.33
11.1
21.9
27.2
27.6
N/A
N/A
N/A
N/A
N/A
4.9
2002
94
98
0.37
0.32
11.8
21.4
25.8
29.4
20.0
N/A
N/A
N/A
N/A
4.5
2001
16
102
0.48
0.41
N/A
21.4
N/A
29.4
22.9
N/A
N/A
N/A
N/A
5.0
2000
17
104
0.55
0.40
N/A
22.1
N/A
28.0
N/A
N/A
N/A
N/A
N/A
6.3
Natural disasters
Type
Fort Worth
Cincinnati
Tornado activity compared to U.S. average
249.6%
166.3%
Earthquake activity compared to U.S. average
562.8%
148.2%
Natural disasters compared to U.S. average
23%
15%
Transportation
Both cities have well-developed transportation networks. Fort Worth has a comprehensive bus network, bike-sharing program, and rail service, while Cincinnati offers bus service, a bike-share system, and the Cincinnati Bell Connector streetcar.
Transport
Type
Fort Worth
Cincinnati
Amtrak stations
1
1
Amtrak stations nearby
1
2
FAA registered aircraft
2
454
FAA registered aircraft manufacturers and dealers
19
16
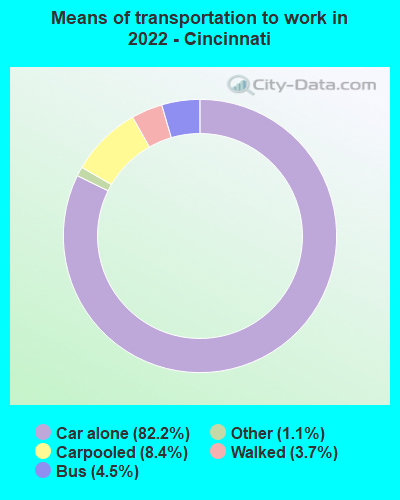
Means of transportation to work
Type
Fort Worth
Cincinnati
Bicycle
0.1%
0.3%
Bus
0.4%
3.2%
Carpooled
11%
7.2%
Car alone
85.8%
84.7%
Motorcycle
0.1%
0.1%
Taxicab
0.1%
0.3%
Walked
1.3%
3.4%
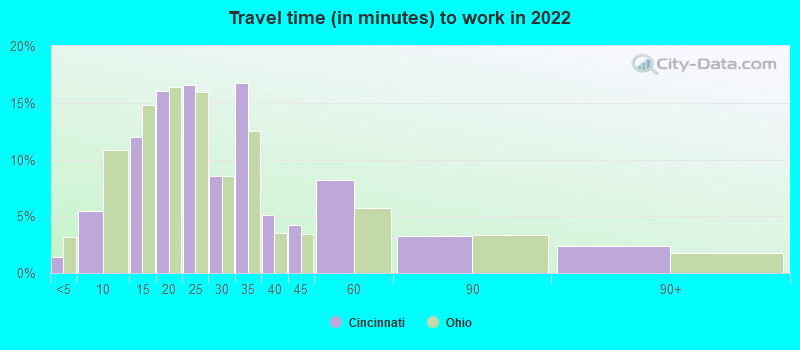
Average travel time to work
Type
Fort Worth
Cincinnati
Average
28.5 min
26.9 min
Other means
25.3 min
21.8 min
Public transportation
41.8 min
38 min
Private vehicle occupancy
Type
Fort Worth
Cincinnati
Average
1.2
1.1
Drove alone
87.6%
89.6%
In 2 person carpool
8.5%
8.6%
In 3 person carpool
2.5%
1%
In 4 person carpool
1.1%
0.6%
In 5-6 person carpool
0.3%
0.2%
How many people usually rode to work in the car, truck or van.
Real Estate
While both cities offer a range of real estate options, Fort Worth's market is typically more accessible, with more affordable housing options compared to Cincinnati.
Neighborhoods
Both cities boast diverse neighborhoods catering to different lifestyles. Fort Worth is home to the vibrant Sundance Square and artsy Near Southside. Cincinnati, on the other hand, touts several historic neighborhoods like Over-the-Rhine and the entertainment-centric The Banks district.
Houses and residents
Type
Fort Worth
Cincinnati
Houses
361,341
160,420
Average household size (people)
2.8
2.1
Median year apartment built
1991
1961
Length of stay in the house since moving in
11.2 years
13.7 years
Houses occupied
334,286 (92.5%)
144,929 (90.3%)
Houses occupied by owners
185,197 (55.4%)
55,411 (38.2%)
Houses occupied by renters
149,089 (44.6%)
89,518 (61.8%)
Median rent asked for vacant for-rent units
$1,068
$823.02
Median monthly housing costs
$1,328
$918
Median price asked for vacant for-sale houses and condos
$288,576
$55,446
Estimated median house or condo value
$249,000
$190,300
Median numbers of rooms
5.3
4.6
Median number of rooms in apartments
4.2
3.7
Median number of rooms in houses and condos
6.3
6.5
Median house price - detached houses
$279,885
$271,565
Median house price - in 2-unit structures
Over $1,000,000
$236,559
Median house price - in 3-to-4-unit structures
$337,081
$378,023
Median house price - in 5 or more unit structures
$298,062
$288,600
Median house price - mobile homes
$58,470
$76,176
Median house price - Townhouses or other attached units
$279,957
$269,604
Median house price - All housing units
$279,281
$273,493
Median house age
29
70
Renting percentage
40.8%
61.1%
Housing density (houses/condos per square mile)
1,235.2
2,057.5
House value disparities
31.8%
42.9%
Household income disparities
43.6%
51.8%
Median household income for houses/condes with a mortgage
$106,170
$87,346
Median household income for apartments without a mortgage
$72,147
$63,683
Housing units without a mortgage
2,986 (2.4%)
1,063 (2.8%)
Housing units with both a second mortgage and home equity loan
3,696 (3%)
2,466 (6.5%)
Housing units with a mortgage
121,099 (97.6%)
36,710 (97.2%)
Housing units with a home equity loan
66 (0.1%)
116 (0.3%)
Housing units with a second mortgage
5,171 (4.2%)
3,803 (10.1%)
House/condo owner moved in on average (years ago)
8
11
House/condo renter moved in on average (years ago)
1
1
Housing units lacking complete kitchen facilities
1.8%
2.4%
Housing units lacking complete plumbing facilities
0.7%
1.5%
Housing units in structures
Housing units in structures
Fort Worth
Cincinnati
One, detached
65.4%
36.6%
One, attached
2.9%
4.9%
Two
1.6%
7.5%
3 or 4
4.1%
12.0%
5 to 9
5.8%
8.8%
10 to 19
6.5%
10.0%
20 to 49
4.6%
6.7%
50 or more
7.0%
13.2%
Mobile homes
2.1%
0.3%
Median real estate property taxes paid for housing units
Self-employed workers in own not incorporated business
27,257
6,809
State government workers
8,587
4,546
Unpaid family workers
392
42
Industries and Occupations
In Fort Worth, the leading industries are aerospace, manufacturing, healthcare, and education. The city is a major hub for the aerospace industry and a significant employment center for health care. Cincinnati similarly has a diversified economy with a strong presence in the health care, manufacturing, retail, and professional services sectors.
Both cities offer excellent healthcare facilities. Fort Worth is home to the highly-rated Texas Health Harris Methodist Hospital. Cincinnati houses the University of Cincinnati Medical Center and Cincinnati Children's Hospital, celebrated as one of the top children's hospitals nationwide.
Health (county statistics)
Type
Fort Worth
Cincinnati
General health status score of residents in this county from 1 (poor) to 5 (excellent)
Fort Worth boasts modern infrastructure with a significant focus on sustainable design and construction. Cincinnati, too, has a well-developed infrastructure, including key historical landmarks. City restoration projects and updates are continuous in both urban regions.
Infrastructure
Type
Fort Worth
Cincinnati
Hospitals
76
46
TV stations
25
16
Arenas or stadiums
7
6
Bank branches located here
175
289
Bank institutions located here
42
35
Main business address for public companies
24
30
Drinking water stations with no reported violations in the past
3
2
Drinking water stations with reported violations in the past
HMDA - Conventional home purchase loans - Applications denied
Year
Fort Worth
Cincinnati
1999
3,575
1,027
2000
2,473
1,294
2001
2,109
1,046
2002
1,701
978
2003
2,183
1,051
2004
3,202
1,275
2005
4,261
1,694
2006
4,161
1,584
2007
2,871
991
2008
1,256
436
2009
585
279
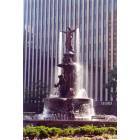
Culture and Food
Fort Worth houses a strong cowboy heritage paired with refined cultural amenities, including world-class museums and a vibrant arts scene. Cincinnati, on the other hand, is celebrated for its robust history, arts scene, and food culture, famous for its Cincinnati-style chili.
Sports Teams
Fort Worth shares its sports teams with nearby Dallas, which includes professional football's Cowboys and NBA's Mavericks. Cincinnati is home to the NFL's Bengals and MLB's Reds. Both cities have a strong sports culture and support for their local teams is evident.


 Fort Worth, TX
 Cincinnati, OH