Whether you're considering a move or a short visit, it's always key to research the community profile of your intended destination. This analysis compares Fort Worth, Texas with Aurora, Illinois, touching on various aspects of these cities to inform your decision. The comparison covers factors like crime rates, cost of living, educational opportunities, work prospects, food, culture, sports, healthcare, taxes, and more.
Distance between
Fort Worth, TX and
Aurora, IL : 796.1 miles
Fort Worth's population is larger by 422%. Its population has grown by 400,814 people (75.0%) since 2000. The population of Aurora has grown by 36,276 people (25.4%) during that time.
Comparing the crime statistics, Fort Worth, TX has a higher crime rate than Aurora, IL. It's worth noting however that both cities are generally safe, with different districts being safer than others. For tourists and potential residents alike, it's crucial to be aware of the safest areas in both cities, and to remain vigilant, especially during late hours.
City-data.com crime index counts serious crimes and violent crime more heavily. It adjusts for the number of visitors and daily workers commuting into cities. (higher means more crime, U.S. average = 301.1)
City-data.com crime index counts serious crimes and violent crime more heavily. It adjusts for the number of visitors and daily workers commuting into cities. (higher means more crime, U.S. average = 301.1)
Sex Offenders
According to our data, there are 3,152 registered sex offenders living in Fort Worth and 253 registered sex offenders living in . The ratio of residents to sex offenders in Fort Worth is 272 to 1; the ratio in Aurora is 779 to 1. The number of registered sex offenders compared to the number of residents is much larger in Fort Worth than that in Aurora.
Cost of Living
The cost of living is cheaper in Fort Worth, TX compared to Aurora, IL, which is mainly due to housing. However, grocery, health, utility, and transportation costs are similar across both cities, with slight variations. Understanding your budget and needs will be critical in deciding which city is suitable for you.
Income Tax
Illinois has a flat income tax rate of 4.95%, while Texas (and therefore Fort Worth) has no state income tax.
Property Tax
Property tax in Fort Worth is higher (2.2%) compared to Aurora (2.1%). Still, this minor difference may not significantly affect your decision unless you're planning on owning a high-value property.
Sales Tax
Texas does not have state income tax, making Fort Worth a favorable place to live for those seeking to reduce their tax bills. However, the sales tax is higher in Fort Worth (8.25%) compared to Aurora (8%).
Income
Type
Fort Worth
Aurora
Estimated median household income
$68,235
$83,996
Estimated per capita income
$34,106
$34,054
Cost of living index (U.S. average is 100)
95.4
100.6
If you make $50,000 in Fort Worth, you will have to make $52,725 in Aurora to maintain the same standard of living.
Geographical Conditions
Fort Worth offers a flat terrain with many lakes and rivers while Aurora is characterized by a mixed terrain surrounded by the Fox River. Both cities have parks and outdoor amenities supporting varied recreational activities.
Fort Worth has more universities compared to Aurora, thus providing more further education opportunities. The quality of primary and secondary education is, however, comparable in both cities.
Fort Worth's economy is known for its robust growth, with industries like aerospace, healthcare, and financial services dominating. Aurora's economy is evenly segmented across healthcare, manufacturing, and retail, offering a comparative diversity of job opportunities.
Biggest Employers
Fort Worth’s biggest employers include American Airlines Group, the City of Fort Worth, and Texas Health Resources. Aurora’s top employers are Caterpillar Inc., the City of Aurora, and Rush-Copley Medical Center.
There were 7,236 building permits issued in Fort Worth in 2012 (4810 more than in 2011) compared to 55 building permits issued in Aurora in 2012 (12 less than in 2011).
In Fort Worth (Tarrant County), 41.4% voted for Democrats and 57.1% for Republicans in 2012 Presidential Election. In Aurora (Kane County), 49.7% voted for Democrats and 48.6% for Republicans.
Elections
Type
Democrats
Republicans
Other
Year
Fort Worth
Aurora
Fort Worth
Aurora
Fort Worth
Aurora
2020
49.3%
56.3%
49.1%
41.9%
1.6%
1.8%
2016
43.2%
52.0%
51.8%
41.5%
5.0%
6.4%
2012
41.4%
49.7%
57.1%
48.6%
1.4%
1.6%
2008
43.8%
55.4%
55.5%
43.6%
0.7%
1.0%
2004
37.0%
44.1%
62.5%
55.1%
0.5%
0.8%
2000
36.9%
42.5%
60.9%
54.5%
2.3%
3.0%
1996
41.6%
41.8%
50.9%
47.4%
7.5%
10.8%
Breakdown of population affiliated with a religious congregation
Type
Adherents
Congregations
Religion
Fort Worth
Aurora
Fort Worth
Aurora
SOUTHERN BAPTIST CONVENTION
17.3%
0.5%
33.3%
4.9%
CATHOLIC CHURCH
11.1%
30.2%
1.9%
8.6%
MUSLIM ESTIMATE
2.2%
2.6%
0.9%
1.2%
LUTHERAN CHURCH
0.5%
2.6%
0.9%
6.1%
SEVENTH DAY ADVENTIST CHURCH
0.4%
0.3%
1.6%
2.8%
EPISCOPAL CHURCH
0.3%
0.6%
0.8%
2.5%
EVANGELICAL LUTHERAN CHURCH IN AMERICA
0.3%
1.8%
0.9%
4.3%
AMERICAN BAPTIST CHURCHES IN THE USA
0.0%
0.9%
0.1%
3.1%
Weather
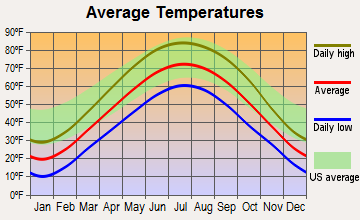
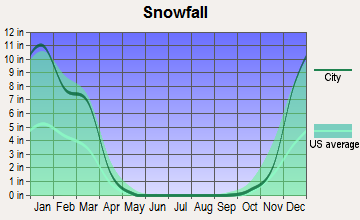
Fort Worth has a warmer climate with mild winters and hot summers ideal for swimming and enjoying a plethora of water sports in its numerous lakes and rivers. Aurora experiences relatively colder weather with a considerable amount of snowfall during winters. Choosing comes down to personal preference for a warm or cold climate.
Weather and climate
Type
Fort Worth
Aurora
Temperature - Average
65°F
48°F
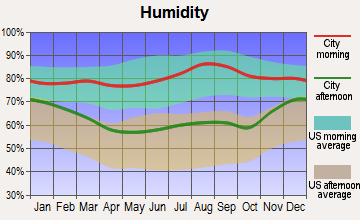
Humidity - Average morning or afternoon humidity
71.4%
75.7%
Humidity - Differences between morning and afternoon humidity
34.1%
31.3%
Humidity - Maximum monthly morning or afternoon humidity
82.1%
85.3%
Humidity - Minimum monthly morning or afternoon humidity
48%
54%
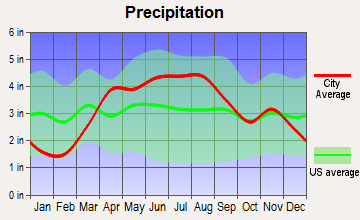
Precipitation - Yearly average
35 in
38.4 in
Snowfall - Yearly average
4.2 in
77.2 in
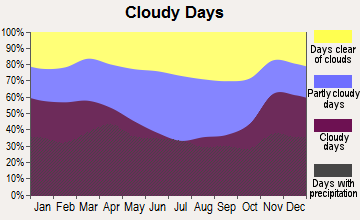
Clouds - Number of days clear of clouds
22.8%
14.1%
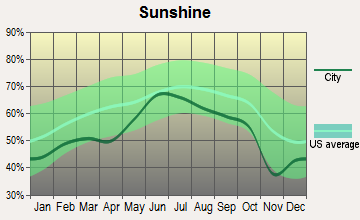
Sunshine amount - Average
66.6%
56.8%
Sunshine amount - Differences during a year
20%
33%
Sunshine amount - Maximum monthly
74%
68%
Sunshine amount - Minimum monthly
54%
35%
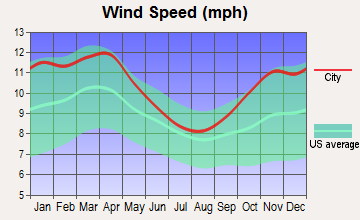
Wind speed - Average
10.3 mph
10.7 mph
Average climate in Fort Worth, Texas
Average climate in Aurora, Illinois
Air pollution
Type
AQI
CO
NO2
OZONE
PM10
PM25
SO2
Year
Fort Worth
Aurora
Fort Worth
Fort Worth
Fort Worth
Aurora
Aurora
Fort Worth
Aurora
Fort Worth
Aurora
2018
67
85
N/A
N/A
5.8
N/A
27.1
26.6
23.9
N/A
N/A
10.6
N/A
0.9
2017
67
76
N/A
N/A
6.2
N/A
27.2
27.8
26.2
N/A
N/A
N/A
N/A
1.0
2016
56
77
N/A
N/A
6.3
N/A
25.5
27.6
27.7
N/A
N/A
N/A
N/A
0.5
2015
61
76
N/A
N/A
6.5
N/A
24.8
26.3
36.0
N/A
N/A
N/A
N/A
1.5
2014
56
72
0.22
N/A
6.8
N/A
26.6
24.8
46.2
N/A
N/A
N/A
N/A
1.0
2013
64
72
0.25
N/A
6.4
N/A
26.5
24.3
N/A
N/A
N/A
N/A
N/A
2.1
2012
87
87
0.26
N/A
7.8
N/A
30.3
25.7
N/A
N/A
N/A
10.3
N/A
2.5
2011
79
82
0.23
N/A
7.9
N/A
30.7
24.6
26.9
N/A
N/A
12.8
N/A
3.1
2010
70
87
0.23
N/A
8.5
N/A
27.7
24.3
26.5
N/A
N/A
12.6
N/A
2.7
2009
81
94
0.25
N/A
8.7
N/A
29.5
21.7
26.4
N/A
N/A
13.2
N/A
2.7
2008
69
87
0.25
N/A
9.6
N/A
25.8
22.4
29.0
N/A
N/A
11.8
N/A
4.2
2007
75
111
0.30
N/A
10.6
N/A
24.6
23.6
32.6
N/A
N/A
12.7
N/A
4.8
2006
90
68
0.34
N/A
10.2
N/A
29.7
20.2
32.1
N/A
N/A
N/A
N/A
4.3
2005
102
84
0.34
N/A
10.9
N/A
28.4
22.7
32.0
N/A
11.3
N/A
0.9
4.7
2004
78
71
0.39
N/A
10.6
N/A
25.4
19.8
32.8
N/A
N/A
N/A
N/A
4.5
2003
82
80
0.40
N/A
11.1
N/A
27.2
20.2
31.8
N/A
N/A
N/A
N/A
4.0
2002
94
90
0.37
N/A
11.8
N/A
25.8
21.2
37.1
N/A
N/A
N/A
N/A
4.6
2001
16
85
0.48
N/A
N/A
N/A
N/A
20.6
37.8
N/A
N/A
N/A
N/A
5.4
2000
17
64
0.55
N/A
N/A
N/A
N/A
19.4
N/A
N/A
N/A
N/A
N/A
4.2
Natural disasters
Type
Fort Worth
Aurora
Tornado activity compared to U.S. average
249.6%
153.1%
Earthquake activity compared to U.S. average
562.8%
154.4%
Natural disasters compared to U.S. average
23%
15%
Transportation
Both cities have extensive public transit systems. Fort Worth has the Trinity Metro, while Aurora has the Pace Bus and Metra Train services making commuting efficient in both cities.
Transport
Type
Fort Worth
Aurora
Amtrak stations
1
0
Amtrak stations nearby
1
3
FAA registered aircraft
2
30
FAA registered aircraft manufacturers and dealers
19
0
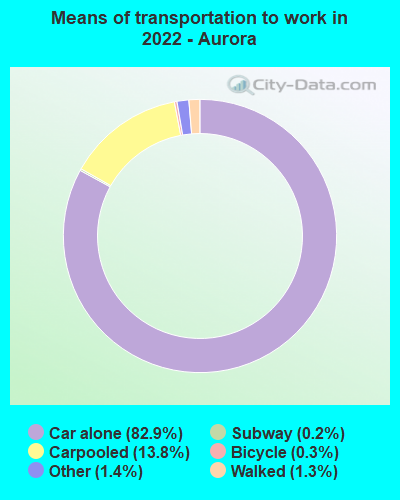
Means of transportation to work
Type
Fort Worth
Aurora
Bicycle
0.1%
0.2%
Bus
0.4%
0.3%
Carpooled
11%
11%
Car alone
85.8%
85.1%
Motorcycle
0.1%
0.1%
Subway
0%
0.3%
Walked
1.3%
1.8%
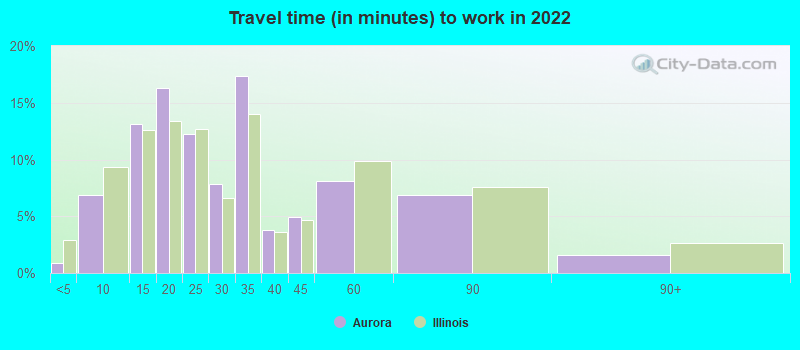
Average travel time to work
Type
Fort Worth
Aurora
Average
28.5 min
27 min
Other means
25.3 min
28.1 min
Public transportation
41.8 min
61.4 min
Private vehicle occupancy
Type
Fort Worth
Aurora
Average
1.2
1.3
Drove alone
87.6%
86.1%
In 2 person carpool
8.5%
9.7%
In 3 person carpool
2.5%
0.6%
In 4 person carpool
1.1%
1%
In 5-6 person carpool
0.3%
2.5%
How many people usually rode to work in the car, truck or van.
Real Estate
There are diverse housing options in both cities, but homes are generally more affordable in Fort Worth, TX than in Aurora, IL. Real estate development seems to be equally vibrant in both cities.
Neighborhoods
Fort Worth offers more neighborhoods making it slightly more diverse in comparison to Aurora. However, both cities have upscale neighborhoods, historic sites, and family-friendly suburban areas ideal for raising children.
Houses and residents
Type
Fort Worth
Aurora
Houses
361,341
64,677
Average household size (people)
2.8
3.1
Median year apartment built
1991
1977
Median year house/condo built
1995
1990
Length of stay in the house since moving in
11.2 years
13.1 years
Houses occupied
334,286 (92.5%)
62,379 (96.4%)
Houses occupied by owners
185,197 (55.4%)
43,361 (69.5%)
Houses occupied by renters
149,089 (44.6%)
19,018 (30.5%)
Median rent asked for vacant for-rent units
$1,068
$1,534
Median monthly housing costs
$1,328
$1,408
Median price asked for vacant for-sale houses and condos
$288,576
$92,244
Estimated median house or condo value
$249,000
$232,400
Median numbers of rooms
5.3
5.7
Median number of rooms in apartments
4.2
4.3
Median number of rooms in houses and condos
6.3
6.4
Median house price - detached houses
$279,885
$255,964
Median house price - in 2-unit structures
Over $1,000,000
$145,729
Median house price - in 3-to-4-unit structures
$337,081
$141,854
Median house price - in 5 or more unit structures
$298,062
$103,693
Median house price - mobile homes
$58,470
$317,080
Median house price - Townhouses or other attached units
$279,957
$202,183
Median house price - All housing units
$279,281
$240,490
Median house age
29
34
Renting percentage
40.8%
30.4%
Housing density (houses/condos per square mile)
1,235.2
1,678.8
House value disparities
31.8%
26.4%
Household income disparities
43.6%
40.1%
Median household income for houses/condes with a mortgage
$106,170
$112,817
Median household income for apartments without a mortgage
$72,147
$76,448
Housing units without a mortgage
2,986 (2.4%)
296 (1%)
Housing units with both a second mortgage and home equity loan
3,696 (3%)
1,148 (3.8%)
Housing units with a mortgage
121,099 (97.6%)
30,127 (99%)
Housing units with a home equity loan
66 (0.1%)
0 (0%)
Housing units with a second mortgage
5,171 (4.2%)
1,552 (5.1%)
House/condo owner moved in on average (years ago)
8
11
House/condo renter moved in on average (years ago)
1
1
Housing units lacking complete kitchen facilities
1.8%
1.3%
Housing units lacking complete plumbing facilities
0.7%
0.5%
Housing units in structures
Housing units in structures
Fort Worth
Aurora
One, detached
65.4%
59.3%
One, attached
2.9%
16.8%
Two
1.6%
3.6%
3 or 4
4.1%
3.4%
5 to 9
5.8%
3.5%
10 to 19
6.5%
6.0%
20 to 49
4.6%
2.2%
50 or more
7.0%
4.8%
Mobile homes
2.1%
0.3%
Median real estate property taxes paid for housing units
Self-employed workers in own not incorporated business
27,257
3,558
State government workers
8,587
1,410
Unpaid family workers
392
54
Industries and Occupations
In Fort Worth, the major industries are aerospace, healthcare, and financial services while in Aurora the dominant industries are healthcare, manufacturing, and retail trade. As for occupations, Fort Worth leans towards management, business, science, and arts occupations, while Aurora is more concentrated on sales, service, and office occupations.
Both Fort Worth and Aurora have numerous healthcare facilities offering high-quality services. However, Fort Worth has more hospitals and healthcare institutions, giving a slight edge in terms of health services access.
Health (county statistics)
Type
Fort Worth
Aurora
General health status score of residents in this county from 1 (poor) to 5 (excellent)
Fort Worth boasts a more sophisticated infrastructure, with abundant recreational facilities, libraries, police stations, and fire stations. Although Aurora's infrastructure is up-to-date, Fort Worth's offerings are more far-reaching.
Infrastructure
Type
Fort Worth
Aurora
Hospitals
76
5
TV stations
25
27
Bank branches located here
175
45
Bank institutions located here
42
19
Main business address for public companies
24
3
Drinking water stations with no reported violations in the past
3
4
Drinking water stations with reported violations in the past
HMDA - Conventional home purchase loans - Applications denied
Year
Fort Worth
Aurora
1999
3,575
182
2000
2,473
240
2001
2,109
182
2002
1,701
191
2003
2,183
363
2004
3,202
683
2005
4,261
1,038
2006
4,161
1,182
2007
2,871
627
2008
1,256
211
2009
585
89
Culture and Food
Both cities offer different cultural experiences - Fort Worth with its western heritage and Aurora with its rich history centered on manufacturing. When it comes to food, both cities offer diverse cuisines but Fort Worth’s Tex-Mex and BBQ offerings are hard to ignore.
Sports Teams
Sports fans will love Fort Worth, home to teams across major leagues such as the Texas Rangers in MLB and the Dallas Cowboys in the NFL. Aurora has no major league sports teams per se, though Chicago's teams like the Chicago Bulls and Chicago Cubs are in close proximity.


 Fort Worth, TX
 Aurora, IL