Fort Worth and Arlington, both located in the heart of Texas, offer a delightful melange of southern living, thriving industries, and vibrant culture. While they share many commonalities, each city has its unique characteristics that make them stand out. This comprehensive guide provides a comparison between them, exploring various aspects from crime and safety to cost of living, and from infrastructure to local culture. Whether you're planning to relocate or just visiting, these insights will help you understand the unique charm and challenges of each city.
Distance between
Fort Worth, TX and
Arlington, TX : 12.5 miles
Fort Worth's population is larger by 138%. Its population has grown by 400,814 people (75.0%) since 2000. The population of Arlington has grown by 59,817 people (18.0%) during that time.
When it comes to safety, both Fort Worth and Arlington have similar crime rates, slightly higher than the national average. In Fort Worth, the emphasis is on community policing and public education to reduce crime. Meanwhile, Arlington maintains its safety through a strong law enforcement presence and community-engagement initiatives. Both cities have areas that are safer than others, and it’s advisable to have a local perspective when choosing where to live or visit.
City-data.com crime index counts serious crimes and violent crime more heavily. It adjusts for the number of visitors and daily workers commuting into cities. (higher means more crime, U.S. average = 301.1)
City-data.com crime index counts serious crimes and violent crime more heavily. It adjusts for the number of visitors and daily workers commuting into cities. (higher means more crime, U.S. average = 301.1)
Sex Offenders
According to our data, there are 3,152 registered sex offenders living in Fort Worth and 602 registered sex offenders living in . The ratio of residents to sex offenders in Fort Worth is 272 to 1; the ratio in Arlington is 652 to 1. The number of registered sex offenders compared to the number of residents is larger in Fort Worth than in Arlington.
Cost of Living
The cost of living in Fort Worth is generally higher than Arlington. Housing, being the significant influence, is more expensive in Fort Worth. However, when it comes to everyday expenses like groceries, healthcare, and transport, the costs are rather similar in both cities. Despite the slight imbalance, both cities are still significantly more affordable than the national average.
Income Tax
Texas is one of the seven U.S. states with no state income tax, which applies to both Fort Worth and Arlington. This is a significant financial advantage for residents of both cities.
Property Tax
Property tax rates in both cities are quite high compared to the national average. However, Arlington’s property tax rates are slightly lower than Fort Worth’s, which could be a consideration for potential homeowners.
Sales Tax
Both cities have a similar tax structure as they are in the same state - Texas. The state sales tax is 6.25%, but both cities impose an additional local sales tax of 2%, making the total sales tax 8.25%.
Income
Type
Fort Worth
Arlington
Estimated median household income
$68,235
$59,889
Estimated per capita income
$34,106
$31,722
Cost of living index (U.S. average is 100)
95.4
95.9
If you make $50,000 in Fort Worth, you will have to make $50,262 in Arlington to maintain the same standard of living.
Geographical Conditions
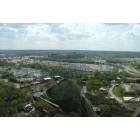
Geographically, Fort Worth is located in North Central Texas and has diverse terrain, including forests, hills, and lakes. Arlington, situated to its east, is slightly flatter and more urbanized.
Both cities offer robust education systems. Fort Worth has more colleges, including the prestigious Texas Christian University. Meanwhile, Arlington is home to a major public university, the University of Texas at Arlington. Both cities have a number of high-performing public and private schools, meaning families have a variety of good choices.
Fort Worth has a more diversified economy, with financial services, healthcare, and manufacturing being the main sectors. On the other hand, Arlington's economy relies more on entertainment, healthcare and education sectors. Still, both cities have strong job markets, with Fort Worth having a slightly lower unemployment rate than Arlington.
Biggest Employers
Fort Worth is home to prominent corporations such as American Airlines, Lockheed Martin, and Pier 1 Imports. In contrast, Arlington houses giants like the General Motors assembly plant and Texas Health Resources. Both cities boast a strong presence of industries offering a variety of job opportunities.
There were 7,236 building permits issued in Fort Worth in 2012 (4810 more than in 2011) compared to 976 building permits issued in Arlington in 2012 (744 more than in 2011).
Weather
The weather in both cities is typified by the Texas heat. Summers are hot and winters mild. Fort Worth is slightly cooler due to its more northern position, but differences are minimal. Both cities have the occasional snowfall in winters but are predominantly warm throughout the year. Regardless, when visiting or relocating, it’s recommended to brace yourself for the heat, especially during mid-summer.
Weather and climate
Type
Fort Worth
Arlington
Temperature - Average
65°F
65°F
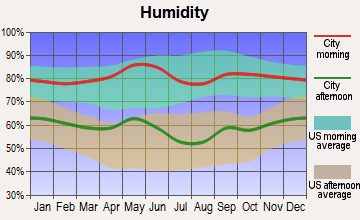
Humidity - Average morning or afternoon humidity
71.4%
71.4%
Humidity - Differences between morning and afternoon humidity
34.1%
34%
Humidity - Maximum monthly morning or afternoon humidity
82.1%
82%
Humidity - Minimum monthly morning or afternoon humidity
48%
48%
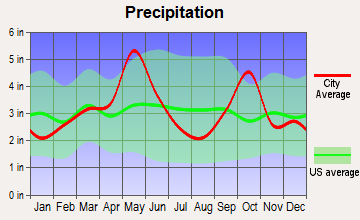
Precipitation - Yearly average
35 in
37.9 in
Snowfall - Yearly average
4.2 in
4.2 in
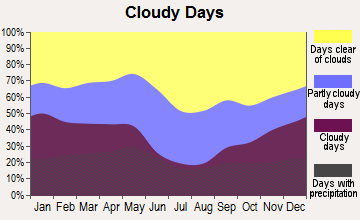
Clouds - Number of days clear of clouds
22.8%
22.7%
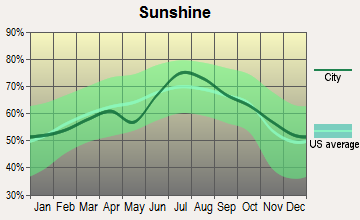
Sunshine amount - Average
66.6%
66.6%
Sunshine amount - Differences during a year
20%
20%
Sunshine amount - Maximum monthly
74%
74%
Sunshine amount - Minimum monthly
54%
54%
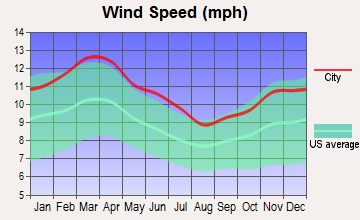
Wind speed - Average
10.3 mph
10.3 mph
Average climate in Fort Worth, Texas
Average climate in Arlington, Texas
Air pollution
Type
AQI
CO
NO2
OZONE
PM25
SO2
Year
Fort Worth
Arlington
Fort Worth
Arlington
Fort Worth
Arlington
Fort Worth
Arlington
Fort Worth
Arlington
Fort Worth
Arlington
2018
67
86
N/A
N/A
5.8
5.8
27.1
27.1
N/A
9.4
N/A
0.4
2017
67
86
N/A
N/A
6.2
6.2
27.2
27.2
N/A
9.1
N/A
0.3
2016
56
76
N/A
N/A
6.3
6.3
25.5
25.5
N/A
8.2
N/A
0.2
2015
61
80
N/A
N/A
6.5
6.5
24.8
24.8
N/A
8.6
N/A
0.3
2014
56
78
0.22
0.22
6.8
6.8
26.6
26.6
N/A
9.3
N/A
0.3
2013
64
96
0.25
0.25
6.4
6.4
26.5
27.2
N/A
11.0
N/A
0.2
2012
87
108
0.26
0.26
7.8
7.8
30.3
30.3
N/A
10.5
N/A
0.3
2011
79
96
0.23
0.23
7.9
8.2
30.7
30.7
N/A
9.5
N/A
0.6
2010
70
76
0.23
0.23
8.5
8.9
27.7
27.7
N/A
8.4
N/A
0.7
2009
81
91
0.25
0.25
8.7
8.7
29.5
29.5
N/A
8.5
N/A
0.5
2008
69
92
0.25
0.25
9.6
9.6
25.8
25.8
N/A
10.7
N/A
0.5
2007
75
95
0.30
0.30
10.6
10.6
24.6
24.6
N/A
9.8
N/A
0.5
2006
90
102
0.34
0.34
10.2
10.4
29.7
29.7
N/A
9.9
N/A
0.8
2005
102
110
0.34
0.34
10.9
11.7
28.4
28.4
11.3
11.3
0.9
1.0
2004
78
90
0.39
0.39
10.6
10.8
25.4
25.4
N/A
N/A
N/A
0.9
2003
82
97
0.40
0.40
11.1
11.1
27.2
27.2
N/A
N/A
N/A
1.0
2002
94
97
0.37
0.37
11.8
11.8
25.8
25.8
N/A
N/A
N/A
0.6
2001
16
88
0.48
0.48
N/A
14.7
N/A
25.0
N/A
N/A
N/A
1.1
2000
17
104
0.55
0.55
N/A
14.5
N/A
26.2
N/A
N/A
N/A
1.3
Natural disasters
Type
Fort Worth
Arlington
Tornado activity compared to U.S. average
249.6%
254.3%
Earthquake activity compared to U.S. average
562.8%
558.3%
Natural disasters compared to U.S. average
23%
23%
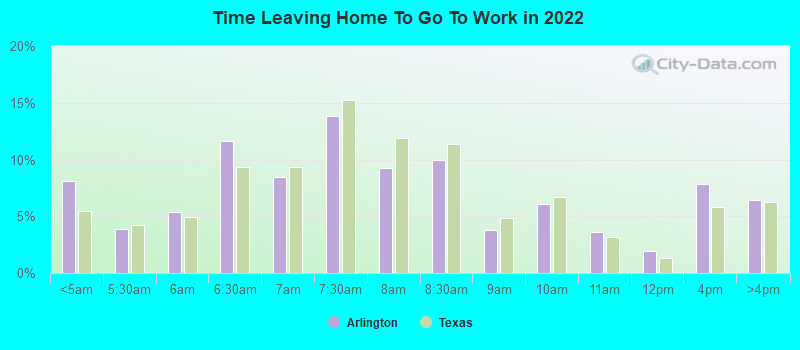
Transportation
Fort Worth offers a more robust public transportation network, including buses, trams, and rail services. Commute times are generally shorter in Fort Worth. Nevertheless, Arlington, although it has limited public transit, has excellent roadways, which means the majority of residents drive to work.
Transport
Type
Fort Worth
Arlington
Amtrak stations
1
0
Amtrak stations nearby
1
2
FAA registered aircraft
2
362
FAA registered aircraft manufacturers and dealers
19
5
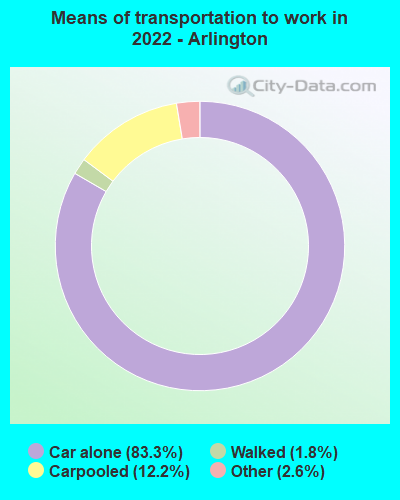
Means of transportation to work
Type
Fort Worth
Arlington
Bicycle
0.1%
0.2%
Bus
0.4%
0%
Carpooled
11%
11.9%
Car alone
85.8%
85%
Motorcycle
0.1%
0.1%
Walked
1.3%
1.4%
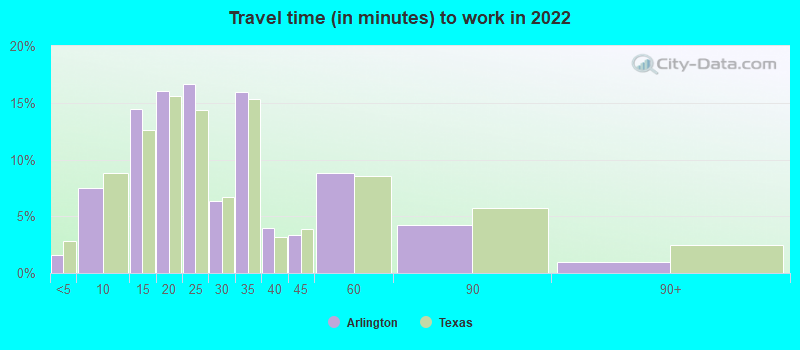
Average travel time to work
Type
Fort Worth
Arlington
Average
28.5 min
26.1 min
Other means
25.3 min
27.6 min
Public transportation
41.8 min
45.1 min
Private vehicle occupancy
Type
Fort Worth
Arlington
Average
1.2
1.2
Drove alone
87.6%
88.7%
In 2 person carpool
8.5%
7.8%
In 3 person carpool
2.5%
2.2%
In 4 person carpool
1.1%
0.8%
In 5-6 person carpool
0.3%
0.4%
How many people usually rode to work in the car, truck or van.
Real Estate
Real estate in Fort Worth tends to be more expensive than in Arlington, with a median home price above the national average. However, Arlington’s real estate market offers great value for money, with housing options that cater to various budgets.
Neighborhoods
Both Fort Worth and Arlington boast diverse neighborhoods, each with its unique charm. Fort Worth has neighborhoods that cater to different lifestyles, from the bustling Downtown to the family-friendly suburbs of Keller and Southlake. Meanwhile, Arlington has attractions like the Entertainment District and the serene suburbs of Pantego and Dalworthington Gardens.
Houses and residents
Type
Fort Worth
Arlington
Houses
361,341
156,653
Average household size (people)
2.8
2.7
Median year apartment built
1991
1983
Median year house/condo built
1995
1984
Length of stay in the house since moving in
11.2 years
13 years
Houses occupied
334,286 (92.5%)
146,888 (93.8%)
Houses occupied by owners
185,197 (55.4%)
78,883 (53.7%)
Houses occupied by renters
149,089 (44.6%)
68,005 (46.3%)
Median rent asked for vacant for-rent units
$1,068
$1,609
Median monthly housing costs
$1,328
$1,220
Median price asked for vacant for-sale houses and condos
$288,576
$199,415
Estimated median house or condo value
$249,000
$254,700
Median numbers of rooms
5.3
5.4
Median number of rooms in apartments
4.2
4.1
Median number of rooms in houses and condos
6.3
6.5
Median house price - detached houses
$279,885
$265,594
Median house price - in 2-unit structures
Over $1,000,000
$415,006
Median house price - in 3-to-4-unit structures
$337,081
$224,044
Median house price - in 5 or more unit structures
$298,062
$131,545
Median house price - mobile homes
$58,470
$92,300
Median house price - occupied boats, rvs, vans etc.
$16,069
$23,762
Median house price - Townhouses or other attached units
$279,957
$171,140
Median house price - All housing units
$279,281
$259,527
Median house age
29
37
Renting percentage
40.8%
42.6%
Housing density (houses/condos per square mile)
1,235.2
1,634.9
House value disparities
31.8%
25%
Household income disparities
43.6%
43.9%
Median household income for houses/condes with a mortgage
$106,170
$97,883
Median household income for apartments without a mortgage
$72,147
$67,452
Housing units without a mortgage
2,986 (2.4%)
948 (2%)
Housing units with both a second mortgage and home equity loan
3,696 (3%)
1,684 (3.6%)
Housing units with a mortgage
121,099 (97.6%)
46,456 (98%)
Housing units with a home equity loan
66 (0.1%)
0 (0%)
Housing units with a second mortgage
5,171 (4.2%)
1,967 (4.1%)
House/condo owner moved in on average (years ago)
8
13
House/condo renter moved in on average (years ago)
1
1
Housing units lacking complete kitchen facilities
1.8%
1.7%
Housing units lacking complete plumbing facilities
0.7%
1%
Housing units in structures
Housing units in structures
Fort Worth
Arlington
One, detached
65.4%
60.2%
One, attached
2.9%
10.8%
Two
1.6%
1.5%
3 or 4
4.1%
4.3%
5 to 9
5.8%
5.7%
10 to 19
6.5%
7.7%
20 to 49
4.6%
3.3%
50 or more
7.0%
5.2%
Mobile homes
2.1%
1.3%
Boats, RVs, vans, etc.
0.0%
0.1%
Median real estate property taxes paid for housing units
Self-employed workers in own not incorporated business
27,257
10,953
State government workers
8,587
6,771
Unpaid family workers
392
396
Industries and Occupations
In Fort Worth, key industries include aviation, healthcare, technology, and energy. Occupations are diverse, with many opportunities in professional services, manufacturing, education, and retail trade. Meanwhile, Arlington is known for its entertainment industry, with duties heavily aligned to it along with healthcare, education and retail.
Health diagnosing and treating practitioners and other technical occupations
5.6%
5.4%
Production occupations
4.4%
4.0%
Personal care and service occupations
3.7%
5.1%
Building and grounds cleaning and maintenance occupations
3.5%
3.2%
Material moving occupations
3.4%
3.6%
Arts, design, entertainment, sports, and media occupations
2.7%
1.2%
Health technologists and technicians
2.6%
1.9%
Community and social service occupations
2.3%
3.1%
Transportation occupations
2.0%
2.2%
Computer and mathematical occupations
1.7%
2.2%
Legal occupations
0.9%
1.5%
Health Care
Both cities offer excellent healthcare services, with a plethora of hospitals and specialized care facilities. Fort Worth has more hospitals, while Arlington is known for its state-of-the-art health research facilities due to the presence of the University of Texas at Arlington's strong health science program.
Both Fort Worth and Arlington boast well-developed infrastructure. Fort Worth, being the larger city, has a broader array of amenities. Arlington, however, is not far behind, with good infrastructure supporting sports, education, and entertainment sectors. Both cities continually invest in infrastructure development, keeping pace with population growth and industry needs.
Infrastructure
Type
Fort Worth
Arlington
Hospitals
76
39
TV stations
25
25
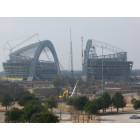
Arenas or stadiums
7
1
Bank branches located here
175
74
Bank institutions located here
42
23
Main business address for public companies
24
2
Drinking water stations with no reported violations in the past
3
0
Drinking water stations with reported violations in the past
HMDA - Conventional home purchase loans - Applications denied
Year
Fort Worth
Arlington
1999
3,575
1,768
2000
2,473
1,198
2001
2,109
1,140
2002
1,701
847
2003
2,183
1,216
2004
3,202
1,504
2005
4,261
2,158
2006
4,161
2,107
2007
2,871
1,390
2008
1,256
558
2009
585
235
Culture and Food
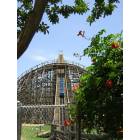
Culturally, both cities are rich and offer a plethora of opportunities to engage with the arts, music, and dining. Fort Worth boasts the famous Cultural District, with a spread of museums and art spaces. Arlington, while smaller, is not lesser in vibrancy and hosts many cultural and arts events, including music festivals. In terms of food, Fort Worth's barbecue and Tex-Mex are legendary, while Arlington has a burgeoning food scene with a blend of local and international cuisines.
Sports Teams
Arlington takes a lead in sports housing the Dallas Cowboys (NFL) and the Texas Rangers (MLB). Although Fort Worth does not host any major league teams, it does offer a robust local sports scene with options from rodeo to motorsports, given the presence of the Texas Motor Speedway.


 Fort Worth, TX
 Arlington, TX