El Paso, Texas and Tempe, Arizona, both have unique characteristics that make them compelling places to live and visit. Whether you're looking to relocate or just passing through, the comparison of these locales regarding crime and safety, cost of living, education, and other factors are worthwhile to consider. This analysis explores the different facets of life in both cities, providing a helpful guide for those contemplating where next to settle or vacation.
Distance between
El Paso, TX and
Tempe, AZ : 338.9 miles
El Paso's population is larger by 269%. Its population has grown by 114,753 people (20.4%) since 2000. The population of Tempe has grown by 25,493 people (16.1%) during that time.
Safety rates vary between El Paso, TX, and Tempe, AZ. El Paso boasts lower crime rates compared to the national average, making it one of the safest cities in the country. On the other hand, Tempe has somewhat higher crime rates compared to national levels. However, it's essential to note that specific neighborhoods may be safer than others.
City-data.com crime index counts serious crimes and violent crime more heavily. It adjusts for the number of visitors and daily workers commuting into cities. (higher means more crime, U.S. average = 301.1)
City-data.com crime index counts serious crimes and violent crime more heavily. It adjusts for the number of visitors and daily workers commuting into cities. (higher means more crime, U.S. average = 301.1)
Sex Offenders
According to our data, there are 1,253 registered sex offenders living in El Paso and 77 registered sex offenders living in . The ratio of residents to sex offenders in El Paso is 545 to 1; the ratio in Tempe is 2,370 to 1. The number of registered sex offenders compared to the number of residents is much larger in El Paso than that in Tempe.
Cost of Living
Regarding cost of living, El Paso has a more affordable cost of living compared to Tempe. General expenses such as groceries, housing, and transportation tend to be lower. However, both cities are relatively more affordable when compared to the national average.
Income Tax
Texas, including El Paso, does not levy a state income tax. On the other hand, Arizona, including Tempe, does have a state income tax that ranges from 2.59% to 4.50%.
Property Tax
Property taxes in El Paso are higher than in Tempe, which may affect the overall cost of housing in these cities. These rates vary based on specific neighborhoods.
Sales Tax
The sales tax in El Paso, Texas, is 8.25%, while in Tempe, Arizona, it is 8.1%.
Income
Type
El Paso
Tempe
Estimated median household income
$51,241
$68,662
Estimated per capita income
$25,670
$39,225
Cost of living index (U.S. average is 100)
82.2
102.6
If you make $50,000 in El Paso, you will have to make $62,409 in Tempe to maintain the same standard of living.
Geographical Conditions
Geographically, El Paso is located in the Chihuahuan Desert, offering rugged landscapes, mountains, and beautiful sunsets. Tempe, located in the Sonoran Desert, presents a unique desert panorama marked by Camelback Mountain and Salt River.
In terms of education, both cities have a mix of high-performing public and private schools. Tempe, home to Arizona State University, is a hub of higher education. El Paso also has a strong education sector, with the University of Texas at El Paso attracting students from all over the region.
El Paso's economy leans heavily on the employment provided by the military, specifically Fort Bliss. Healthcare, education, and government sectors also boost the city's economy. Tempe boasts a vibrant economy with a strong presence of technology, commerce, and education as its backbone.
Biggest Employers
In El Paso, some of the top employers include Fort Bliss, University Medical Center, and Ysleta Independent School District. Some of the largest employers in Tempe include Arizona State University, State Farm, and Honeywell.
There were 1,961 building permits issued in El Paso in 2012 (1005 less than in 2011) compared to 123 building permits issued in Tempe in 2012 (104 more than in 2011).
In El Paso (El Paso County), 65.5% voted for Democrats and 33.2% for Republicans in 2012 Presidential Election. In Tempe (Maricopa County), 43.6% voted for Democrats and 54.3% for Republicans.
Elections
Type
Democrats
Republicans
Other
Year
El Paso
Tempe
El Paso
Tempe
El Paso
Tempe
2020
66.8%
50.2%
31.6%
48.0%
1.6%
1.8%
2016
69.1%
44.9%
26.0%
47.7%
4.9%
7.5%
2012
65.5%
43.6%
33.2%
54.3%
1.3%
2.1%
2008
66.0%
44.0%
33.4%
54.5%
0.6%
1.5%
2004
56.2%
42.4%
43.3%
57.0%
0.5%
0.6%
2000
57.9%
43.0%
39.8%
53.4%
2.3%
3.6%
1996
62.3%
44.5%
32.1%
47.2%
5.6%
8.2%
Breakdown of population affiliated with a religious congregation
Type
Adherents
Congregations
Religion
El Paso
Tempe
El Paso
Tempe
CATHOLIC CHURCH
43.2%
13.6%
11.3%
4.3%
SOUTHERN BAPTIST CONVENTION
3.3%
1.9%
26.6%
6.5%
SEVENTH DAY ADVENTIST CHURCH
0.3%
0.4%
1.6%
2.0%
LUTHERAN CHURCH
0.2%
0.5%
1.0%
1.5%
EPISCOPAL CHURCH
0.1%
0.3%
1.0%
1.3%
EVANGELICAL LUTHERAN CHURCH IN AMERICA
0.1%
0.8%
1.0%
2.0%
VINEYARD USA
0.1%
0.3%
0.6%
0.6%
Weather
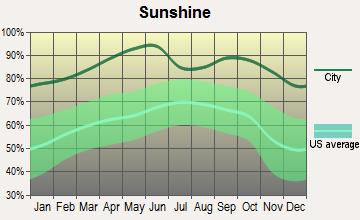
Weather-wise, Tempe, AZ, has a hot desert climate, with extremely high temperatures in summer but mild to warm winters. El Paso, on the other hand, experiences a hot semi-arid climate, with hot summers and relatively mild winters. Both cities receive little rainfall throughout the year. These climates make both cities ideal for outdoor activities most of the year.
Weather and climate
Type
El Paso
Tempe
Temperature - Average
64.6°F
71.4°F
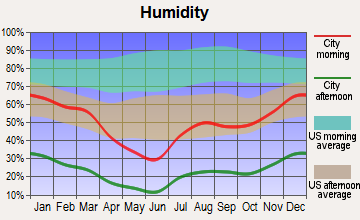
Humidity - Average morning or afternoon humidity
42.7%
37.5%
Humidity - Differences between morning and afternoon humidity
42.8%
48%
Humidity - Maximum monthly morning or afternoon humidity
59.8%
60%
Humidity - Minimum monthly morning or afternoon humidity
17%
12%
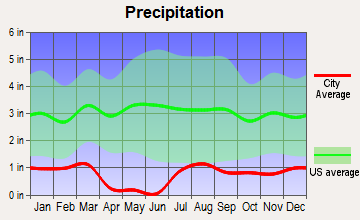
Precipitation - Yearly average
9.4 in
9.2 in
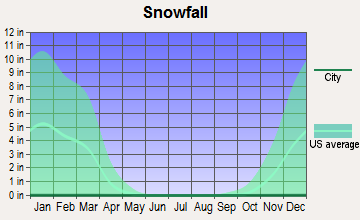
Snowfall - Yearly average
10.7 in
0 in
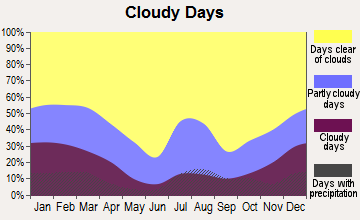
Clouds - Number of days clear of clouds
31.8%
35.2%
Sunshine amount - Average
89.4%
92.8%
Sunshine amount - Differences during a year
13.9%
16%
Sunshine amount - Maximum monthly
89.3%
95%
Sunshine amount - Minimum monthly
75.4%
79%
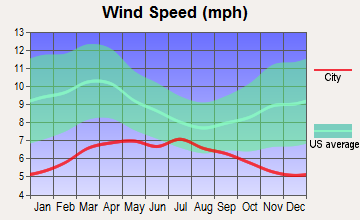
Wind speed - Average
8.9 mph
6.6 mph
Average climate in El Paso, Texas
Average climate in Tempe, Arizona
Air pollution
Type
AQI
CO
NO2
OZONE
PB
PM10
PM25
SO2
Year
El Paso
Tempe
El Paso
Tempe
El Paso
Tempe
El Paso
Tempe
El Paso
El Paso
Tempe
El Paso
Tempe
El Paso
Tempe
2018
139
206
0.17
0.31
14.0
15.1
32.0
26.5
N/A
N/A
35.7
27.3
9.2
7.2
N/A
0.6
2017
173
132
0.19
0.33
13.0
15.8
30.5
25.5
N/A
N/A
40.4
24.3
9.5
7.2
0.5
1.4
2016
148
126
0.17
0.33
12.6
15.8
30.6
26.1
N/A
N/A
35.2
22.3
9.2
6.9
0.5
0.4
2015
112
104
0.18
0.37
12.7
17.8
30.8
27.2
N/A
N/A
31.2
21.6
8.0
7.2
0.5
0.9
2014
157
135
0.13
0.38
12.8
19.9
30.0
25.7
N/A
N/A
40.3
29.2
9.7
8.7
0.4
1.1
2013
211
148
0.23
0.36
14.1
20.2
30.5
26.3
N/A
N/A
43.9
28.7
10.8
8.7
0.4
0.9
2012
229
166
0.30
0.46
15.9
21.5
31.6
25.7
N/A
N/A
40.2
35.8
11.6
9.6
0.4
1.3
2011
221
205
0.23
0.42
15.9
18.7
31.2
24.9
N/A
N/A
34.7
41.3
11.6
9.5
0.5
0.9
2010
211
100
0.25
0.38
15.3
16.5
29.4
25.5
N/A
N/A
28.8
29.2
7.9
8.3
0.3
1.2
2009
117
109
0.23
0.51
15.4
16.7
29.5
26.6
N/A
N/A
28.6
37.9
8.3
N/A
0.3
1.0
2008
210
106
0.25
0.38
15.2
17.6
30.1
27.1
0.017
N/A
34.6
40.0
9.7
N/A
0.6
1.1
2007
134
135
0.28
0.40
13.9
19.5
30.6
26.4
0.019
N/A
40.5
48.1
8.4
N/A
0.4
1.9
2006
241
138
0.37
0.56
14.3
22.2
30.6
26.4
0.018
N/A
55.0
51.5
11.1
N/A
0.3
1.8
2005
159
109
0.43
0.52
13.1
22.7
29.6
23.9
0.013
N/A
44.5
44.9
9.6
N/A
0.6
1.7
2004
183
98
0.38
0.47
13.5
22.5
29.2
23.7
0.020
N/A
47.3
34.2
8.2
N/A
0.4
1.4
2003
278
101
0.46
0.66
15.5
23.6
29.5
24.5
0.039
N/A
60.4
42.6
10.8
N/A
0.6
1.4
2002
203
111
0.43
0.78
16.4
23.9
30.5
24.6
0.034
N/A
53.3
41.8
11.0
N/A
0.4
1.6
2001
139
106
0.51
0.71
15.5
22.4
28.7
25.2
0.046
N/A
N/A
37.8
9.8
N/A
0.7
1.5
2000
145
117
0.67
0.84
17.8
29.0
27.8
25.8
0.072
N/A
N/A
45.6
9.1
N/A
1.0
1.7
Natural disasters
Type
El Paso
Tempe
Tornado activity compared to U.S. average
4.2%
18.6%
Earthquake activity compared to U.S. average
524.4%
2,459.2%
Natural disasters compared to U.S. average
11%
16%
Transportation
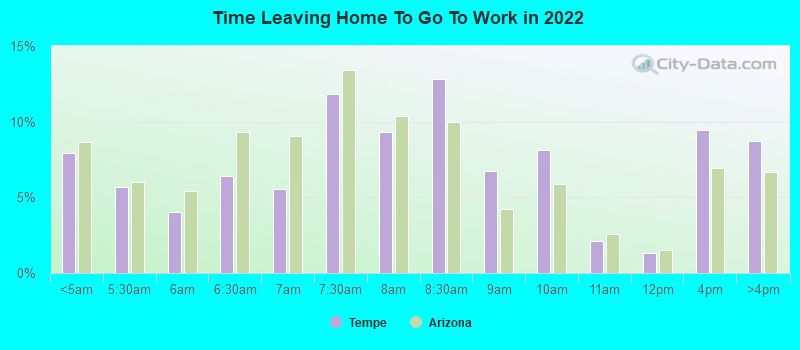
Both El Paso and Tempe offer public transportation, but El Paso's is more comprehensive with Sun Metro bus service. Tempe, though smaller, offers a light rail service besides buses. Both cities are bike-friendly, but Tempe is considered more walkable.
Transport
Type
El Paso
Tempe
Amtrak stations
1
0
Amtrak stations nearby
1
3
FAA registered aircraft
331
172
FAA registered aircraft manufacturers and dealers
6
2
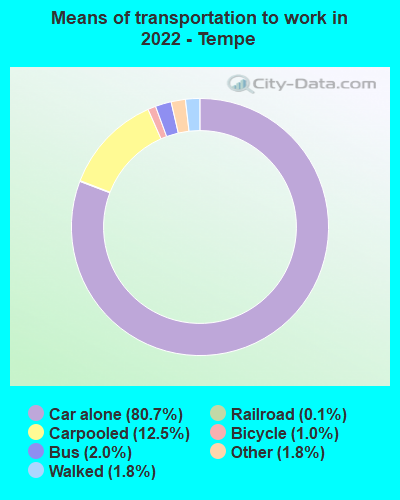
Means of transportation to work
Type
El Paso
Tempe
Bicycle
0.3%
1.2%
Bus
1.3%
1.3%
Carpooled
11.2%
8.4%
Car alone
83.4%
84.4%
Motorcycle
0.2%
0.5%
Railroad
0%
0.3%
Walked
1.6%
2.1%
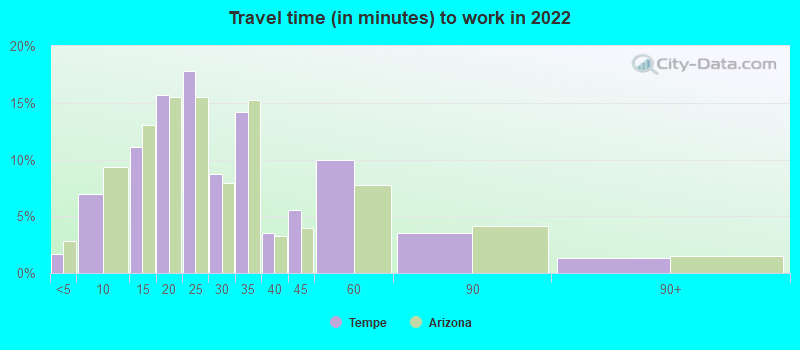
Average travel time to work
Type
El Paso
Tempe
Average
25.1 min
27.9 min
Other means
22.2 min
21.3 min
Public transportation
46.4 min
37.7 min
Private vehicle occupancy
Type
El Paso
Tempe
Average
1.2
1.2
Drove alone
88.5%
89.2%
In 2 person carpool
7.9%
8%
In 3 person carpool
2.1%
1.3%
In 4 person carpool
0.7%
1%
In 5-6 person carpool
0.7%
0.4%
In 7+ person carpool
0.1%
0.2%
How many people usually rode to work in the car, truck or van.
Real Estate
Real estate prices vary between El Paso and Tempe, with El Paso offering more affordable housing options. In contrast, Tempe has higher real estate prices but also offers a wide range of housing, from luxury condos to single-family homes.
Neighborhoods
Both cities offer diverse neighborhoods. El Paso’s neighborhoods, such as the historic Sunset Heights and charming Kern Place, offer a diverse range of housing. Meanwhile, Tempe neighborhoods, like Maple-Ash and Mitchell Park, are bustling and provide a great mix of residential and commercial establishments.
Houses and residents
Type
El Paso
Tempe
Houses
261,779
83,172
Average household size (people)
3
2.3
Median year apartment built
1982
1987
Median year house/condo built
1985
1978
Length of stay in the house since moving in
14.7 years
12.8 years
Houses occupied
242,529 (92.6%)
77,306 (92.9%)
Houses occupied by owners
147,788 (60.9%)
32,131 (41.6%)
Houses occupied by renters
94,741 (39.1%)
45,175 (58.4%)
Median rent asked for vacant for-rent units
$570.82
$1,629
Median monthly housing costs
$939
$1,396
Median price asked for vacant for-sale houses and condos
$227,007
$376,423
Estimated median house or condo value
$152,800
$414,600
Median numbers of rooms
5.4
4.6
Median number of rooms in apartments
4.3
3.7
Median number of rooms in houses and condos
6.2
6.2
Median house price - detached houses
$187,761
$504,906
Median house price - in 3-to-4-unit structures
$75,782
$244,896
Median house price - in 5 or more unit structures
$266,003
$285,650
Median house price - mobile homes
$43,095
$67,979
Median house price - Townhouses or other attached units
$149,459
$285,355
Median house price - All housing units
$186,951
$445,318
Median house age
38
38
Renting percentage
39.6%
55.5%
Housing density (houses/condos per square mile)
1,051
2,076
House value disparities
32.7%
29.3%
Household income disparities
46.6%
43.4%
Median household income for houses/condes with a mortgage
$74,665
$110,111
Median household income for apartments without a mortgage
$52,954
$79,940
Housing units without a mortgage
1,889 (2.2%)
117 (0.6%)
Housing units with both a second mortgage and home equity loan
2,956 (3.4%)
900 (4.3%)
Housing units with a mortgage
84,973 (97.8%)
20,667 (99.4%)
Housing units with a home equity loan
250 (0.3%)
74 (0.4%)
Housing units with a second mortgage
3,635 (4.2%)
1,121 (5.4%)
House/condo owner moved in on average (years ago)
14
10
House/condo renter moved in on average (years ago)
1
1
Housing units lacking complete kitchen facilities
2%
1%
Housing units lacking complete plumbing facilities
2%
0.2%
Housing units in structures
Housing units in structures
El Paso
Tempe
One, detached
67.7%
38.8%
One, attached
4.4%
10.3%
Two
2.4%
1.4%
3 or 4
4.1%
5.6%
5 to 9
5.9%
8.0%
10 to 19
5.8%
9.2%
20 to 49
2.4%
6.4%
50 or more
4.8%
17.9%
Mobile homes
2.3%
2.3%
Boats, RVs, vans, etc.
0.2%
0.1%
Median real estate property taxes paid for housing units
Self-employed workers in own not incorporated business
19,650
3,946
State government workers
12,525
7,749
Unpaid family workers
901
80
Industries and Occupations
El Paso's core industries include healthcare, education, and military, while the job market in Tempe is more diverse, encompassing tech, education, retail, and healthcare. Both cities host multiple company headquarters and have abundant job opportunities.
El Paso is home to several top-ranked hospitals such as University Medical Center of El Paso and Las Palmas Medical Center. Tempe has access to excellent healthcare facilities, including the Banner Desert Medical Center and Tempe St. Luke's Hospital.
Health (county statistics)
Type
El Paso
Tempe
General health status score of residents in this county from 1 (poor) to 5 (excellent)
In terms of infrastructure, both cities are well connected by roadways and airports. El Paso is bifurcated by Interstate 10, while Tempe is traversed by several highways including Interstate 10, US Highway 60, and Loop 101. Both cities have functioning public transportation systems, but El Paso's is more extensive.
Infrastructure
Type
El Paso
Tempe
TV stations
10
22
Arenas or stadiums
2
2
Bank branches located here
89
38
Bank institutions located here
19
15
Main business address for public companies
7
11
Drinking water stations with reported violations in the past
HMDA - Conventional home purchase loans - Applications denied
Year
El Paso
Tempe
1999
1,994
683
2000
993
588
2001
704
385
2002
594
372
2003
1,268
395
2004
1,646
603
2005
2,316
913
2006
2,701
747
2007
2,051
506
2008
1,034
249
2009
454
129
Culture and Food
Both cities have rich cultural histories. El Paso offers a blend of Mexican and Texan cultures and cuisines. Tempe's culture is influenced by its university community and diverse population, with a multitude of restaurants and food choices.
Sports Teams
El Paso and Tempe are home to various sports teams. El Paso has the Chihuahuas (AAA Baseball) and Locomotive FC (USL Soccer), while Tempe is home to the Arizona Cardinals (NFL), Arizona State University Sun Devils, and spring training for the Los Angeles Angels (MLB).


 El Paso, TX
 Tempe, AZ