El Paso, TX and Southwest San Gabriel Valley, CA are two distinct cities in the United States offering unique living experiences. They present differences in crime rates, weather conditions, cost of living, education, work and economy, among other aspects. This comprehensive comparison will shine light on life in these cities for both potential relocators and tourists, providing key insights about each area's strengths and qualities.
The crime rate in El Paso, TX is considerably lower than that in Southwest San Gabriel Valley, CA, making El Paso one of the safer cities in the United States. This has been a major factor drawing both residents and tourists alike. Southwest San Gabriel Valley, although not egregious, has higher crime rates in comparison, which may deter some potential residents or visitors.
Cost of Living
The cost of living in El Paso is significantly lower than in Southwest San Gabriel Valley. Housing in El Paso is very affordable compared to the high costs in California. This cost differential extends to groceries, health care, and transportation. Potential relocatees, especially those on a budget, may find El Paso more appealing in this regard.
Income Tax
While residents in El Paso, Texas, enjoy no state income tax, those living in Southwest San Gabriel Valley, California, face one of the highest state income taxes in the country. This may significantly influence the net income of potential relocators.
Property Tax
The average property tax rate in El Paso is around 2.13%, while the rate in Southwest San Gabriel Valley stands at approximately 0.77%. Although the property tax rate is lower in California, the high property values can lead to substantial tax bills.
Sales Tax
Sales tax in El Paso, Texas is currently 8.25%, while the sales tax in Southwest San Gabriel Valley is 9.5%. This difference might influence the cost of living and overall expenses in these two communities.
Income
Type
El Paso
Southwest San Gabriel Valley
Estimated median household income
$51,241
$73,720
Estimated per capita income
$25,670
$29,945
Cost of living index (U.S. average is 100)
82.2
161.2
If you make $50,000 in El Paso, you will have to make $98,054 in Southwest San Gabriel Valley to maintain the same standard of living.
Geographical Conditions
El Paso is located on the Rio Grande, with a mountainous and desert landscape, offering many outdoor recreational opportunities. Southwest San Gabriel Valley is situated near the San Gabriel Mountains and the Pacific Coast, also offering diverse outdoor activities.
Geographical information
Type
El Paso
Southwest San Gabriel Valley
Land area
249.1 sq. miles
35.3 sq. miles
Population density
2,723.7 people per sq. mile
9,252.7 people per sq. mile
Relative area comparison
El Paso, TX Southwest San Gabriel Valley, CA
Education
Both cities have their strengths when it comes to education. El Paso has a well-established public school system with a successful bilingual education program. On the other hand, Southwest San Gabriel Valley, being part of California, provides access to renowned universities and institutions.
El Paso's economy is largely driven by federal government jobs, healthcare, and education. The job growth rate in El Paso has been consistently positive over the years. Southwest San Gabriel Valley's economy, meanwhile, is more diversified, with industries ranging from healthcare, education, to entertainment.
Biggest Employers
In El Paso, the biggest employers are the federal government, University Medical Center, and the El Paso school district. In Southwest San Gabriel Valley, healthcare companies like Kaiser Permanente and retailers like Target and Walmart are among the largest employers.
In El Paso (El Paso County), 65.5% voted for Democrats and 33.2% for Republicans in 2012 Presidential Election. In Southwest San Gabriel Valley (Los Angeles County), 69.7% voted for Democrats and 27.8% for Republicans.
Elections
Type
Democrats
Republicans
Other
Year
El Paso
Southwest San Gabriel Valley
El Paso
Southwest San Gabriel Valley
El Paso
Southwest San Gabriel Valley
2020
66.8%
71.0%
31.6%
26.9%
1.6%
2.1%
2016
69.1%
72.0%
26.0%
22.5%
4.9%
5.5%
2012
65.5%
69.7%
33.2%
27.8%
1.3%
2.4%
2008
66.0%
69.2%
33.4%
28.8%
0.6%
1.9%
2004
56.2%
63.3%
43.3%
35.7%
0.5%
1.0%
2000
57.9%
63.6%
39.8%
32.4%
2.3%
4.0%
1996
62.3%
59.3%
32.1%
31.0%
5.6%
9.7%
Breakdown of population affiliated with a religious congregation
Type
Adherents
Congregations
Religion
El Paso
Southwest San Gabriel Valley
El Paso
Southwest San Gabriel Valley
CATHOLIC CHURCH
43.2%
36.1%
11.3%
4.7%
SOUTHERN BAPTIST CONVENTION
3.3%
1.0%
26.6%
9.0%
SEVENTH DAY ADVENTIST CHURCH
0.3%
0.5%
1.6%
2.4%
EPISCOPAL CHURCH
0.1%
0.4%
1.0%
1.4%
MUSLIM ESTIMATE
0.1%
0.7%
0.2%
1.0%
Weather
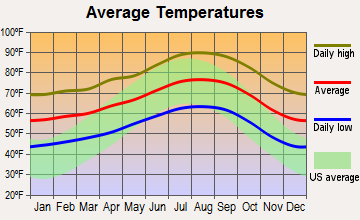
El Paso enjoys warm, sunny weather most of the year with mild winters. This is ideal for those who enjoy outdoor activities. In contrast, Southwest San Gabriel Valley, located in Southern California, is known for its Mediterranean climate with warm, dry summers and mild, wet winters. Both cities are great for people who enjoy sunshine and milder winter seasons.
Weather and climate
Type
El Paso
Southwest San Gabriel Valley
Temperature - Average
64.6°F
66.3°F
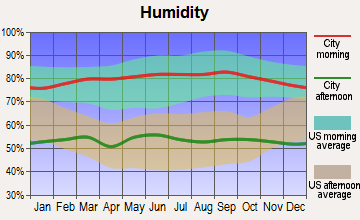
Humidity - Average morning or afternoon humidity
42.7%
61.4%
Humidity - Differences between morning and afternoon humidity
42.8%
16.5%
Humidity - Maximum monthly morning or afternoon humidity
59.8%
65.8%
Humidity - Minimum monthly morning or afternoon humidity
17%
49.3%
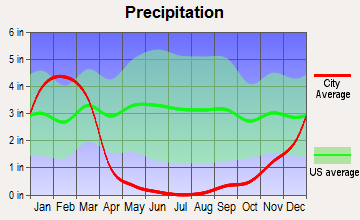
Precipitation - Yearly average
9.4 in
17.6 in
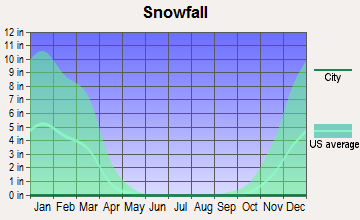
Snowfall - Yearly average
10.7 in
0 in
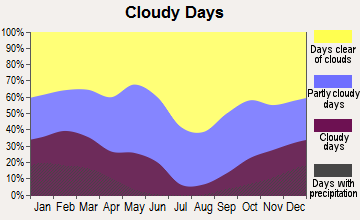
Clouds - Number of days clear of clouds
31.8%
30.1%
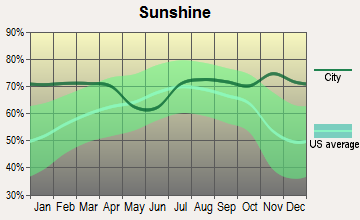
Sunshine amount - Average
89.4%
78.4%
Sunshine amount - Differences during a year
13.9%
22%
Sunshine amount - Maximum monthly
89.3%
85%
Sunshine amount - Minimum monthly
75.4%
63%
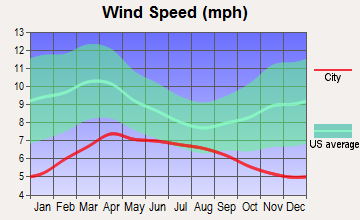
Wind speed - Average
8.9 mph
2.3 mph
Average climate in El Paso, Texas
Average climate in Southwest San Gabriel Valley, California
Air pollution
Type
AQI
CO
NO2
OZONE
PB
PM10
PM25
SO2
Year
El Paso
Southwest San Gabriel Valley
El Paso
Southwest San Gabriel Valley
El Paso
Southwest San Gabriel Valley
El Paso
Southwest San Gabriel Valley
El Paso
Southwest San Gabriel Valley
El Paso
Southwest San Gabriel Valley
El Paso
Southwest San Gabriel Valley
El Paso
Southwest San Gabriel Valley
2018
139
140
0.17
0.39
14.0
14.2
32.0
26.6
N/A
0.008
35.7
27.5
9.2
15.1
N/A
0.4
2017
173
142
0.19
0.38
13.0
15.1
30.5
27.8
N/A
0.007
40.4
30.2
9.5
15.3
0.5
0.5
2016
148
128
0.17
0.36
12.6
15.2
30.6
26.5
N/A
0.007
35.2
27.8
9.2
14.3
0.5
0.4
2015
112
137
0.18
0.36
12.7
15.3
30.8
26.7
N/A
0.006
31.2
27.6
8.0
16.4
0.5
0.3
2014
157
138
0.13
0.39
12.8
16.3
30.0
26.8
N/A
0.007
40.3
29.9
9.7
18.0
0.4
0.4
2013
211
140
0.23
0.44
14.1
17.5
30.5
25.2
N/A
0.007
43.9
28.3
10.8
17.0
0.4
0.4
2012
229
144
0.30
0.47
15.9
17.7
31.6
25.0
N/A
0.007
40.2
27.6
11.6
18.1
0.4
0.5
2011
221
142
0.23
0.50
15.9
19.3
31.2
23.6
N/A
0.008
34.7
29.8
11.6
17.6
0.5
0.4
2010
211
128
0.25
0.52
15.3
19.4
29.4
22.9
N/A
0.020
28.8
30.0
7.9
16.3
0.3
0.5
2009
117
150
0.23
0.43
15.4
21.5
29.5
23.5
N/A
0.011
28.6
40.0
8.3
18.0
0.3
0.5
2008
210
152
0.25
0.53
15.2
23.5
30.1
22.8
0.017
0.014
34.6
39.1
9.7
18.3
0.6
0.6
2007
134
128
0.28
0.58
13.9
24.2
30.6
21.8
0.019
0.017
40.5
N/A
8.4
N/A
0.4
1.1
2006
241
125
0.37
0.63
14.3
24.6
30.6
22.1
0.018
0.009
55.0
N/A
11.1
N/A
0.3
1.7
2005
159
123
0.43
0.66
13.1
25.6
29.6
20.5
0.013
0.015
44.5
N/A
9.6
N/A
0.6
2.1
2004
183
132
0.38
0.77
13.5
27.7
29.2
22.9
0.020
0.019
47.3
N/A
8.2
N/A
0.4
2.4
2003
278
143
0.46
0.98
15.5
31.8
29.5
22.0
0.039
0.027
60.4
N/A
10.8
N/A
0.6
1.8
2002
203
137
0.43
1.00
16.4
33.0
30.5
21.1
0.034
0.025
53.3
N/A
11.0
N/A
0.4
2.4
2001
139
143
0.51
1.11
15.5
34.2
28.7
18.9
0.046
0.039
N/A
N/A
9.8
N/A
0.7
2.4
2000
145
147
0.67
1.12
17.8
33.4
27.8
18.9
0.072
0.033
N/A
N/A
9.1
N/A
1.0
1.4
Natural disasters
Type
El Paso
Southwest San Gabriel Valley
Tornado activity compared to U.S. average
4.2%
18%
Earthquake activity compared to U.S. average
524.4%
7,182.3%
Natural disasters compared to U.S. average
11%
57%
Transportation
Public transportation in El Paso is facilitated by Sun Metro, which runs bus services throughout the city. Southwest San Gabriel Valley is serviced by several public transit providers, including Metro and Foothill Transit. Both cities provide good connectivity but traffic congestion can be a factor in the Los Angeles area.
Transport
Type
El Paso
Southwest San Gabriel Valley
Amtrak stations
1
0
Amtrak stations nearby
1
3
FAA registered aircraft
331
0
FAA registered aircraft manufacturers and dealers
6
0
Means of transportation to work
Type
El Paso
Southwest San Gabriel Valley
Bicycle
0.3%
0.5%
Bus
1.3%
4.7%
Carpooled
11.2%
16.1%
Car alone
83.4%
73%
Motorcycle
0.2%
0.1%
Walked
1.6%
2.5%
Average travel time to work
Type
El Paso
Southwest San Gabriel Valley
Average
25.1 min
29.1 min
Real Estate
The real estate market in El Paso is more affordable than in Southwest San Gabriel Valley. El Paso offers lower home prices, making it an attractive option for potential homeowners, while property values in Southwest San Gabriel Valley are significantly higher.
Neighborhoods
El Paso is known for its family-friendly neighborhoods, such as Sunset Heights and Kern Place, each with their unique charm. The Southwest San Gabriel Valley is equally diverse, with neighborhoods varying from upscale San Marino to more affordable alternatives.
Houses and residents
Type
El Paso
Southwest San Gabriel Valley
Houses
261,779
102,656
Average household size (people)
3
3.1
Houses occupied
242,529 (92.6%)
99,543 (97%)
Houses occupied by owners
147,788 (60.9%)
47,333 (47.6%)
Houses occupied by renters
94,741 (39.1%)
52,210 (52.5%)
Median rent asked for vacant for-rent units
$570.82
$1,828
Median price asked for vacant for-sale houses and condos
$227,007
$1,138,428
Estimated median house or condo value
$152,800
$723,161
Median number of rooms in apartments
4.3
3.7
Median number of rooms in houses and condos
6.2
5.9
Renting percentage
39.6%
51.7%
Housing density (houses/condos per square mile)
1,051
2,909.6
Household income disparities
46.6%
44%
Housing units without a mortgage
1,889 (2.2%)
13,166 (31.1%)
Housing units with both a second mortgage and home equity loan
2,956 (3.4%)
88 (0.2%)
Housing units with a mortgage
84,973 (97.8%)
29,118 (68.9%)
Housing units with a home equity loan
250 (0.3%)
2,557 (6%)
Housing units with a second mortgage
3,635 (4.2%)
2,975 (7%)
Housing units lacking complete kitchen facilities
2%
1.5%
Housing units lacking complete plumbing facilities
Self-employed workers in own not incorporated business
19,650
8,660
State government workers
12,525
4,158
Unpaid family workers
901
639
Industries and Occupations
Healthcare, education, retail, and government services dominate the industries in El Paso with a focus on service occupations. On the other hand, in Southwest San Gabriel Valley, professional, scientific, and technical services, healthcare, and retail trade are the leading industries
Both El Paso and Southwest San Gabriel Valley have a variety of healthcare options. El Paso hosts major hospitals like University Medical Center and Las Palmas Medical Center. Southwest San Gabriel Valley benefits from numerous renowned medical facilities.
Health (county statistics)
Type
El Paso
Southwest San Gabriel Valley
General health status score of residents in this county from 1 (poor) to 5 (excellent)
Infrastructure in both cities includes transportation, utilities, and public services. El Paso boasts a comprehensive road network and an International airport. Southwest San Gabriel Valley, being part of the Greater Los Angeles area, is serviced by multiple major freeways and public transportation options.
Infrastructure
Type
El Paso
Southwest San Gabriel Valley
TV stations
10
26
Culture and Food
El Paso boasts a rich blend of Mexican and American cultures reflected in its food scene, art, and festivities. Southwest San Gabriel Valley is a melting pot of cultures, known for its diverse food scene, especially Asian cuisine, and hosts various cultural festivals and events.
Sports Teams
El Paso has a minor league baseball team and a Division I college basketball team. On the other hand, Southwest San Gabriel Valley, being close to Los Angeles, provides access to professional sports teams like the LA Dodgers, Lakers, and Rams.
 El Paso, TX
 Southwest San Gabriel Valley, CA