El Paso, Texas, and the South Coast of California each offer residents and tourists unique opportunities and experiences, with distinct advantages in different areas. El Paso is a border city known for its Tex-Mex culture and low cost of living, while the South Coast of California is a popular destination for its idyllic climate, flourishing industries, and higher quality of life. As we compare these two regions, we will consider factors that matter most to potential residents and tourists, including the cost of living, educational opportunities, employment landscape, real estate market, and cultural vibrancy.
El Paso is consistently ranked as one of the safest large cities in the US. Even though it is located on the US-Mexico border, El Paso has a low crime rate, which adds to the appeal of the city for both residents and tourists. On the other hand, the South Coast of California has higher crime rates on average overall, but individual city crime rates vary widely. Despite this, the region is generally safe for tourists, with most crimes limited to property theft.
Cost of Living
El Paso is known for its low cost of living — it's one of the most affordable large cities in the United States. Everything from housing, groceries to healthcare is below the national average. Meanwhile, the South Coast of California is significantly more expensive, with a cost of living much higher than the national average. Potential residents should weigh these costs against the increased opportunities and amenities found in California.
Income Tax
Texas, including El Paso, does not have a state income tax, which can be a significant advantage to residents. On the other hand, California has one of the highest state income tax rates in the country, with rates ranging from 1% to 13.3%.
Property Tax
Property tax rates in El Paso vary by region but are generally higher than those in California. However, this should be taken in context of the significantly lower home prices in El Paso. California's property tax rate is lower, but again, the actual out-of-pocket costs can be high due to the state's high housing prices.
Sales Tax
Sales tax in El Paso is 8.25%, which is lower than the California state sales tax of 7.25% plus local city and county sales taxes, which can add significantly more. The South Coast, in particular, often has a total sales tax rate between 9% and 10%, depending on the specific locality.
Income
Type
El Paso
South Coast
Estimated median household income
$51,241
$112,870
Estimated per capita income
$25,670
$68,453
Cost of living index (U.S. average is 100)
82.2
96.8
If you make $50,000 in El Paso, you will have to make $58,881 in South Coast to maintain the same standard of living.
Geographical Conditions
El Paso is located in the high desert and is surrounded by mountains, providing opportunities for outdoor activities such as hiking and mountain biking. The South Coast of California is known for its beautiful coastline, sandy beaches, and mild climate, offering residents and visitors abundant opportunities for recreational activities like surfing and sailing.
Geographical information
Type
El Paso
South Coast
Land area
249.1 sq. miles
101 sq. miles
Population density
2,723.7 people per sq. mile
2,953.2 people per sq. mile
Relative area comparison
El Paso, TX South Coast, CA
Education
Both El Paso and the South Coast of California offer good educational opportunities. El Paso's education system is mostly served by one large district, El Paso ISD, plus a few smaller ones. Some of the high schools have lower rankings, but the district also contains several excellent schools. The South Coast, however, has a wider range of options and is known for outstanding schools at all levels, from elementary to high school, including some of the nation's top-ranked public high schools.
El Paso's economy is stable, but job growth remains slower than the national average. Many jobs are tied to the healthcare sector, the local military base, or other public sector jobs. Conversely, the South Coast's economy is varied and robust, with sectors ranging from technology, entertainment, and tourism to a significant presence in aerospace, finance, and healthcare. These industries offer a wide range of job opportunities, often with higher wages than those found in El Paso.
Biggest Employers
In El Paso, the biggest employers are healthcare providers and school districts, along with Fort Bliss, one of the largest military installations in the US. The South Coast of California is home to many large companies, including Disney, Netflix, Snap Inc., Aerospace Corporation, and major hospital networks.
In El Paso (El Paso County), 65.5% voted for Democrats and 33.2% for Republicans in 2012 Presidential Election. In South Coast (Orange County), 45.8% voted for Democrats and 52.0% for Republicans.
Elections
Type
Democrats
Republicans
Other
Year
El Paso
South Coast
El Paso
South Coast
El Paso
South Coast
2020
66.8%
53.6%
31.6%
44.6%
1.6%
1.8%
2016
69.1%
50.9%
26.0%
42.4%
4.9%
6.7%
2012
65.5%
45.8%
33.2%
52.0%
1.3%
2.3%
2008
66.0%
47.8%
33.4%
50.3%
0.6%
1.9%
2004
56.2%
39.3%
43.3%
60.2%
0.5%
0.5%
2000
57.9%
40.4%
39.8%
55.9%
2.3%
3.7%
1996
62.3%
37.9%
32.1%
51.7%
5.6%
10.5%
Breakdown of population affiliated with a religious congregation
Type
Adherents
Congregations
Religion
El Paso
South Coast
El Paso
South Coast
CATHOLIC CHURCH
43.2%
26.5%
11.3%
4.4%
SOUTHERN BAPTIST CONVENTION
3.3%
2.3%
26.6%
8.8%
SEVENTH DAY ADVENTIST CHURCH
0.3%
0.4%
1.6%
1.3%
LUTHERAN CHURCH
0.2%
0.6%
1.0%
2.0%
EPISCOPAL CHURCH
0.1%
0.4%
1.0%
1.4%
EVANGELICAL LUTHERAN CHURCH IN AMERICA
0.1%
0.4%
1.0%
2.3%
MUSLIM ESTIMATE
0.1%
0.8%
0.2%
1.3%
REFORMED CHURCH IN AMERICA
0.0%
0.3%
0.0%
0.2%
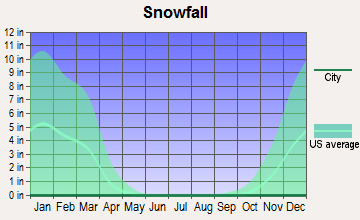
Weather
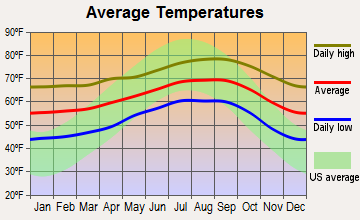
California's South Coast boasts moderate and consistent weather, often described as a Mediterranean climate. Mild, dry summers and cool, wet winters make it a year-round destination for both tourists and residents. El Paso, on the other hand, experiences a harsher desert climate with extremely hot summers and mild winters. This could be appealing to those who favor consistent sunshine and dry weather, though it may require more adjustments in terms of lifestyle and climate preparedness.
Weather and climate
Type
El Paso
South Coast
Temperature - Average
64.6°F
62.1°F
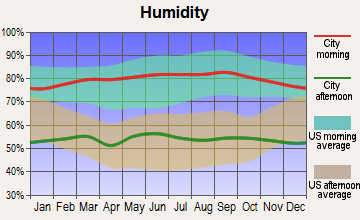
Humidity - Average morning or afternoon humidity
42.7%
69.1%
Humidity - Differences between morning and afternoon humidity
42.8%
24.6%
Humidity - Maximum monthly morning or afternoon humidity
59.8%
77%
Humidity - Minimum monthly morning or afternoon humidity
17%
52.4%
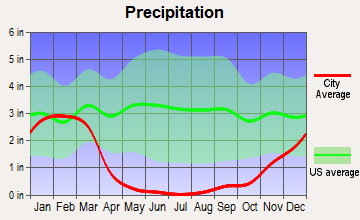
Precipitation - Yearly average
9.4 in
13.4 in
Snowfall - Yearly average
10.7 in
0 in
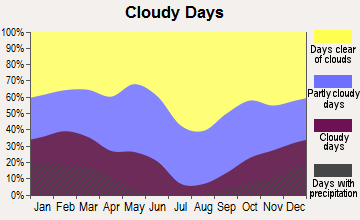
Clouds - Number of days clear of clouds
31.8%
26.7%
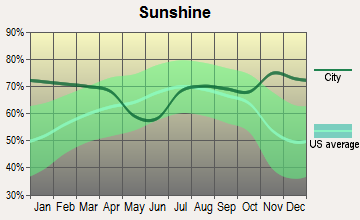
Sunshine amount - Average
89.4%
77.6%
Sunshine amount - Differences during a year
13.9%
20.5%
Sunshine amount - Maximum monthly
89.3%
81.9%
Sunshine amount - Minimum monthly
75.4%
61.4%
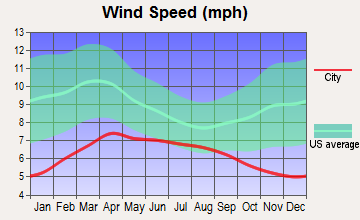
Wind speed - Average
8.9 mph
5.5 mph
Average climate in El Paso, Texas
Average climate in South Coast, California
Air pollution
Type
AQI
CO
NO2
OZONE
PB
PM10
PM25
SO2
Year
El Paso
South Coast
El Paso
South Coast
El Paso
South Coast
El Paso
South Coast
El Paso
El Paso
South Coast
El Paso
South Coast
El Paso
South Coast
2018
139
105
0.17
0.18
14.0
8.6
32.0
34.0
N/A
N/A
35.7
22.7
9.2
7.0
N/A
N/A
2017
173
111
0.19
0.21
13.0
8.4
30.5
34.7
N/A
N/A
40.4
23.0
9.5
11.3
0.5
N/A
2016
148
105
0.17
0.14
12.6
9.6
30.6
33.8
N/A
N/A
35.2
21.9
9.2
9.8
0.5
0.1
2015
112
111
0.18
0.10
12.7
10.5
30.8
32.9
N/A
N/A
31.2
19.4
8.0
10.5
0.5
0.1
2014
157
100
0.13
0.11
12.8
9.8
30.0
31.3
N/A
N/A
40.3
25.4
9.7
11.8
0.4
0.3
2013
211
97
0.23
0.17
14.1
10.6
30.5
30.0
N/A
N/A
43.9
24.5
10.8
10.3
0.4
0.2
2012
229
101
0.30
0.26
15.9
10.1
31.6
29.9
N/A
N/A
40.2
21.5
11.6
10.5
0.4
0.1
2011
221
113
0.23
0.15
15.9
10.2
31.2
30.3
N/A
N/A
34.7
24.0
11.6
10.9
0.5
0.3
2010
211
101
0.25
0.21
15.3
10.9
29.4
30.6
N/A
N/A
28.8
23.3
7.9
11.4
0.3
0.6
2009
117
120
0.23
0.15
15.4
13.0
29.5
31.5
N/A
N/A
28.6
27.3
8.3
12.4
0.3
1.1
2008
210
131
0.25
0.26
15.2
13.2
30.1
32.0
0.017
N/A
34.6
38.8
9.7
9.4
0.6
1.1
2007
134
110
0.28
0.24
13.9
13.7
30.6
30.6
0.019
N/A
40.5
N/A
8.4
N/A
0.4
0.8
2006
241
112
0.37
0.30
14.3
14.8
30.6
30.6
0.018
N/A
55.0
N/A
11.1
N/A
0.3
1.3
2005
159
109
0.43
0.28
13.1
13.7
29.6
29.9
0.013
N/A
44.5
N/A
9.6
N/A
0.6
1.3
2004
183
130
0.38
0.29
13.5
15.5
29.2
32.5
0.020
N/A
47.3
N/A
8.2
N/A
0.4
1.6
2003
278
132
0.46
0.38
15.5
18.2
29.5
31.3
0.039
N/A
60.4
N/A
10.8
N/A
0.6
1.1
2002
203
129
0.43
0.40
16.4
17.7
30.5
28.4
0.034
N/A
53.3
N/A
11.0
N/A
0.4
1.6
2001
139
137
0.51
0.52
15.5
18.5
28.7
27.8
0.046
N/A
N/A
N/A
9.8
N/A
0.7
1.4
2000
145
140
0.67
0.52
17.8
21.2
27.8
24.5
0.072
N/A
N/A
N/A
9.1
N/A
1.0
1.9
Natural disasters
Type
El Paso
South Coast
Tornado activity compared to U.S. average
4.2%
17.1%
Earthquake activity compared to U.S. average
524.4%
6,728.5%
Natural disasters compared to U.S. average
11%
32%
Transportation
El Paso offers regular bus service and a streetcar system, but many residents rely on cars for daily transportation. Conversely, the South Coast of California has extensive public transportation options including buses, light rail systems, and ferries. Commuting times tend to be longer in the South Coast, due to heavy traffic and longer travel distances.
Transport
Type
El Paso
South Coast
Amtrak stations
1
0
Amtrak stations nearby
1
3
FAA registered aircraft
331
0
FAA registered aircraft manufacturers and dealers
6
0
Means of transportation to work
Type
El Paso
South Coast
Bicycle
0.3%
0.3%
Bus
1.3%
1%
Carpooled
11.2%
10.5%
Car alone
83.4%
79.2%
Motorcycle
0.2%
0.2%
Railroad
0%
0.4%
Walked
1.6%
1.7%
Average travel time to work
Type
El Paso
South Coast
Average
25.1 min
27.9 min
Real Estate
Real estate in El Paso is significantly cheaper than the national average, making it an affordable option for many. In the South Coast of California, the real estate market is highly competitive and prices are considerably higher. Both regions offer single-family homes, apartments, and condos, but home ownership is more accessible in El Paso given the cheaper prices.
Neighborhoods
El Paso's neighborhoods offer a mix of suburban and urban living. Notable neighborhoods include Kern Place, known for its historic homes and proximity to downtown, and Mission Hills, known for its larger mid-century homes. In contrast, neighborhoods in the South Coast of California range greatly, from beachside communities and artist colonies to urban centers and suburban sprawls.
Houses and residents
Type
El Paso
South Coast
Houses
261,779
124,031
Average household size (people)
3
2.5
Houses occupied
242,529 (92.6%)
117,093 (94.4%)
Houses occupied by owners
147,788 (60.9%)
81,601 (69.7%)
Houses occupied by renters
94,741 (39.1%)
35,492 (30.3%)
Median rent asked for vacant for-rent units
$570.82
$2,718
Median price asked for vacant for-sale houses and condos
$227,007
$1,099,558
Estimated median house or condo value
$152,800
Over $1,000,000
Median number of rooms in apartments
4.3
3.9
Median number of rooms in houses and condos
6.2
5.1
Renting percentage
39.6%
33.8%
Housing density (houses/condos per square mile)
1,051
1,227.5
Household income disparities
46.6%
38.1%
Housing units without a mortgage
1,889 (2.2%)
10,715 (16.4%)
Housing units with both a second mortgage and home equity loan
2,956 (3.4%)
248 (0.4%)
Housing units with a mortgage
84,973 (97.8%)
54,674 (83.6%)
Housing units with a home equity loan
250 (0.3%)
5,859 (9%)
Housing units with a second mortgage
3,635 (4.2%)
7,560 (11.6%)
Housing units lacking complete kitchen facilities
2%
0.8%
Housing units lacking complete plumbing facilities
Self-employed workers in own not incorporated business
19,650
17,244
State government workers
12,525
4,403
Unpaid family workers
901
640
Industries and Occupations
El Paso's local economy is driven by healthcare, education, and public sector jobs. Additionally, due to its geographical location, there's a substantial amount of trade and warehousing-related jobs. In the South Coast of California, industries are more diversified, with a significant presence in technology, entertainment, and hospitality, as well as professional services.
El Paso has quality healthcare facilities, including the University Medical Center and the El Paso Children's Hospital. Often, however, specialized treatment may require travel to larger cities. The South Coast of California is home to several world-class healthcare facilities and many specialties are available directly in the area.
Health (county statistics)
Type
El Paso
South Coast
General health status score of residents in this county from 1 (poor) to 5 (excellent)
El Paso's infrastructure supports its population well, although public transportation may be less advanced compared to larger cities. The South Coast of California has a more developed infrastructure, with several airports, extensive public transportation, and major highways supporting both local and commuter traffic. However, traffic congestion can be an issue in this region.
Infrastructure
Type
El Paso
South Coast
TV stations
10
1
Nuclear power plants nearby
0
2
Culture and Food
El Paso is a culturally rich city with a strong Mexican influence, and local food reflects this heritage with numerous Tex-Mex and authentic Mexican dining options. The South Coast of California also offers a diverse culinary scene, boasting top-quality seafood, farm-to-table eateries, vibrant food truck culture, and a myriad of global cuisines.
Sports Teams
El Paso boasts minor league baseball and soccer teams, and is also home to the UTEP Miners collegiate teams. The South Coast in California houses professional sports teams such as the Los Angeles Angels, Los Angeles Lakers, and Anaheim Ducks, providing ample opportunities for sports enthusiasts.
 El Paso, TX
 South Coast, CA