### Overview
El Paso, Texas, and Santa Ana, California, each offer unique lifestyles and environments. While El Paso brings a blend of Texan charm and a desert landscape, Santa Ana offers the attraction of a coastal city with a notable hispanic cultural influence. The comparison between these two cities goes beyond the surface, touching on aspects like crime and safety, weather, cost of living, education, work and economy, and infrastructure. Now let us dive deeper into the comparison.
### Crime/Safety
El Paso is known as one of the safest cities in the US for its size. The city has consistently had a lower crime rate than the national average, making it an attractive option for families considering relocation or tourists looking for a safe place to visit.
On the other hand, Santa Ana has a somewhat higher crime rate compared to the national average. However, the city has been making significant strides in improving safety and reducing crime rates in recent years, with many areas being considered safe for residents and tourists.
### Weather
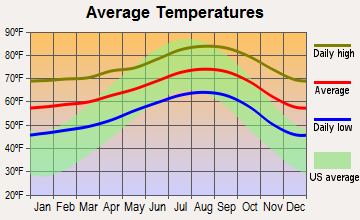
El Paso's weather is marked by its desert climate. The city enjoys over 300 sunny days a year, which makes it perfect for those who enjoy outdoor activities. The temperature can get quite high in the summer, but it is relatively mild in the winter.
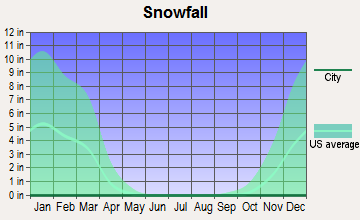
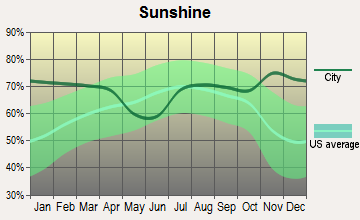
Santa Ana has a Mediterranean climate, meaning it enjoys warm, dry summers, and mild, wet winters. Average temperatures are relatively moderate and stable throughout the year, contributing to the area's appeal for people considering relocation or just visiting.
### Cost of Living
When it comes to the cost of living, El Paso is significantly cheaper than Santa Ana. Everything from housing to grocery is more affordable in this city, making it an attractive place for people looking for lower cost of living.
In contrast, the cost of living in Santa Ana, like much of California, is quite high. However, the higher cost comes with benefits like proximity to the Pacific Ocean and many Southern California attractions, which can be particularly appealing to tourists.
### Education
Both cities boast some good educational options. El Paso has a robust public school system and is home to the University of Texas at El Paso. There are also several community colleges and technical institutes, offering a diversity of educational opportunities.
Santa Ana also has a strong education system with the Santa Ana Unified School District and Santa Ana College. Furthermore, its proximity to Irvine, known for its high-ranking schools and universities, bolsters available educational options.
### Work and Economy
El Paso's economy is largely supported by industries such as trade, transportation, utilities, and government services. The city's location on the US-Mexico border significantly contributes to its economy.
Santa Ana's economy is more diversified, with industries such as healthcare, education, and manufacturing playing a significant role. Many tech companies are nearby in the Silicon valley area, providing plentiful job opportunities.
### Infrastructure
El Paso's infrastructure is consistently being upgraded, with investment in public utilities, roads, and parks. The city also has a robust water system, a crucial feature given its desert location.
In contrast, Santa Ana's infrastructure reflects its status as a developed California city, with modern roads, utilities, and a comprehensive water management system.
### Industries and Occupations
Major industries in El Paso include trade, transportation, and utilities, with a growing trend in the manufacturing sector. Many residents also work in education, health care, and food services.
In Santa Ana, many residents work in education, healthcare, and retail trade. The city also benefits from its proximity to the tech hubs in Silicon Valley for additional job opportunities.
### Biggest Employers
In El Paso, the biggest employers include the US military via Fort Bliss, the local school districts, and the University of Texas at El Paso. The border presence also ensures a significant number of federal jobs.
In Santa Ana, the largest employers include the County of Orange, Ingram Micro, and Tenet Healthcare. Nearby Irvine also offers substantial employment through numerous multinational corporations.
### Real-Estate
Home prices in El Paso are significantly lower than the national average, making homeownership achievable for many residents. Additionally, El Paso's housing market has been seeing a steady growth in recent years.
In stark contrast, the real estate market in Santa Ana is significantly pricier, reflecting average California home prices. Properties in Santa Ana, however, are known to hold their value well, with price appreciation over time.
### Neighborhoods
El Paso is home to many family-friendly neighborhoods, including the Mission Valley, Downtown, and Kern Place. Each neighborhood boasts its unique character and amenities.
In Santa Ana, historical and artsy neighborhoods like the Downtown Santa Ana and Floral Park attract residents and tourists alike with their charm and diverse range of dining and shopping options.
### Transportation/Public Transit/Commuting
El Paso has an extensive public transit system run by Sun Metro, along with bike-friendly streets and pathways. Commute times are relatively short compared to larger cities.
Santa Ana also boasts a comprehensive public transportation system, including buses and trains. Its central Orange County location makes it convenient for commuting to other parts of Southern California.
### City/State Sales Tax
El Paso has a lower sales tax rate compared to Santa Ana. The total sales tax rate in El Paso is around 8.25%, while in Santa Ana, the rate is slightly higher than 9.25%.
### City/State Income Tax
Texas does not have a state income tax, which can be a significant financial benefit for El Paso residents. Conversely, California has a progressive income tax, which can be high for higher-income earners, impacting Santa Ana residents.
### City/State Property Tax
Property taxes in El Paso are relatively high in Texas. Conversely, Santa Ana, and California in general, have lower property tax rates, but the overall cost might be high because of the state's high real estate prices.
### Culture/Food
El Paso offers a rich blend of Mexican and American cultures because of its proximity to Mexico. This is reflected in its arts, music, and festivals, and definitely in its food scene, especially the local Tex-Mex cuisine.
Santa Ana offers a mix of different cultures, with a predominant influence of Hispanic culture. The city offers a diverse food scene, with particular emphasis on Mexican cuisine, and is known for art galleries, music festivals, and cultural events.
### Sports Teams
El Paso is home to several sports teams including the El Paso Chihuahuas (minor league baseball) and El Paso Locomotive FC (soccer). The city is also known for its love of high school and college football.
Santa Ana doesn't host any major professional sports teams, but as part of the greater Los Angeles area, it’s within easy reach of numerous pro and college sports.
### Geographical Conditions
El Paso is situated in the western corner of Texas, with a desert landscape and the Franklin Mountains adding to its scenic beauty. It sits directly on the US-Mexico border along the Rio Grande.
Santa Ana is located in Southern California, experiencing pleasant weather with proximity to beautiful beaches. The Santa Ana River and several parks offer recreational opportunities.
### Health Care
El Paso has several well-ranked hospitals and a vibrant healthcare sector, in part due to the presence of the Texas Tech University Health Sciences Center El Paso.
Santa Ana is home to high-quality healthcare institutions and specialty centers. The access to excellent healthcare is further amplified by its proximity to other cities in Orange County, like Irvine, which is known for its excellent healthcare facilities.
### Summary
In summary, El Paso and Santa Ana offer contrasting yet appealing lifestyles depending on the priorities of individuals or families considering relocating. El Paso proves more affordable with a strong sense of safety, while Santa Ana bestows the perks of coastal city living and a highly diverse economy. Their distinct cultures and cuisines, influenced by their Mexican-American heritage, provide unique and flavorful experiences for residents and tourists alike. Both cities are continually investing in infrastructure, and education is highly regarded—making both cities suitable for raising families.
Distance between
El Paso, TX and
Santa Ana, CA : 678.8 miles
El Paso's population is larger by 119%. Its population has grown by 114,753 people (20.4%) since 2000. The population of Santa Ana has decreased by 28,536 people (8.4%) during that time.
City-data.com crime index counts serious crimes and violent crime more heavily. It adjusts for the number of visitors and daily workers commuting into cities. (higher means more crime, U.S. average = 301.1)
City-data.com crime index counts serious crimes and violent crime more heavily. It adjusts for the number of visitors and daily workers commuting into cities. (higher means more crime, U.S. average = 301.1)
Sex Offenders
According to our data, there are 1,253 registered sex offenders living in El Paso and 425 registered sex offenders living in . The ratio of residents to sex offenders in El Paso is 545 to 1; the ratio in Santa Ana is 786 to 1. The number of registered sex offenders compared to the number of residents is larger in El Paso than in Santa Ana.
Income
Type
El Paso
Santa Ana
Estimated median household income
$51,241
$80,265
Estimated per capita income
$25,670
$26,691
Cost of living index (U.S. average is 100)
82.2
88.6
If you make $50,000 in El Paso, you will have to make $53,893 in Santa Ana to maintain the same standard of living.
There were 1,961 building permits issued in El Paso in 2012 (1005 less than in 2011) compared to 231 building permits issued in Santa Ana in 2012 (189 more than in 2011).
In El Paso (El Paso County), 65.5% voted for Democrats and 33.2% for Republicans in 2012 Presidential Election. In Santa Ana (Orange County), 45.8% voted for Democrats and 52.0% for Republicans.
Elections
Type
Democrats
Republicans
Other
Year
El Paso
Santa Ana
El Paso
Santa Ana
El Paso
Santa Ana
2020
66.8%
53.6%
31.6%
44.6%
1.6%
1.8%
2016
69.1%
50.9%
26.0%
42.4%
4.9%
6.7%
2012
65.5%
45.8%
33.2%
52.0%
1.3%
2.3%
2008
66.0%
47.8%
33.4%
50.3%
0.6%
1.9%
2004
56.2%
39.3%
43.3%
60.2%
0.5%
0.5%
2000
57.9%
40.4%
39.8%
55.9%
2.3%
3.7%
1996
62.3%
37.9%
32.1%
51.7%
5.6%
10.5%
Breakdown of population affiliated with a religious congregation
Type
Adherents
Congregations
Religion
El Paso
Santa Ana
El Paso
Santa Ana
CATHOLIC CHURCH
43.2%
26.5%
11.3%
4.4%
SOUTHERN BAPTIST CONVENTION
3.3%
2.3%
26.6%
8.8%
SEVENTH DAY ADVENTIST CHURCH
0.3%
0.4%
1.6%
1.3%
LUTHERAN CHURCH
0.2%
0.6%
1.0%
2.0%
EPISCOPAL CHURCH
0.1%
0.4%
1.0%
1.4%
EVANGELICAL LUTHERAN CHURCH IN AMERICA
0.1%
0.4%
1.0%
2.3%
MUSLIM ESTIMATE
0.1%
0.8%
0.2%
1.3%
REFORMED CHURCH IN AMERICA
0.0%
0.3%
0.0%
0.2%
Weather and climate
Type
El Paso
Santa Ana
Temperature - Average
64.6°F
65.4°F
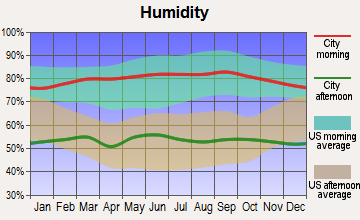
Humidity - Average morning or afternoon humidity
42.7%
69.9%
Humidity - Differences between morning and afternoon humidity
42.8%
26.2%
Humidity - Maximum monthly morning or afternoon humidity
59.8%
78.3%
Humidity - Minimum monthly morning or afternoon humidity
17%
52%
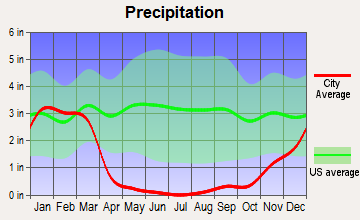
Precipitation - Yearly average
9.4 in
13.8 in
Snowfall - Yearly average
10.7 in
0 in
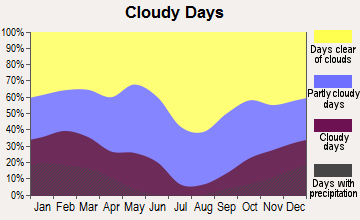
Clouds - Number of days clear of clouds
31.8%
26.5%
Sunshine amount - Average
89.4%
78.4%
Sunshine amount - Differences during a year
13.9%
21.9%
Sunshine amount - Maximum monthly
89.3%
84.8%
Sunshine amount - Minimum monthly
75.4%
62.9%
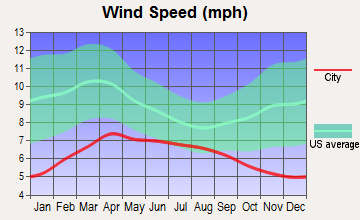
Wind speed - Average
8.9 mph
5.9 mph
Average climate in El Paso, Texas
Average climate in Santa Ana, California
Air pollution
Type
AQI
CO
NO2
OZONE
PB
PM10
PM25
SO2
Year
El Paso
Santa Ana
El Paso
Santa Ana
El Paso
Santa Ana
El Paso
Santa Ana
El Paso
Santa Ana
El Paso
Santa Ana
El Paso
Santa Ana
El Paso
Santa Ana
2018
139
124
0.17
0.34
14.0
14.2
32.0
27.0
N/A
N/A
35.7
27.5
9.2
12.3
N/A
0.7
2017
173
129
0.19
0.35
13.0
13.9
30.5
29.1
N/A
N/A
40.4
26.7
9.5
13.6
0.5
0.5
2016
148
107
0.17
0.35
12.6
12.6
30.6
29.2
N/A
N/A
35.2
24.1
9.2
12.7
0.5
0.2
2015
112
128
0.18
0.32
12.7
13.4
30.8
29.6
N/A
N/A
31.2
25.0
8.0
14.7
0.5
0.2
2014
157
127
0.13
0.29
12.8
13.2
30.0
28.6
N/A
N/A
40.3
26.7
9.7
15.9
0.4
0.4
2013
211
123
0.23
0.34
14.1
13.9
30.5
27.6
N/A
0.003
43.9
28.8
10.8
14.0
0.4
0.3
2012
229
115
0.30
0.31
15.9
12.9
31.6
26.7
N/A
0.004
40.2
27.5
11.6
14.5
0.4
0.1
2011
221
118
0.23
0.31
15.9
14.8
31.2
27.1
N/A
0.006
34.7
27.5
11.6
15.9
0.5
0.7
2010
211
107
0.25
0.34
15.3
14.4
29.4
26.5
N/A
0.011
28.8
23.5
7.9
14.6
0.3
0.6
2009
117
133
0.23
0.35
15.4
16.0
29.5
27.7
N/A
0.010
28.6
24.4
8.3
14.9
0.3
1.1
2008
210
138
0.25
0.38
15.2
17.1
30.1
28.2
0.017
0.010
34.6
30.1
9.7
21.6
0.6
1.1
2007
134
121
0.28
0.36
13.9
17.0
30.6
27.1
0.019
0.012
40.5
N/A
8.4
N/A
0.4
0.8
2006
241
120
0.37
0.40
14.3
17.7
30.6
26.6
0.018
0.007
55.0
N/A
11.1
N/A
0.3
1.3
2005
159
119
0.43
0.40
13.1
18.2
29.6
28.3
0.013
0.013
44.5
N/A
9.6
N/A
0.6
1.3
2004
183
128
0.38
0.50
13.5
19.4
29.2
31.2
0.020
0.014
47.3
N/A
8.2
N/A
0.4
1.6
2003
278
139
0.46
0.64
15.5
22.3
29.5
28.3
0.039
0.029
60.4
N/A
10.8
N/A
0.6
1.1
2002
203
122
0.43
0.66
16.4
22.3
30.5
25.1
0.034
0.019
53.3
N/A
11.0
N/A
0.4
1.7
2001
139
120
0.51
0.76
15.5
22.6
28.7
25.1
0.046
0.036
N/A
N/A
9.8
N/A
0.7
1.5
2000
145
127
0.67
0.80
17.8
25.7
27.8
23.7
0.072
0.028
N/A
N/A
9.1
N/A
1.0
1.9
Natural disasters
Type
El Paso
Santa Ana
Tornado activity compared to U.S. average
4.2%
19.1%
Earthquake activity compared to U.S. average
524.4%
6,931.4%
Natural disasters compared to U.S. average
11%
32%
Transport
Type
El Paso
Santa Ana
Amtrak stations
1
1
Amtrak stations nearby
1
3
FAA registered aircraft
331
150
FAA registered aircraft manufacturers and dealers
6
15
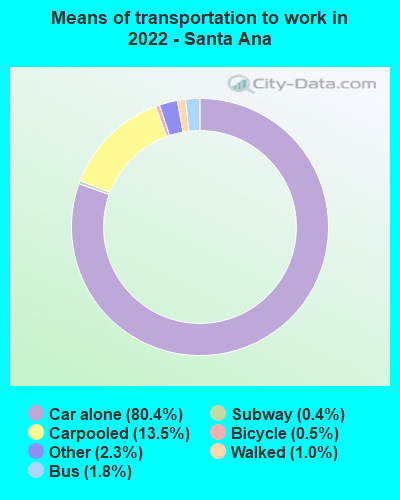
Means of transportation to work
Type
El Paso
Santa Ana
Bicycle
0.3%
0.2%
Bus
1.3%
0.9%
Carpooled
11.2%
12%
Car alone
83.4%
83.6%
Motorcycle
0.2%
0.1%
Walked
1.6%
1.4%
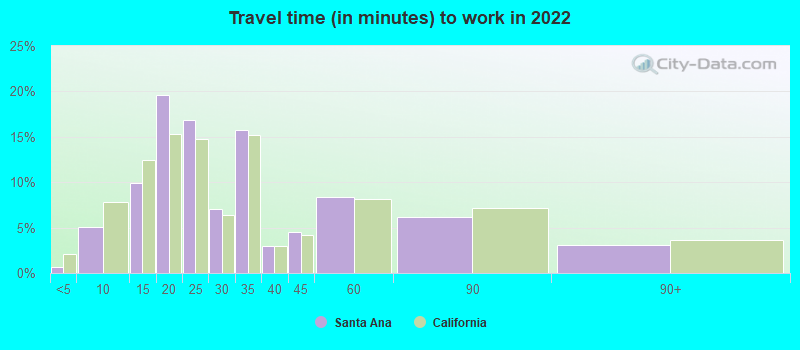
Average travel time to work
Type
El Paso
Santa Ana
Average
25.1 min
30.4 min
Other means
22.2 min
25.5 min
Public transportation
46.4 min
48.1 min
Private vehicle occupancy
Type
El Paso
Santa Ana
Average
1.2
1.2
Drove alone
88.5%
84.6%
In 2 person carpool
7.9%
11.7%
In 3 person carpool
2.1%
2.7%
In 4 person carpool
0.7%
0.6%
In 5-6 person carpool
0.7%
0.4%
How many people usually rode to work in the car, truck or van.
Houses and residents
Type
El Paso
Santa Ana
Houses
261,779
80,604
Average household size (people)
3
4.4
Median year apartment built
1982
1974
Median year house/condo built
1985
1962
Length of stay in the house since moving in
14.7 years
15.9 years
Houses occupied
242,529 (92.6%)
78,674 (97.6%)
Houses occupied by owners
147,788 (60.9%)
35,317 (44.9%)
Houses occupied by renters
94,741 (39.1%)
43,357 (55.1%)
Median rent asked for vacant for-rent units
$570.82
$1,407
Median monthly housing costs
$939
$1,836
Median price asked for vacant for-sale houses and condos
$227,007
$976,981
Estimated median house or condo value
$152,800
$623,000
Median numbers of rooms
5.4
4.5
Median number of rooms in apartments
4.3
3.9
Median number of rooms in houses and condos
6.2
5.6
Median house price - detached houses
$187,761
$724,856
Median house price - in 2-unit structures
Over $1,000,000
$512,474
Median house price - in 3-to-4-unit structures
$75,782
$351,406
Median house price - in 5 or more unit structures
$266,003
$406,926
Median house price - mobile homes
$43,095
$125,004
Median house price - Townhouses or other attached units
$149,459
$492,339
Median house price - All housing units
$186,951
$648,392
Median house age
38
53
Renting percentage
39.6%
52.5%
Housing density (houses/condos per square mile)
1,051
2,969.6
House value disparities
32.7%
21.7%
Household income disparities
46.6%
40.4%
Median household income for houses/condes with a mortgage
$74,665
$120,617
Median household income for apartments without a mortgage
$52,954
$74,449
Housing units without a mortgage
1,889 (2.2%)
318 (1.2%)
Housing units with both a second mortgage and home equity loan
2,956 (3.4%)
1,175 (4.6%)
Housing units with a mortgage
84,973 (97.8%)
25,378 (98.8%)
Housing units with a home equity loan
250 (0.3%)
23 (0.1%)
Housing units with a second mortgage
3,635 (4.2%)
1,438 (5.6%)
House/condo owner moved in on average (years ago)
14
14
House/condo renter moved in on average (years ago)
1
5
Housing units lacking complete kitchen facilities
2%
3.3%
Housing units in structures
Housing units in structures
El Paso
Santa Ana
One, detached
67.7%
46.4%
One, attached
4.4%
5.8%
Two
2.4%
3.6%
3 or 4
4.1%
7.3%
5 to 9
5.9%
5.7%
10 to 19
5.8%
8.8%
20 to 49
2.4%
6.3%
50 or more
4.8%
11.0%
Mobile homes
2.3%
4.9%
Boats, RVs, vans, etc.
0.2%
0.0%
Median real estate property taxes paid for housing units


 El Paso, TX
 Santa Ana, CA