El Paso, Texas, and New Orleans, Louisiana, are two vibrant cities with distinct personalities and qualities. With both offering unique cultural experiences, varying economic prospects, diverse educational opportunities, and differing living costs, the choice between these two cities depends on individual preferences and lifestyle needs. This comparative analysis delves into various aspects of both cities, giving potential relocators or tourists a comprehensive view of what to anticipate in each city, following the below-listed criteria.
Distance between
El Paso, TX and
New Orleans, LA : 977.5 miles
El Paso's population is larger by 80%. Its population has grown by 114,753 people (20.4%) since 2000. The population of New Orleans has decreased by 107,703 people (22.2%) during that time.
El Paso enjoys a reputation for being one of the safest cities in the U.S., a fact supported by lower crime rates compared to national averages. New Orleans, on the other hand, grapples with higher crime rates, especially in violent and property crimes. Both cities offer diverse neighborhoods, with varying levels of safety; research into these is advisable for both potential residents and tourists alike.
City-data.com crime index counts serious crimes and violent crime more heavily. It adjusts for the number of visitors and daily workers commuting into cities. (higher means more crime, U.S. average = 301.1)
City-data.com crime index counts serious crimes and violent crime more heavily. It adjusts for the number of visitors and daily workers commuting into cities. (higher means more crime, U.S. average = 301.1)
Sex Offenders
According to our data, there are 1,253 registered sex offenders living in El Paso and 811 registered sex offenders living in . The ratio of residents to sex offenders in El Paso is 545 to 1; the ratio in New Orleans is 483 to 1. The number of registered sex offenders compared to the number of residents in El Paso is near to than in New Orleans.
Cost of Living
The cost of living is generally lower in El Paso, characterized by affordable housing, grocery, and transportation cost. By comparison, New Orleans has a higher cost of living, predominantly driven by housing costs, even though it's still lower than many other major U.S. cities.
Income Tax
In terms of income tax, Texas, including El Paso, has no state income tax. On the other hand, Louisiana levies a state income tax, making the overall tax burden potentially higher for residents of New Orleans.
Property Tax
Property taxes in El Paso are higher than the national average, largely driven by educational funding. New Orleans also has noticeable property taxes, but these are generally lower than in El Paso due to lower housing prices.
Sales Tax
Texas has a higher state sales tax rate than Louisiana where El Paso and New Orleans are located, respectively. However, New Orleans has additional local sales taxes which result in a higher combined rate in comparison to El Paso.
Income
Type
El Paso
New Orleans
Estimated median household income
$51,241
$46,942
Estimated per capita income
$25,670
$35,587
Cost of living index (U.S. average is 100)
82.2
97.9
If you make $50,000 in El Paso, you will have to make $59,550 in New Orleans to maintain the same standard of living.
Geographical Conditions
El Paso is in the Chihuahuan Desert with mountain views and sunny weather most days. New Orleans, located along the Mississippi River, is known for its swamps, marshes, and relatively flat landscape.
Both cities offer a multitude of public and private school options for families. New Orleans is home to Tulane University and Loyola University, while El Paso houses the University of Texas at El Paso. Overall, the educational opportunities in both cities are quite diverse and robust, with various programs geared towards different career paths.
El Paso's economy is primarily driven by military, government jobs, health care, and education. New Orleans is fueled by industries like tourism, port operations, healthcare, and oil refining. Unemployment rates generally tend to be lower in El Paso than in New Orleans.
Biggest Employers
In El Paso, some of the biggest employers include Fort Bliss, University Medical Center of El Paso, and the El Paso Independent School District. For New Orleans, major employers include Ochsner Health System, Tulane University, and the Naval Air Station Joint Reserve Base New Orleans.
There were 1,961 building permits issued in El Paso in 2012 (1005 less than in 2011) compared to 716 building permits issued in New Orleans in 2012 (1 less than in 2011).
In El Paso (El Paso County), 65.5% voted for Democrats and 33.2% for Republicans in 2012 Presidential Election. In New Orleans (Orleans Parish), 80.5% voted for Democrats and 17.8% for Republicans.
Elections
Type
Democrats
Republicans
Other
Year
El Paso
New Orleans
El Paso
New Orleans
El Paso
New Orleans
2020
66.8%
83.6%
31.6%
15.1%
1.6%
1.3%
2016
69.1%
81.1%
26.0%
14.7%
4.9%
4.2%
2012
65.5%
80.5%
33.2%
17.8%
1.3%
1.7%
2008
66.0%
79.6%
33.4%
19.1%
0.6%
1.3%
2004
56.2%
77.8%
43.3%
21.8%
0.5%
0.4%
2000
57.9%
76.2%
39.8%
21.8%
2.3%
2.0%
1996
62.3%
90.7%
32.1%
8.2%
5.6%
1.2%
Breakdown of population affiliated with a religious congregation
Type
Adherents
Congregations
Religion
El Paso
New Orleans
El Paso
New Orleans
CATHOLIC CHURCH
43.2%
30.9%
11.3%
16.0%
SOUTHERN BAPTIST CONVENTION
3.3%
4.3%
26.6%
13.0%
SEVENTH DAY ADVENTIST CHURCH
0.3%
1.1%
1.6%
1.8%
LUTHERAN CHURCH
0.2%
0.5%
1.0%
3.9%
EPISCOPAL CHURCH
0.1%
1.5%
1.0%
4.2%
MUSLIM ESTIMATE
0.1%
0.5%
0.2%
1.8%
Weather
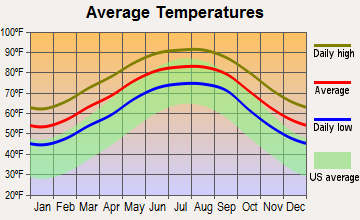
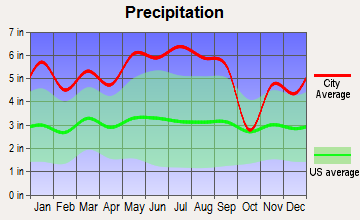
El Paso has a desert climate, with very hot summers and mild winters. On the opposite end of the spectrum, New Orleans has a humid subtropical climate with long, hot and humid summers and short, mild winters. Rainfall is also significantly higher in New Orleans compared to El Paso, with the former being prone to hurricanes.
Weather and climate
Type
El Paso
New Orleans
Temperature - Average
64.6°F
69.6°F
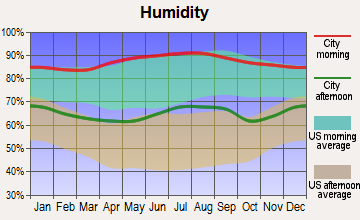
Humidity - Average morning or afternoon humidity
42.7%
80.8%
Humidity - Differences between morning and afternoon humidity
42.8%
32%
Humidity - Maximum monthly morning or afternoon humidity
59.8%
91%
Humidity - Minimum monthly morning or afternoon humidity
17%
59%
Precipitation - Yearly average
9.4 in
62.2 in
Snowfall - Yearly average
10.7 in
0.2 in
Clouds - Number of days clear of clouds
31.8%
16.9%
Sunshine amount - Average
89.4%
63.7%
Sunshine amount - Differences during a year
13.9%
22%
Sunshine amount - Maximum monthly
89.3%
70%
Sunshine amount - Minimum monthly
75.4%
48%
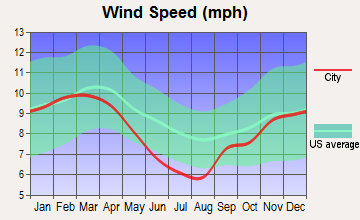
Wind speed - Average
8.9 mph
8.7 mph
Average climate in El Paso, Texas
Average climate in New Orleans, Louisiana
Air pollution
Type
AQI
CO
NO2
OZONE
PB
PM10
PM25
SO2
Year
El Paso
New Orleans
El Paso
New Orleans
El Paso
New Orleans
El Paso
New Orleans
El Paso
El Paso
New Orleans
El Paso
New Orleans
El Paso
New Orleans
2018
139
75
0.17
N/A
14.0
5.5
32.0
27.9
N/A
N/A
35.7
19.6
9.2
9.5
N/A
1.1
2017
173
73
0.19
N/A
13.0
6.0
30.5
27.6
N/A
N/A
40.4
18.8
9.5
9.5
0.5
1.6
2016
148
71
0.17
N/A
12.6
6.7
30.6
29.1
N/A
N/A
35.2
16.5
9.2
9.4
0.5
1.7
2015
112
76
0.18
N/A
12.7
6.3
30.8
26.5
N/A
N/A
31.2
17.5
8.0
8.8
0.5
1.3
2014
157
79
0.13
N/A
12.8
6.7
30.0
25.6
N/A
N/A
40.3
17.7
9.7
7.7
0.4
2.0
2013
211
73
0.23
N/A
14.1
6.5
30.5
25.8
N/A
N/A
43.9
17.8
10.8
7.4
0.4
2.6
2012
229
84
0.30
N/A
15.9
7.8
31.6
26.8
N/A
N/A
40.2
24.0
11.6
10.0
0.4
2.5
2011
221
93
0.23
N/A
15.9
7.8
31.2
27.0
N/A
N/A
34.7
24.9
11.6
8.8
0.5
2.1
2010
211
89
0.25
N/A
15.3
7.8
29.4
27.5
N/A
N/A
28.8
26.7
7.9
9.5
0.3
2.9
2009
117
81
0.23
N/A
15.4
7.6
29.5
26.5
N/A
N/A
28.6
N/A
8.3
9.1
0.3
2.8
2008
210
81
0.25
N/A
15.2
9.3
30.1
27.3
0.017
N/A
34.6
N/A
9.7
10.0
0.6
3.0
2007
134
97
0.28
N/A
13.9
9.1
30.6
28.4
0.019
N/A
40.5
N/A
8.4
10.2
0.4
3.6
2006
241
93
0.37
N/A
14.3
9.7
30.6
28.7
0.018
N/A
55.0
N/A
11.1
11.2
0.3
N/A
2005
159
93
0.43
0.58
13.1
9.0
29.6
24.7
0.013
N/A
44.5
N/A
9.6
10.6
0.6
N/A
2004
183
96
0.38
0.68
13.5
9.5
29.2
21.3
0.020
N/A
47.3
N/A
8.2
10.3
0.4
N/A
2003
278
91
0.46
0.84
15.5
9.9
29.5
19.5
0.039
N/A
60.4
N/A
10.8
11.5
0.6
N/A
2002
203
68
0.43
0.61
16.4
9.3
30.5
20.2
0.034
N/A
53.3
N/A
11.0
N/A
0.4
N/A
2001
139
88
0.51
0.81
15.5
10.2
28.7
20.6
0.046
N/A
N/A
N/A
9.8
N/A
0.7
N/A
2000
145
105
0.67
0.55
17.8
11.3
27.8
24.5
0.072
N/A
N/A
N/A
9.1
N/A
1.0
N/A
Natural disasters
Type
El Paso
New Orleans
Tornado activity compared to U.S. average
4.2%
125.4%
Earthquake activity compared to U.S. average
524.4%
44.4%
Natural disasters compared to U.S. average
11%
21%
Transportation
El Paso offers various modes of public transport, including buses, bicycles, and a streetcar system. New Orleans also has a well-established public transit network, including streetcars, buses, and ferries. Both cities experience average levels of traffic, with commute times typically comparable to the national average.
Transport
Type
El Paso
New Orleans
Amtrak stations
1
1
Amtrak stations nearby
1
1
FAA registered aircraft
331
201
FAA registered aircraft manufacturers and dealers
6
2
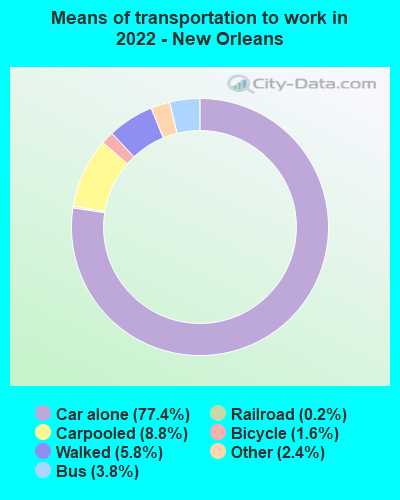
Means of transportation to work
Type
El Paso
New Orleans
Bicycle
0.3%
1.4%
Bus
1.3%
3.3%
Carpooled
11.2%
9%
Car alone
83.4%
79.9%
Ferryboat
0%
0.1%
Motorcycle
0.2%
0.1%
Railroad
0%
0.2%
Taxicab
0.1%
0.5%
Walked
1.6%
3.6%
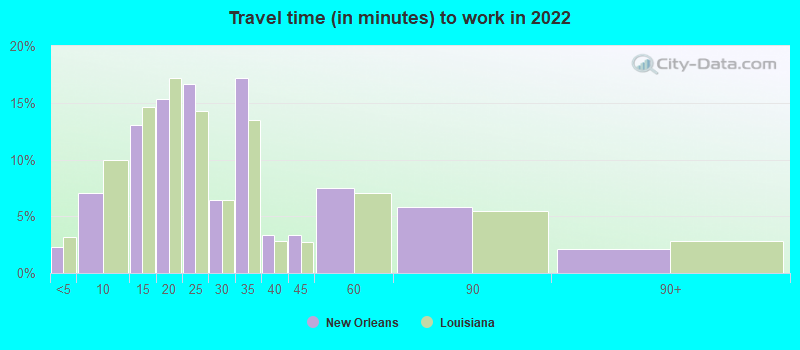
Average travel time to work
Type
El Paso
New Orleans
Average
25.1 min
27.7 min
Other means
22.2 min
23.4 min
Public transportation
46.4 min
42.3 min
Private vehicle occupancy
Type
El Paso
New Orleans
Average
1.2
1.2
Drove alone
88.5%
89.9%
In 2 person carpool
7.9%
8.2%
In 3 person carpool
2.1%
0.8%
In 4 person carpool
0.7%
0.4%
In 5-6 person carpool
0.7%
0.1%
In 7+ person carpool
0.1%
0.6%
How many people usually rode to work in the car, truck or van.
Real Estate
El Paso's real estate market is comparatively more affordable than New Orleans, making it easier for potential homeowners or property investors. New Orleans' real estate market is slightly more expensive due to higher demand, especially in desired historic and cultural neighborhoods.
Neighborhoods
Both cities boast a variety of different neighborhoods that cater to different lifestyles. El Paso has famously safe neighborhoods like Ridgecrest and Willow Bend. In contrast, New Orleans offers historic neighborhoods like the French Quarter and Garden District that are popular for their culture and architecture.
Houses and residents
Type
El Paso
New Orleans
Houses
261,779
194,701
Average household size (people)
3
2.3
Median year apartment built
1982
1966
Median year house/condo built
1985
1960
Length of stay in the house since moving in
14.7 years
15.5 years
Houses occupied
242,529 (92.6%)
158,827 (81.6%)
Houses occupied by owners
147,788 (60.9%)
83,516 (52.6%)
Houses occupied by renters
94,741 (39.1%)
75,311 (47.4%)
Median rent asked for vacant for-rent units
$570.82
$1,126
Median monthly housing costs
$939
$1,106
Median price asked for vacant for-sale houses and condos
$227,007
$470,732
Estimated median house or condo value
$152,800
$279,100
Median numbers of rooms
5.4
5.2
Median number of rooms in apartments
4.3
4.4
Median number of rooms in houses and condos
6.2
6.3
Median house price - detached houses
$187,761
$360,278
Median house price - in 2-unit structures
Over $1,000,000
$499,015
Median house price - in 3-to-4-unit structures
$75,782
$347,348
Median house price - in 5 or more unit structures
$266,003
$400,453
Median house price - mobile homes
$43,095
$25,502
Median house price - Townhouses or other attached units
$149,459
$365,362
Median house price - All housing units
$186,951
$369,282
Median house age
38
61
Renting percentage
39.6%
52.2%
Housing density (houses/condos per square mile)
1,051
1,078.3
House value disparities
32.7%
38.2%
Household income disparities
46.6%
53.1%
Median household income for houses/condes with a mortgage
$74,665
$89,566
Median household income for apartments without a mortgage
$52,954
$53,790
Housing units without a mortgage
1,889 (2.2%)
629 (1.3%)
Housing units with both a second mortgage and home equity loan
2,956 (3.4%)
3,326 (6.9%)
Housing units with a mortgage
84,973 (97.8%)
47,733 (98.7%)
Housing units with a home equity loan
250 (0.3%)
296 (0.6%)
Housing units with a second mortgage
3,635 (4.2%)
4,588 (9.5%)
House/condo owner moved in on average (years ago)
14
14
House/condo renter moved in on average (years ago)
1
3
Housing units lacking complete kitchen facilities
2%
5.6%
Housing units lacking complete plumbing facilities
2%
4.6%
Housing units in structures
Housing units in structures
El Paso
New Orleans
One, detached
67.7%
48.0%
One, attached
4.4%
9.7%
Two
2.4%
15.1%
3 or 4
4.1%
6.9%
5 to 9
5.9%
4.1%
10 to 19
5.8%
3.8%
20 to 49
2.4%
3.9%
50 or more
4.8%
8.1%
Mobile homes
2.3%
0.4%
Boats, RVs, vans, etc.
0.2%
0.0%
Median real estate property taxes paid for housing units
Self-employed workers in own not incorporated business
19,650
9,492
State government workers
12,525
9,130
Unpaid family workers
901
527
Industries and Occupations
El Paso's economy is large in education, healthcare, and military sectors whereas, in New Orleans, the key industries are tourism, healthcare, oil and gas, and maritime. Therefore, job seekers in these industries may find ample job opportunities.
Both El Paso and New Orleans offer a mix of public and private health care options. El Paso has several well-regarded hospitals, led by the University Medical Center of El Paso. New Orleans houses world-class healthcare facilities such as Ochsner Medical Center and Tulane Medical Center.
Health (county statistics)
Type
El Paso
New Orleans
General health status score of residents in this county from 1 (poor) to 5 (excellent)
El Paso's infrastructure includes a well-developed transport network, with an international airport, Amtrak station, and highway system. New Orleans, on the other hand, has a strong focus on water-based infrastructure, with one of the largest and busiest ports in the world, alongside an international airport and a streetcar system.
HMDA - Conventional home purchase loans - Applications denied
Year
El Paso
New Orleans
1999
1,994
1,021
2000
993
942
2001
704
820
2002
594
820
2003
1,268
991
2004
1,646
1,379
2005
2,316
1,899
2006
2,701
1,426
2007
2,051
1,245
2008
1,034
683
2009
454
378
Culture and Food
Both cities are popular for their rich cultural histories and food scenes. El Paso offers a blend of Mexican and Texan culture, with notable cuisine such as Tex-Mex. New Orleans is famous for its unique blend of French, African, and American cultures, known worldwide for its Creole and Cajun cuisines.
Sports Teams
Both El Paso and New Orleans have active sports scenes. El Paso hosts minor league baseball and soccer teams, and college-level sports. New Orleans is home to two major professional sports teams, the New Orleans Saints (NFL) and the New Orleans Pelicans (NBA).


 El Paso, TX
 New Orleans, LA