El Paso, Texas and Chandler, Arizona, are two vibrant American cities with unique characteristics. El Paso is known for its friendly community and rich culture, heavily influenced by its Mexican heritage. Chandler, on the other hand, combines modern sophistication with desert tranquility and boasts a thriving tech industry. Whether moving or just visiting, your choice would depend on your personal preferences and way of life.
Distance between
El Paso, TX and
Chandler, AZ : 333.5 miles
El Paso's population is larger by 143%. Its population has grown by 114,753 people (20.4%) since 2000. The population of Chandler has grown by 102,877 people (58.3%) during that time.
As with any city, crime rates vary in both El Paso and Chandler. El Paso has been consistently ranked as one of the safest large cities in the US, offering a secure environment for relocation or visitation. Chandler is also considered a safe city, with a crime rate lower than the national average. Both cities invest heavily in local law enforcement to enhance public safety.
City-data.com crime index counts serious crimes and violent crime more heavily. It adjusts for the number of visitors and daily workers commuting into cities. (higher means more crime, U.S. average = 301.1)
City-data.com crime index counts serious crimes and violent crime more heavily. It adjusts for the number of visitors and daily workers commuting into cities. (higher means more crime, U.S. average = 301.1)
Sex Offenders
According to our data, there are 1,253 registered sex offenders living in El Paso and 103 registered sex offenders living in . The ratio of residents to sex offenders in El Paso is 545 to 1; the ratio in Chandler is 2,403 to 1. The number of registered sex offenders compared to the number of residents is much larger in El Paso than that in Chandler.
Cost of Living
In terms of cost of living, El Paso is generally less expensive, with a lower median home price and overall cost of living compared to Chandler. However, Chandler's higher cost of living is balanced with higher median household incomes.
Income Tax
As for income tax, Texas, including El Paso, does not impose a state income tax. Arizona has a graduated income tax, and therefore residents of Chandler will incur state income tax.
Property Tax
Property taxes are another factor to consider. El Paso has a higher property tax rate than Chandler. However, since the median home prices in El Paso are lower, this might not translate to higher overall tax payments.
Sales Tax
Sales tax rates differ too. El Paso has a combined city and state sales tax rate of 8.25%, while Chandler has a slightly higher combined city and state sales tax rate of 8.6%.
Income
Type
El Paso
Chandler
Estimated median household income
$51,241
$94,613
Estimated per capita income
$25,670
$46,965
Cost of living index (U.S. average is 100)
82.2
101.2
If you make $50,000 in El Paso, you will have to make $61,557 in Chandler to maintain the same standard of living.
Geographical Conditions
El Paso is in the mountainous region of West Texas, providing spectacular vistas and plenty of opportunities for hiking and biking. Chandler, part of the Greater Phoenix region, is set in the Sonoran Desert and features sunny weather, flat terrain, and unique desert landscapes.
Both cities value education. El Paso is home to several highly regarded school districts and the University of Texas at El Paso. Chandler's schools are renowned for their quality, being served by the highly rated Chandler Unified School District and has proximity to institutions like Arizona State University.
El Paso's economy is primarily driven by military, education, government services, and healthcare sectors. Meanwhile, Chandler's economy is heavily tech-centered, hosting many telecom and IT companies like Intel and Verizon. Both cities have steady job growth, albeit in different sectors.
Biggest Employers
Some of the biggest employers in El Paso are Fort Bliss, the independent school districts, the University Medical Center of El Paso, and Texas Tech University Health Sciences Center. In Chandler, the largest employers are Intel, Wells Fargo, Bank of America, and Chandler School District.
There were 1,961 building permits issued in El Paso in 2012 (1005 less than in 2011) compared to 670 building permits issued in Chandler in 2012 (5 more than in 2011).
In El Paso (El Paso County), 65.5% voted for Democrats and 33.2% for Republicans in 2012 Presidential Election. In Chandler (Maricopa County), 43.6% voted for Democrats and 54.3% for Republicans.
Elections
Type
Democrats
Republicans
Other
Year
El Paso
Chandler
El Paso
Chandler
El Paso
Chandler
2020
66.8%
50.2%
31.6%
48.0%
1.6%
1.8%
2016
69.1%
44.9%
26.0%
47.7%
4.9%
7.5%
2012
65.5%
43.6%
33.2%
54.3%
1.3%
2.1%
2008
66.0%
44.0%
33.4%
54.5%
0.6%
1.5%
2004
56.2%
42.4%
43.3%
57.0%
0.5%
0.6%
2000
57.9%
43.0%
39.8%
53.4%
2.3%
3.6%
1996
62.3%
44.5%
32.1%
47.2%
5.6%
8.2%
Breakdown of population affiliated with a religious congregation
Type
Adherents
Congregations
Religion
El Paso
Chandler
El Paso
Chandler
CATHOLIC CHURCH
43.2%
13.6%
11.3%
4.3%
SOUTHERN BAPTIST CONVENTION
3.3%
1.9%
26.6%
6.5%
SEVENTH DAY ADVENTIST CHURCH
0.3%
0.4%
1.6%
2.0%
LUTHERAN CHURCH
0.2%
0.5%
1.0%
1.5%
EPISCOPAL CHURCH
0.1%
0.3%
1.0%
1.3%
EVANGELICAL LUTHERAN CHURCH IN AMERICA
0.1%
0.8%
1.0%
2.0%
VINEYARD USA
0.1%
0.3%
0.6%
0.6%
Weather
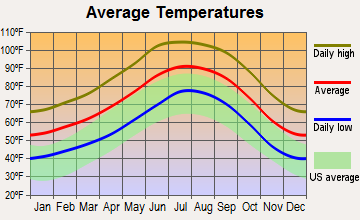
Weather can be a deciding factor for many. El Paso has a hot desert climate with extremely hot summers and cooler winters, while Chandler experiences a hotter, more humid climate due to its location in the Sonoran Desert. Both cities boast more than 300 sunny days a year, making them ideal for those who revel in warm weather and outdoor activities.
Weather and climate
Type
El Paso
Chandler
Temperature - Average
64.6°F
71.8°F
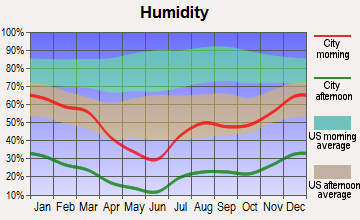
Humidity - Average morning or afternoon humidity
42.7%
37.5%
Humidity - Differences between morning and afternoon humidity
42.8%
48%
Humidity - Maximum monthly morning or afternoon humidity
59.8%
60%
Humidity - Minimum monthly morning or afternoon humidity
17%
12%
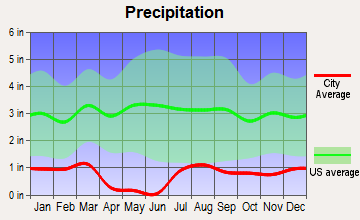
Precipitation - Yearly average
9.4 in
9.1 in
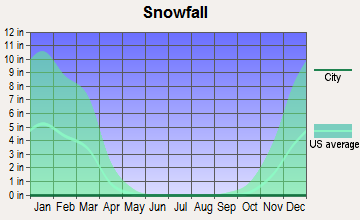
Snowfall - Yearly average
10.7 in
0 in
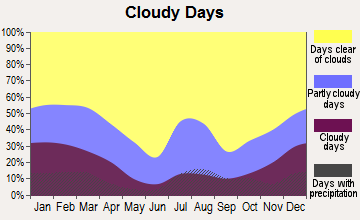
Clouds - Number of days clear of clouds
31.8%
35.3%
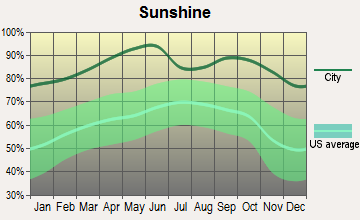
Sunshine amount - Average
89.4%
92.8%
Sunshine amount - Differences during a year
13.9%
16%
Sunshine amount - Maximum monthly
89.3%
95%
Sunshine amount - Minimum monthly
75.4%
79%
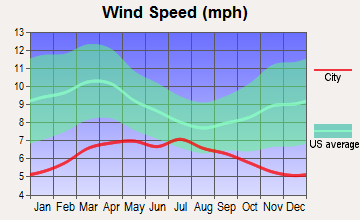
Wind speed - Average
8.9 mph
6.6 mph
Average climate in El Paso, Texas
Average climate in Chandler, Arizona
Air pollution
Type
AQI
CO
NO2
OZONE
PB
PM10
PM25
SO2
Year
El Paso
Chandler
El Paso
Chandler
El Paso
Chandler
El Paso
Chandler
El Paso
El Paso
Chandler
El Paso
Chandler
El Paso
Chandler
2018
139
206
0.17
0.29
14.0
15.2
32.0
30.6
N/A
N/A
35.7
35.5
9.2
7.7
N/A
0.6
2017
173
132
0.19
0.36
13.0
15.9
30.5
31.2
N/A
N/A
40.4
34.0
9.5
7.8
0.5
1.4
2016
148
125
0.17
0.34
12.6
15.8
30.6
30.2
N/A
N/A
35.2
30.2
9.2
7.1
0.5
0.4
2015
112
173
0.18
0.39
12.7
17.8
30.8
29.2
N/A
N/A
31.2
24.2
8.0
7.3
0.5
0.9
2014
157
231
0.13
0.44
12.8
19.9
30.0
27.8
N/A
N/A
40.3
29.8
9.7
8.6
0.4
1.1
2013
211
148
0.23
0.32
14.1
20.1
30.5
29.8
N/A
N/A
43.9
28.9
10.8
7.5
0.4
0.9
2012
229
165
0.30
0.36
15.9
21.5
31.6
29.3
N/A
N/A
40.2
36.8
11.6
8.8
0.4
1.3
2011
221
205
0.23
0.32
15.9
19.1
31.2
30.1
N/A
N/A
34.7
40.4
11.6
9.5
0.5
0.9
2010
211
100
0.25
0.42
15.3
17.4
29.4
29.8
N/A
N/A
28.8
23.8
7.9
8.3
0.3
1.2
2009
117
109
0.23
0.40
15.4
17.6
29.5
29.8
N/A
N/A
28.6
36.1
8.3
N/A
0.3
1.1
2008
210
107
0.25
0.36
15.2
18.6
30.1
29.6
0.017
N/A
34.6
40.2
9.7
N/A
0.6
1.3
2007
134
135
0.28
0.38
13.9
20.6
30.6
28.5
0.019
N/A
40.5
50.2
8.4
N/A
0.4
1.9
2006
241
138
0.37
0.46
14.3
23.1
30.6
29.5
0.018
N/A
55.0
56.3
11.1
N/A
0.3
1.9
2005
159
109
0.43
0.56
13.1
23.6
29.6
26.6
0.013
N/A
44.5
48.7
9.6
N/A
0.6
1.8
2004
183
97
0.38
0.56
13.5
23.3
29.2
25.9
0.020
N/A
47.3
33.7
8.2
N/A
0.4
1.4
2003
278
100
0.46
0.58
15.5
24.6
29.5
27.3
0.039
N/A
60.4
42.6
10.8
N/A
0.6
1.4
2002
203
111
0.43
0.66
16.4
25.5
30.5
27.1
0.034
N/A
53.3
41.8
11.0
N/A
0.4
1.6
2001
139
105
0.51
0.68
15.5
24.3
28.7
26.3
0.046
N/A
N/A
37.8
9.8
N/A
0.7
1.5
2000
145
117
0.67
0.69
17.8
29.6
27.8
26.8
0.072
N/A
N/A
45.6
9.1
N/A
1.0
1.7
Natural disasters
Type
El Paso
Chandler
Tornado activity compared to U.S. average
4.2%
18.5%
Earthquake activity compared to U.S. average
524.4%
2,391%
Natural disasters compared to U.S. average
11%
16%
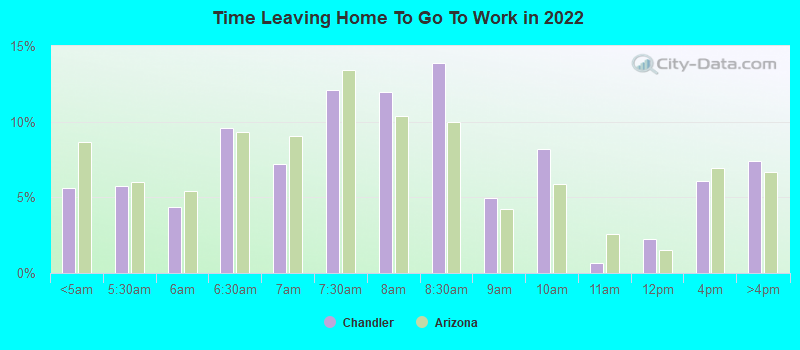
Transportation
Both El Paso and Chandler have comprehensive public transportation systems. El Paso's bus system, Sun Metro, serves the entire city, while Chandler residents use Valley Metro. However, like many cities in the western US, both cities require a car for best mobility.
Transport
Type
El Paso
Chandler
Amtrak stations
1
0
Amtrak stations nearby
1
2
FAA registered aircraft
331
438
FAA registered aircraft manufacturers and dealers
6
5
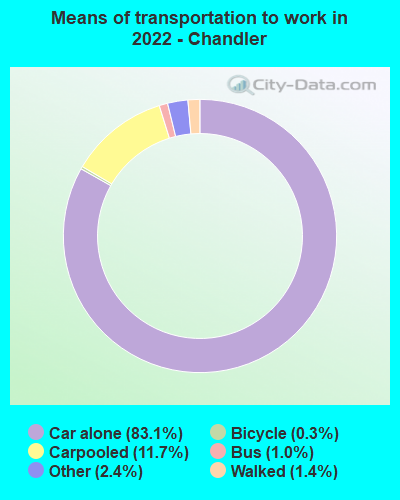
Means of transportation to work
Type
El Paso
Chandler
Bicycle
0.3%
0.4%
Bus
1.3%
0.3%
Carpooled
11.2%
10.6%
Car alone
83.4%
84.8%
Motorcycle
0.2%
0.5%
Walked
1.6%
2.2%
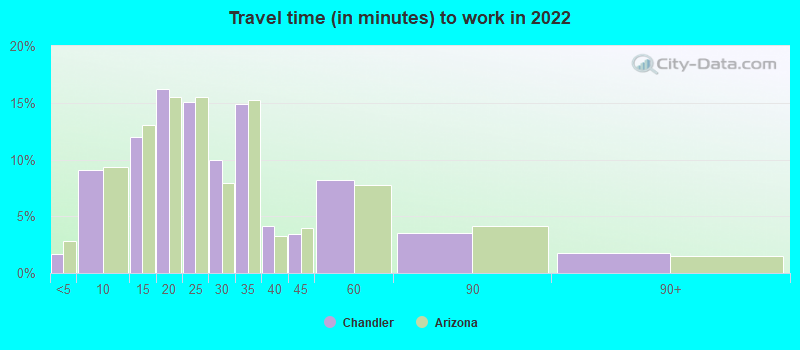
Average travel time to work
Type
El Paso
Chandler
Average
25.1 min
25.7 min
Other means
22.2 min
26.3 min
Public transportation
46.4 min
50.1 min
Private vehicle occupancy
Type
El Paso
Chandler
Average
1.2
1.2
Drove alone
88.5%
89.3%
In 2 person carpool
7.9%
8%
In 3 person carpool
2.1%
1%
In 4 person carpool
0.7%
0.7%
In 5-6 person carpool
0.7%
0.9%
In 7+ person carpool
0.1%
0.1%
How many people usually rode to work in the car, truck or van.
Real Estate
The real estate market differs significantly between the two. El Paso's real estate is generally more affordable with median home prices lower than the national average, but with slower growth. Chandler's real estate is more expensive, but also presents higher growth and investment opportunities.
Neighborhoods
El Paso's neighborhoods, such as Kern Place and Sunset Heights, are rich in history and culture, providing an authentic Texan living experience. Chandler offers a different experience, with neighborhoods like Ocotillo and Fulton Ranch providing a blend of modern living with a touch of desert charm.
Houses and residents
Type
El Paso
Chandler
Houses
261,779
112,136
Average household size (people)
3
2.7
Median year apartment built
1982
1997
Median year house/condo built
1985
1997
Length of stay in the house since moving in
14.7 years
10.6 years
Houses occupied
242,529 (92.6%)
107,668 (96%)
Houses occupied by owners
147,788 (60.9%)
71,036 (66%)
Houses occupied by renters
94,741 (39.1%)
36,632 (34%)
Median rent asked for vacant for-rent units
$570.82
$2,338
Median monthly housing costs
$939
$1,573
Median price asked for vacant for-sale houses and condos
$227,007
$461,127
Estimated median house or condo value
$152,800
$435,100
Median numbers of rooms
5.4
5.5
Median number of rooms in apartments
4.3
4.2
Median number of rooms in houses and condos
6.2
6.3
Median house price - detached houses
$187,761
$493,497
Median house price - in 2-unit structures
Over $1,000,000
$583,625
Median house price - in 3-to-4-unit structures
$75,782
$260,715
Median house price - in 5 or more unit structures
$266,003
$287,805
Median house price - mobile homes
$43,095
$81,606
Median house price - occupied boats, rvs, vans etc.
$9,296
$36,427
Median house price - Townhouses or other attached units
$149,459
$316,438
Median house price - All housing units
$186,951
$471,395
Median house age
38
24
Renting percentage
39.6%
33.7%
Housing density (houses/condos per square mile)
1,051
1,937.2
House value disparities
32.7%
22.8%
Household income disparities
46.6%
38.9%
Median household income for houses/condes with a mortgage
$74,665
$122,158
Median household income for apartments without a mortgage
$52,954
$78,975
Housing units without a mortgage
1,889 (2.2%)
907 (1.6%)
Housing units with both a second mortgage and home equity loan
2,956 (3.4%)
3,763 (6.8%)
Housing units with a mortgage
84,973 (97.8%)
54,712 (98.4%)
Housing units with a home equity loan
250 (0.3%)
0 (0%)
Housing units with a second mortgage
3,635 (4.2%)
4,390 (7.9%)
House/condo owner moved in on average (years ago)
14
8
House/condo renter moved in on average (years ago)
1
1
Housing units lacking complete kitchen facilities
2%
1.1%
Housing units lacking complete plumbing facilities
2%
0.4%
Housing units in structures
Housing units in structures
El Paso
Chandler
One, detached
67.7%
68.7%
One, attached
4.4%
5.5%
Two
2.4%
1.2%
3 or 4
4.1%
4.5%
5 to 9
5.9%
4.7%
10 to 19
5.8%
4.8%
20 to 49
2.4%
1.8%
50 or more
4.8%
7.5%
Mobile homes
2.3%
1.3%
Boats, RVs, vans, etc.
0.2%
0.0%
Median real estate property taxes paid for housing units
Self-employed workers in own not incorporated business
19,650
8,781
State government workers
12,525
4,501
Unpaid family workers
901
180
Industries and Occupations
The main industries in El Paso include education, healthcare, and government services, while Chandler's economy is driven by high tech, manufacturing, and finance sectors. In terms of occupations, El Paso has a majority of service occupations, while Chandler has a majority of management, professional and related occupations.
Both locals and visitors have access to excellent health care in El Paso and Chandler. El Paso is a regional medical hub with numerous hospitals and specialty clinics. Chandler has a wide range of world-class healthcare facilities, including the Chandler Regional Medical Center.
Health (county statistics)
Type
El Paso
Chandler
General health status score of residents in this county from 1 (poor) to 5 (excellent)
In terms of infrastructure, Chandler's modern, well-maintained city structure stands out. Street maintenance, public facilities, and utilities are top notch. El Paso's infrastructure is also well developed, particularly in healthcare and transportation, with continuous development projects to enhance city life.
Infrastructure
Type
El Paso
Chandler
Hospitals
41
2
TV stations
10
20
Bank branches located here
89
59
Bank institutions located here
19
20
Main business address for public companies
7
1
Drinking water stations with no reported violations in the past
0
1
Drinking water stations with reported violations in the past
HMDA - Conventional home purchase loans - Applications denied
Year
El Paso
Chandler
1999
1,994
879
2000
993
790
2001
704
513
2002
594
487
2003
1,268
854
2004
1,646
1,296
2005
2,316
1,916
2006
2,701
1,705
2007
2,051
949
2008
1,034
374
2009
454
249
Culture and Food
Culture and food are distinct and vibrant in both cities. El Paso celebrates its unique blend of Mexican and American cultures, with numerous festivals and a culinary scene dominated by flavorful Tex-Mex cuisine. Chandler, while also diverse, offers a more typical Southwestern experience with a wide range of culinary options and cultural festivals.
Sports Teams
Sports enthusiasts will find pleasure in both locales. El Paso hosts minor league teams and shares a strong passion for high school football. Chandler is close to Phoenix, offering easy access to professional sports like the NFL's Cardinals, the NBA's Suns, and the MLB's Diamondbacks.


 El Paso, TX
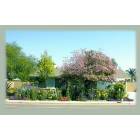
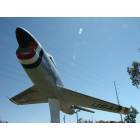
 Chandler, AZ