This comparison guide between El Paso, Texas, and Bakersfield, California will provide valuable information for both potential transplants and visitors alike. Covering aspects like safety, weather, costs, employment opportunities, transportation, taxes, cultural features, and more, this guide aims to give a complete picture of what to expect when considering these two diverse areas of the United States.
Distance between
El Paso, TX and
Bakersfield, CA : 765.8 miles
El Paso's population is larger by 66%. Its population has grown by 114,753 people (20.4%) since 2000. The population of Bakersfield has grown by 160,558 people (65.0%) during that time.
Overall, El Paso, Texas, statistically has a lower crime rate than Bakersfield, California. El Paso is often ranked as one of "America's Safest Big Cities," which distinguishes it as a peaceful place for families and tourists. Bakersfield, on the other hand, has a higher crime rate, particularly with property crime. So, while both cities have neighborhoods ranging from very safe to less so, El Paso has the edge from a crime and safety standpoint.
City-data.com crime index counts serious crimes and violent crime more heavily. It adjusts for the number of visitors and daily workers commuting into cities. (higher means more crime, U.S. average = 301.1)
City-data.com crime index counts serious crimes and violent crime more heavily. It adjusts for the number of visitors and daily workers commuting into cities. (higher means more crime, U.S. average = 301.1)
Sex Offenders
According to our data, there are 1,253 registered sex offenders living in El Paso and 1,149 registered sex offenders living in . The ratio of residents to sex offenders in El Paso is 545 to 1; the ratio in Bakersfield is 328 to 1. The number of registered sex offenders compared to the number of residents is a smaller in El Paso than in Bakersfield.
Cost of Living
In terms of cost of living, El Paso tops Bakersfield, with lower costs in nearly all sectors, including housing, groceries, and healthcare. While Bakersfield is more affordable compared to other Californian cities, El Paso remains among the more affordable cities in the U.S., providing an improved cost of living compared to Bakersfield.
Income Tax
Texas has no state income tax, a major advantage for residents of El Paso. Bakersfield residents, meanwhile, are subject to California's progressive income tax, which ranges from 1% to 13.3% depending on income.
Property Tax
El Paso has a higher property tax rate compared with Bakersfield. Texas has no state-wide property tax, but El Paso City and County average extends to about 2.1%. Residents of Bakersfield enjoy lower property taxes, with Kern County typically charging around 0.77% of a property's assessed value.
Sales Tax
El Paso has a lower sales tax rate compared to Bakersfield. Texas's sales tax is 6.25%, with an additional 2% for El Paso, making it a total of 8.25%. Bakersfield, on the other hand, has a total sales tax of 7.25% plus an additional district tax, pushing the rate upwards of 8.25%.
Income
Type
El Paso
Bakersfield
Estimated median household income
$51,241
$66,666
Estimated per capita income
$25,670
$29,363
Cost of living index (U.S. average is 100)
82.2
92.6
If you make $50,000 in El Paso, you will have to make $56,326 in Bakersfield to maintain the same standard of living.
Geographical Conditions
Bakersfield is located in the San Joaquin Valley, close to both the coast and mountains, offering a wide range of outdoor activities. El Paso is nestled in the western corner of Texas, boasting an attractive location along the Rio Grande and nearby to both the Franklin Mountains and New Mexico's beautiful landscapes.
Bakersfield holds an edge when it comes to education, with its school district boasting higher average test scores than El Paso. For those pursuing higher education, Bakersfield is home to California State University-Bakersfield, while El Paso hosts The University of Texas at El Paso (UTEP). Both cities offer decent educational opportunities.
Both cities have robust and growing economies. El Paso's economy benefits from a strong military presence and growing industries in health care and education. Conversely, Bakersfield's economy is heavily influenced by agriculture, petroleum, and manufacturing sectors.
Biggest Employers
The largest employers in Bakersfield include Chevron, Giumarra Companies (agricultural), and Kern Medical. Conversely, in El Paso, the Fort Bliss Military Base, the University of Texas at El Paso, and the El Paso Independent School District are the largest employers.
There were 1,961 building permits issued in El Paso in 2012 (1005 less than in 2011) compared to 1,121 building permits issued in Bakersfield in 2012 (699 more than in 2011).
In El Paso (El Paso County), 65.5% voted for Democrats and 33.2% for Republicans in 2012 Presidential Election. In Bakersfield (Kern County), 40.3% voted for Democrats and 57.0% for Republicans.
Elections
Type
Democrats
Republicans
Other
Year
El Paso
Bakersfield
El Paso
Bakersfield
El Paso
Bakersfield
2020
66.8%
43.7%
31.6%
53.9%
1.6%
2.4%
2016
69.1%
40.4%
26.0%
53.1%
4.9%
6.5%
2012
65.5%
40.3%
33.2%
57.0%
1.3%
2.7%
2008
66.0%
40.1%
33.4%
57.9%
0.6%
1.9%
2004
56.2%
32.7%
43.3%
67.0%
0.5%
0.3%
2000
57.9%
36.3%
39.8%
60.8%
2.3%
2.9%
1996
62.3%
36.6%
32.1%
53.8%
5.6%
9.7%
Breakdown of population affiliated with a religious congregation
Type
Adherents
Congregations
Religion
El Paso
Bakersfield
El Paso
Bakersfield
CATHOLIC CHURCH
43.2%
29.3%
11.3%
4.9%
SOUTHERN BAPTIST CONVENTION
3.3%
3.2%
26.6%
12.0%
SEVENTH DAY ADVENTIST CHURCH
0.3%
0.6%
1.6%
2.9%
LUTHERAN CHURCH
0.2%
0.4%
1.0%
2.0%
MUSLIM ESTIMATE
0.1%
0.5%
0.2%
0.7%
Weather
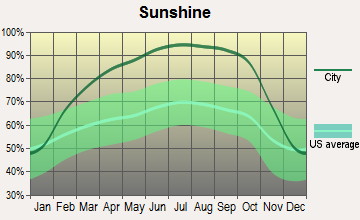
Bakersfield boasts a Mediterranean climate with hot summers and mild winters, making it a draw for individuals seeking sunshine year-round. In contrast, El Paso experiences a desert climate, with very hot summers, cooler winters, and less year-round precipitation. For those partial to dryer climates, El Paso may be the more appealing option.
Weather and climate
Type
El Paso
Bakersfield
Temperature - Average
64.6°F
64.9°F
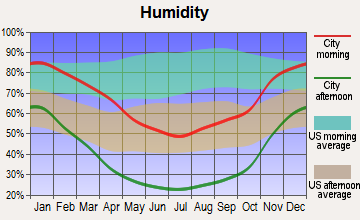
Humidity - Average morning or afternoon humidity
42.7%
53.5%
Humidity - Differences between morning and afternoon humidity
42.8%
59%
Humidity - Maximum monthly morning or afternoon humidity
59.8%
80%
Humidity - Minimum monthly morning or afternoon humidity
17%
21%
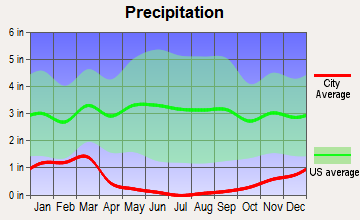
Precipitation - Yearly average
9.4 in
6.5 in
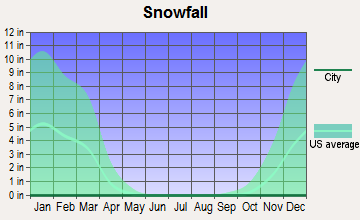
Snowfall - Yearly average
10.7 in
0 in
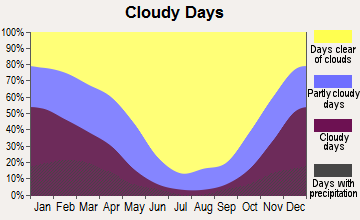
Clouds - Number of days clear of clouds
31.8%
31.8%
Sunshine amount - Average
89.4%
80.8%
Sunshine amount - Differences during a year
13.9%
31.1%
Sunshine amount - Maximum monthly
89.3%
89.5%
Sunshine amount - Minimum monthly
75.4%
58.4%
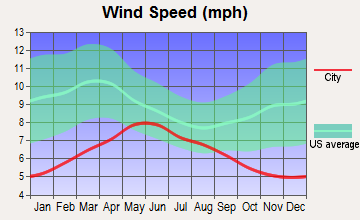
Wind speed - Average
8.9 mph
6.8 mph
Average climate in El Paso, Texas
Average climate in Bakersfield, California
Air pollution
Type
AQI
CO
NO2
OZONE
PB
PM10
PM25
SO2
Year
El Paso
Bakersfield
El Paso
Bakersfield
El Paso
Bakersfield
El Paso
Bakersfield
El Paso
Bakersfield
El Paso
Bakersfield
El Paso
Bakersfield
El Paso
2018
139
135
0.17
0.28
14.0
12.3
32.0
32.3
N/A
0.004
35.7
53.7
9.2
15.7
N/A
N/A
2017
173
141
0.19
0.29
13.0
12.7
30.5
32.9
N/A
0.004
40.4
68.2
9.5
15.8
0.5
N/A
2016
148
127
0.17
0.27
12.6
11.7
30.6
31.0
N/A
0.004
35.2
N/A
9.2
14.5
0.5
N/A
2015
112
144
0.18
0.29
12.7
11.8
30.8
32.2
N/A
0.003
31.2
N/A
8.0
16.2
0.5
N/A
2014
157
141
0.13
0.28
12.8
13.3
30.0
31.5
N/A
N/A
40.3
53.0
9.7
17.9
0.4
N/A
2013
211
134
0.23
0.30
14.1
14.3
30.5
31.0
N/A
0.003
43.9
N/A
10.8
21.7
0.4
N/A
2012
229
145
0.30
N/A
15.9
14.6
31.6
32.4
N/A
0.004
40.2
N/A
11.6
17.2
0.4
N/A
2011
221
126
0.23
N/A
15.9
15.0
31.2
29.3
N/A
0.004
34.7
43.9
11.6
17.8
0.5
N/A
2010
211
147
0.25
N/A
15.3
14.4
29.4
29.3
N/A
0.003
28.8
39.2
7.9
17.2
0.3
N/A
2009
117
170
0.23
0.37
15.4
16.6
29.5
28.0
N/A
0.005
28.6
41.5
8.3
20.8
0.3
N/A
2008
210
171
0.25
0.48
15.2
17.4
30.1
27.8
0.017
N/A
34.6
57.0
9.7
22.7
0.6
N/A
2007
134
167
0.28
0.55
13.9
18.5
30.6
26.2
0.019
0.007
40.5
43.0
8.4
23.0
0.4
N/A
2006
241
157
0.37
0.56
14.3
19.2
30.6
29.6
0.018
N/A
55.0
N/A
11.1
18.0
0.3
N/A
2005
159
165
0.43
0.53
13.1
19.3
29.6
28.2
0.013
N/A
44.5
N/A
9.6
21.5
0.6
N/A
2004
183
163
0.38
0.51
13.5
19.9
29.2
27.1
0.020
N/A
47.3
N/A
8.2
21.3
0.4
N/A
2003
278
170
0.46
0.56
15.5
21.2
29.5
29.1
0.039
N/A
60.4
N/A
10.8
24.4
0.6
N/A
2002
203
170
0.43
0.60
16.4
22.5
30.5
26.9
0.034
0.006
53.3
N/A
11.0
29.5
0.4
N/A
2001
139
150
0.51
0.73
15.5
18.2
28.7
29.6
0.046
0.006
N/A
39.6
9.8
N/A
0.7
N/A
2000
145
130
0.67
0.77
17.8
23.4
27.8
28.8
0.072
0.006
N/A
39.6
9.1
N/A
1.0
N/A
Natural disasters
Type
El Paso
Bakersfield
Tornado activity compared to U.S. average
4.2%
2.7%
Earthquake activity compared to U.S. average
524.4%
7,870.5%
Natural disasters compared to U.S. average
11%
29%
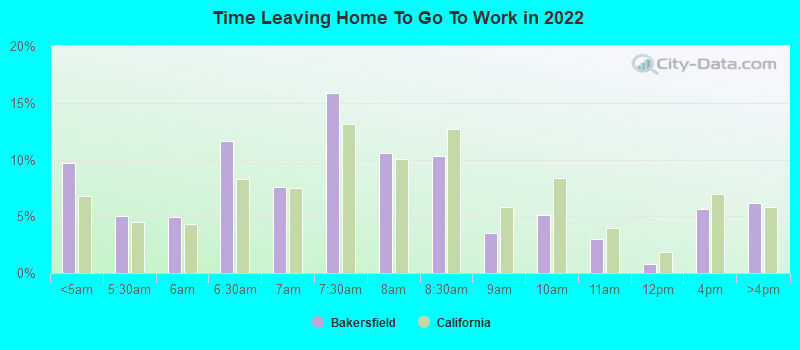
Transportation
Both Bakersfield and El Paso have comprehensive public transportation systems, but Bakersfield’s are slightly more extensive, including options such as buses, shuttles, and a light rail. Commute times in El Paso are typically shorter than in Bakersfield, aiding in less congestion and a generally smoother commute.
Transport
Type
El Paso
Bakersfield
Amtrak stations
1
1
Amtrak stations nearby
1
1
FAA registered aircraft
331
433
FAA registered aircraft manufacturers and dealers
6
12
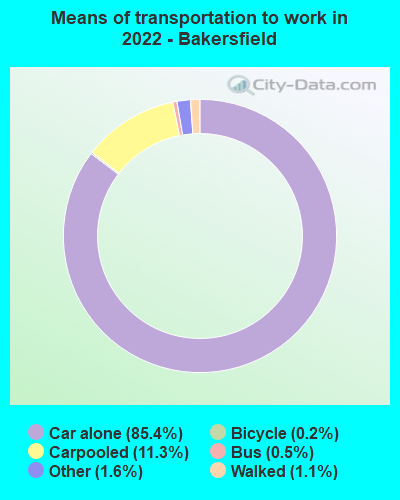
Means of transportation to work
Type
El Paso
Bakersfield
Bicycle
0.3%
0.2%
Bus
1.3%
0.3%
Carpooled
11.2%
8.7%
Car alone
83.4%
87.4%
Motorcycle
0.2%
0.3%
Walked
1.6%
0.8%
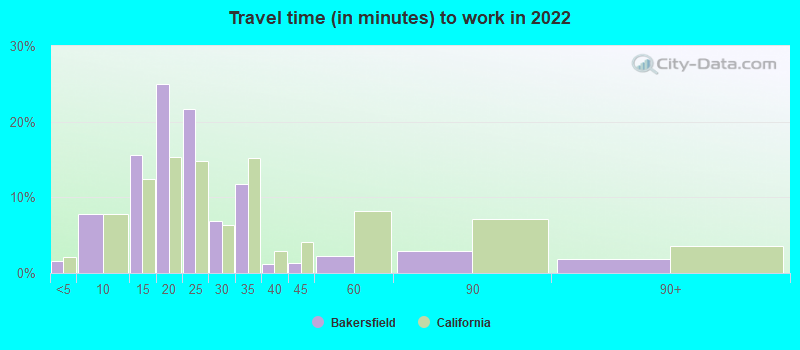
Average travel time to work
Type
El Paso
Bakersfield
Average
25.1 min
21.5 min
Other means
22.2 min
22.2 min
Public transportation
46.4 min
44.6 min
Private vehicle occupancy
Type
El Paso
Bakersfield
Average
1.2
1.2
Drove alone
88.5%
89.3%
In 2 person carpool
7.9%
6.2%
In 3 person carpool
2.1%
2.9%
In 4 person carpool
0.7%
1%
In 5-6 person carpool
0.7%
0.5%
How many people usually rode to work in the car, truck or van.
Real Estate
The real estate market in El Paso is more affordable than in Bakersfield. Median home prices in El Paso are significantly lower, making the Texas city a more affordable option for homeownership. Conversely, Bakersfield, while still cheaper than other California cities, has a higher average home price.
Neighborhoods
El Paso's neighborhoods have a unique southwestern charm, with Mesa Heights and Mission Hills being popular among families. Bakersfield has a mix of upscale areas like Seven Oaks and more affordable neighborhoods like Oleander-Sunset, attracting diverse residents.
Houses and residents
Type
El Paso
Bakersfield
Houses
261,779
134,270
Average household size (people)
3
3.1
Median year apartment built
1982
1984
Median year house/condo built
1985
1994
Length of stay in the house since moving in
14.7 years
11.8 years
Houses occupied
242,529 (92.6%)
128,007 (95.3%)
Houses occupied by owners
147,788 (60.9%)
78,398 (61.2%)
Houses occupied by renters
94,741 (39.1%)
49,609 (38.8%)
Median rent asked for vacant for-rent units
$570.82
$1,220
Median monthly housing costs
$939
$1,384
Median price asked for vacant for-sale houses and condos
$227,007
$366,859
Estimated median house or condo value
$152,800
$318,600
Median numbers of rooms
5.4
5.2
Median number of rooms in apartments
4.3
4.1
Median number of rooms in houses and condos
6.2
5.9
Median house price - detached houses
$187,761
$371,576
Median house price - in 2-unit structures
Over $1,000,000
$254,175
Median house price - in 3-to-4-unit structures
$75,782
$299,855
Median house price - in 5 or more unit structures
$266,003
$221,915
Median house price - mobile homes
$43,095
$92,500
Median house price - Townhouses or other attached units
$149,459
$244,694
Median house price - All housing units
$186,951
$356,236
Median house age
38
32
Renting percentage
39.6%
40.3%
Housing density (houses/condos per square mile)
1,051
1,187.2
House value disparities
32.7%
29.3%
Household income disparities
46.6%
44.3%
Median household income for houses/condes with a mortgage
$74,665
$98,668
Median household income for apartments without a mortgage
$52,954
$60,298
Housing units without a mortgage
1,889 (2.2%)
376 (0.7%)
Housing units with both a second mortgage and home equity loan
2,956 (3.4%)
1,793 (3.1%)
Housing units with a mortgage
84,973 (97.8%)
56,648 (99.3%)
Housing units with a home equity loan
250 (0.3%)
0 (0%)
Housing units with a second mortgage
3,635 (4.2%)
2,474 (4.3%)
House/condo owner moved in on average (years ago)
14
9
House/condo renter moved in on average (years ago)
1
2
Housing units lacking complete kitchen facilities
2%
2.1%
Housing units lacking complete plumbing facilities
2%
0.2%
Housing units in structures
Housing units in structures
El Paso
Bakersfield
One, detached
67.7%
71.5%
One, attached
4.4%
3.9%
Two
2.4%
1.3%
3 or 4
4.1%
7.8%
5 to 9
5.9%
3.8%
10 to 19
5.8%
2.0%
20 to 49
2.4%
2.2%
50 or more
4.8%
5.1%
Mobile homes
2.3%
2.3%
Boats, RVs, vans, etc.
0.2%
0.0%
Median real estate property taxes paid for housing units
Self-employed workers in own not incorporated business
19,650
11,506
State government workers
12,525
10,997
Unpaid family workers
901
161
Industries and Occupations
In Bakersfield, the primary industries are oil, agriculture, and food processing, and the city is a significant hub for Kern County's agricultural products. El Paso, on the other hand, heavily relies on international trade, healthcare, and education sectors for employment. The strongest occupations vary between the two cities based on these industry strengths.
Both cities have access to quality healthcare. El Paso's healthcare is highly recognized, particularly for its extensive medical research at UTEP. Bakersfield, however, offers good healthcare services too, with Kern Medical being one of the top employers and medical providers in the area.
The infrastructure in both El Paso and Bakersfield is efficient. However, as with any city, each has its problem areas and room for improvement. Bakersfield is implementing plans to expand its public transportation options, while El Paso is focusing on improving roads and highways.
Infrastructure
Type
El Paso
Bakersfield
Hospitals
41
18
TV stations
10
9
Arenas or stadiums
2
1
Bank branches located here
89
65
Bank institutions located here
19
19
Main business address for public companies
7
2
Drinking water stations with no reported violations in the past
0
7
Drinking water stations with reported violations in the past
HMDA - Conventional home purchase loans - Applications denied
Year
El Paso
Bakersfield
1999
1,994
392
2000
993
393
2001
704
297
2002
594
372
2003
1,268
1,104
2004
1,646
2,188
2005
2,316
3,038
2006
2,701
3,393
2007
2,051
2,036
2008
1,034
565
2009
454
289
Culture and Food
El Paso has a rich Hispanic cultural influence visible in its local cuisine, events, architecture, and art scene. Bakersfield also has a lively food and arts scene, though with a more Californian vibe, including a music culture renowned for the "Bakersfield Sound" in country music.
Sports Teams
While neither city hosts a major sports franchise, sports fans aren't left wanting. Bakersfield is home to Minor League Baseball team - the Bakersfield Train Robbers, and El Paso hosts the El Paso Chihuahuas, a minor league baseball team, and El Paso Locomotive, a United Soccer League club.


 El Paso, TX
 Bakersfield, CA