Overview
Seattle, Washington, is a vibrant city known for its tech industry, distinct culture, and stunning natural scenery. On the other hand, Northwest Clackamas, Oregon, is a quieter, suburban area that appeals to families and individuals looking for a slower pace of life, yet with access to Portland nearby. In the following sections, we will compare these two places focusing on several areas, examining the conditions for prospective residents or tourists alike.
Crime/Safety
East Seattle generally has a higher crime rate than Northwest Clackamas, with property crime being more frequent than violent crime. However, safer neighborhoods exist within East Seattle, making this area attractive for family living. In contrast, Northwest Clackamas is noted for its lower crime rates, making it a safer option overall for residents and tourists alike. The area is often chosen by families for its relative peace and safety.
Weather
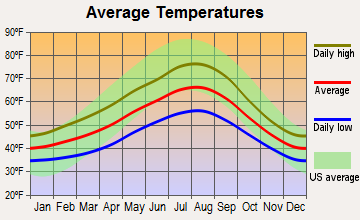
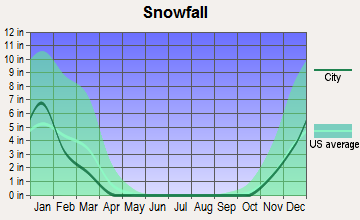
Weatherwise, East Seattle is known for its frequent rain and relatively mild temperatures, seldom seeing extremes in hot or cold. Many people enjoy this kind of weather, feeding the city's lush landscapes. On the other hand, Northwest Clackamas experiences more diverse seasonal changes, with warmer summers and colder winters.
Cost of Living
Living in East Seattle is generally more expensive than Northwest Clackamas. This is reflected in housing costs, groceries, transportation, and entertainment. However, the higher cost of living in East Seattle is often offset by higher wages, particularly in sectors like technology. In contrast, Northwest Clackamas has a lower cost of living but also generally lower wages.
Education
Seattle boasts high-quality education institutions, including esteemed universities like the University of Washington and Seattle University. East Seattle also features strong public and private schools. Northwest Clackamas' education system is also commendable, with well-regarded public schools and proximity to several universities, including Portland State University and Lewis and Clark College.
Work and Economy
Seattle's economy is powered by the tech industry, with giants like Microsoft and Amazon having a significant presence. Additionally, other sectors such as healthcare, manufacturing, and retail also contribute significantly to Seattle's economic landscape. In contrast, Northwest Clackamas has a more diversified economy, with sectors like manufacturing, healthcare, retail, and education being significant contributors.
Infrastructure
Infrastructure in East Seattle is well-developed, owing to the city's technological prowess and urban planning. Expansive public transportation, green spaces, and recreational facilities characterize the city. On the other hand, Northwest Clackamas exhibits a more suburban infrastructure, with a focus on community facilities, parks, and local businesses.
Industries and Occupations
Technology, healthcare, and manufacturing dominate the industries in East Seattle, with most residents working in these sectors. In contrast, Northwest Clackamas has a wider array of industries with significant presence of healthcare, education, manufacturing, and retail.
Biggest Employers
The biggest employers in East Seattle include Amazon, Microsoft, and the University of Washington. On the contrary, in Northwest Clackamas, the largest employers are Clackamas County, Kaiser Permanente, and Fred Meyer.
Real-Estate
Real estate in East Seattle tends to be more expensive, with higher median home prices than in Northwest Clackamas. Both rent and purchasing prices tend to be higher due to the prime location and demand. Northwest Clackamas also has a robust real estate market but with more affordable options, making it more attractive for families and first-time homebuyers.
Neighborhoods
Seattle is known for its diverse neighborhoods, each offering their own distinct atmosphere, from the bustling downtown area to the peaceful residential neighborhoods. Northwest Clackamas is predominantly residential, with quiet neighborhoods that are perfect for families.
Transportation/Public Transit/Commuting
Seattle has a well-developed public transit system, including buses, ferries, and a light rail system. Consequently, commuting times can be relatively low, although the city is infamous for its rush hour traffic. On the other hand, public transit in Northwest Clackamas is not as extensive, and most residents rely on cars, resulting in longer commuting times.
City/State Sales Tax
Washington State, including East Seattle, has a higher sales tax rate compared to Oregon. In fact, Oregon, including Northwest Clackamas, does not levy a sales tax, which can translate into significant savings on purchases for residents and tourists alike.
City/State Income Tax
While there is no city or state income tax in Washington State, households in Oregon pay both state and city income taxes. This difference can be a significant factor for people considering moving between these two areas.
City/State Property Tax
Both East Seattle and Northwest Clackamas have property taxes that are essential for generating community revenue. While rates can vary depending upon the neighborhood, generally, property taxes in Oregon are higher than those in Washington State.
Culture/Food
Seattle is known for its diverse culture and renowned food scene, featuring everything from seafood markets to gourmet coffee shops. On the other hand, Northwest Clackamas, being a suburban area, offers a quieter cultural scene and local eateries, with access to Portland's vibrant food scene nearby.
Sports Teams
Seattle sports fans have a lot to cheer for with teams like the Seattle Seahawks (NFL), Mariners (MLB), Sounders (MLS), and Kraken (NHL). Northwest Clackamas, on the other hand, doesn't have professional sports teams but residents can support the Portland Trail Blazers (NBA) and Timbers (MLS) nearby.
Geographical Conditions
Geographically, Seattle is noted for its picturesque surroundings, with rivers, mountains, and the Puget Sound as its backdrop. Northwest Clackamas, on the other hand, offers its own natural beauty, bordered by the Clackamas River and nearby Mount Hood.
Health Care
In terms of healthcare, Seattle is home to top-tier medical facilities such as the University of Washington Medical Center. Northwest Clackamas has solid healthcare options too, with proximity to the Kaiser Permanente Sunnyside Medical Center and other Portland area hospitals.
Summary
While both East Seattle and Northwest Clackamas provide unique living experiences, they cater to different lifestyles. East Seattle might be more suitable for those seeking a bustling urban environment with high-tech employment opportunities, a lively culture, and comprehensive city services. In contrast, Northwest Clackamas could be the perfect fit for those seeking a quieter, family-oriented atmosphere with access to nature, lower costs, and fewer urban distractions. Deciding between the two will largely depend on personal preferences and lifestyle choices. Whether you are looking to relocate or simply plan a visit, both East Seattle and Northwest Clackamas have much to offer.
In East Seattle (King County), 69.0% voted for Democrats and 28.5% for Republicans in 2012 Presidential Election. In Northwest Clackamas (Clackamas County), 50.6% voted for Democrats and 46.9% for Republicans.
Elections
Type
Democrats
Republicans
Other
Year
East Seattle
Northwest Clackamas
East Seattle
Northwest Clackamas
East Seattle
Northwest Clackamas
2020
75.1%
54.0%
22.3%
42.9%
2.6%
3.2%
2016
70.0%
47.7%
21.1%
41.3%
8.9%
11.0%
2012
69.0%
50.6%
28.5%
46.9%
2.5%
2.5%
2008
70.2%
53.9%
28.1%
43.6%
1.7%
2.5%
2004
65.1%
49.0%
33.8%
50.3%
1.1%
0.7%
2000
60.3%
47.3%
34.5%
48.0%
5.2%
4.7%
1996
56.4%
46.6%
31.4%
41.0%
12.2%
12.4%
Breakdown of population affiliated with a religious congregation
Type
Adherents
Congregations
Religion
East Seattle
Northwest Clackamas
East Seattle
Northwest Clackamas
CATHOLIC CHURCH
14.4%
7.2%
4.9%
4.2%
EVANGELICAL LUTHERAN CHURCH IN AMERICA
1.3%
1.4%
4.7%
4.5%
EPISCOPAL CHURCH
0.8%
0.7%
2.4%
1.6%
AMERICAN BAPTIST CHURCHES IN THE USA
0.6%
0.2%
2.9%
1.0%
MUSLIM ESTIMATE
0.6%
0.0%
1.4%
0.0%
SEVENTH DAY ADVENTIST CHURCH
0.6%
1.2%
2.3%
3.8%
LUTHERAN CHURCH
0.5%
0.6%
2.0%
2.2%
SOUTHERN BAPTIST CONVENTION
0.3%
0.5%
3.8%
2.6%
Weather and climate
Type
East Seattle
Northwest Clackamas
Temperature - Average
52.5°F
54.7°F
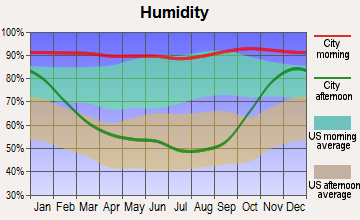
Humidity - Average morning or afternoon humidity
78.5%
76.6%
Humidity - Differences between morning and afternoon humidity
38%
42.1%
Humidity - Maximum monthly morning or afternoon humidity
86%
86%
Humidity - Minimum monthly morning or afternoon humidity
48%
43.9%
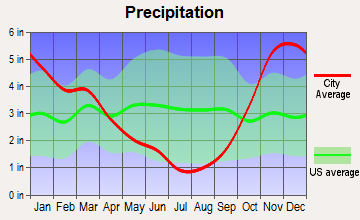
Precipitation - Yearly average
36.8 in
45.5 in
Snowfall - Yearly average
21.4 in
12.8 in
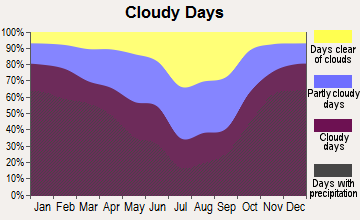
Clouds - Number of days clear of clouds
11.7%
11.3%
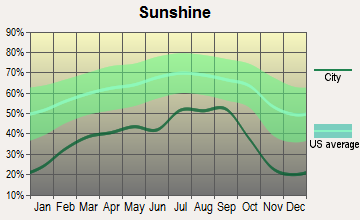
Sunshine amount - Average
49.4%
54.7%
Sunshine amount - Differences during a year
44%
52%
Sunshine amount - Maximum monthly
64%
72%
Sunshine amount - Minimum monthly
20%
20%
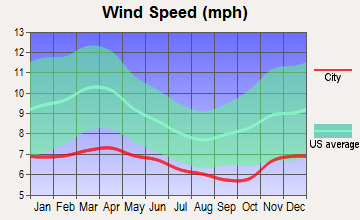
Wind speed - Average
8.6 mph
8.1 mph
Average climate in East Seattle, Washington
Average climate in Northwest Clackamas, Oregon
Air pollution
Type
AQI
CO
NO2
OZONE
PB
PM10
PM25
SO2
Year
East Seattle
Northwest Clackamas
East Seattle
Northwest Clackamas
East Seattle
Northwest Clackamas
East Seattle
Northwest Clackamas
East Seattle
Northwest Clackamas
East Seattle
East Seattle
Northwest Clackamas
East Seattle
Northwest Clackamas
2018
85
79
0.21
0.26
10.6
8.8
21.0
22.3
N/A
N/A
N/A
N/A
5.1
7.1
0.7
0.4
2017
100
93
0.23
0.26
11.1
8.7
21.2
23.4
N/A
N/A
N/A
N/A
4.6
7.1
0.3
0.4
2016
67
72
0.22
0.25
11.9
8.7
20.2
21.5
N/A
N/A
N/A
N/A
3.8
5.1
0.6
0.2
2015
88
91
0.23
0.28
10.8
9.2
19.4
21.0
N/A
N/A
N/A
N/A
5.6
7.1
0.8
0.5
2014
75
90
0.24
0.24
11.5
8.5
19.5
21.6
N/A
N/A
N/A
N/A
5.7
6.2
N/A
0.8
2013
81
85
0.24
0.29
N/A
9.6
17.2
18.6
N/A
N/A
N/A
N/A
5.9
8.3
0.8
1.1
2012
83
78
0.23
0.30
N/A
9.1
19.3
21.6
N/A
N/A
N/A
N/A
5.2
6.9
1.0
0.6
2011
73
89
0.24
0.34
N/A
9.4
18.6
19.2
N/A
N/A
N/A
N/A
5.2
7.9
1.1
0.8
2010
73
80
0.24
0.33
N/A
9.1
18.0
19.9
N/A
N/A
N/A
N/A
4.4
6.0
1.1
1.4
2009
94
95
0.27
0.32
N/A
10.2
18.3
20.8
N/A
N/A
N/A
N/A
6.0
8.2
1.4
1.6
2008
80
101
0.30
0.34
N/A
10.9
17.8
20.1
N/A
N/A
N/A
N/A
5.4
8.5
1.3
1.0
2007
85
101
0.30
0.35
N/A
11.4
17.7
17.7
N/A
N/A
19.0
N/A
6.4
8.4
1.5
1.3
2006
102
106
N/A
N/A
N/A
N/A
18.4
N/A
N/A
N/A
21.1
N/A
7.2
7.5
N/A
1.5
2005
104
96
0.80
N/A
18.3
N/A
N/A
N/A
N/A
N/A
22.9
N/A
7.6
8.1
3.5
1.7
2004
110
92
0.81
N/A
17.9
N/A
N/A
N/A
N/A
N/A
N/A
N/A
8.3
9.4
3.0
N/A
2003
100
77
0.85
N/A
18.5
N/A
N/A
N/A
N/A
0.008
N/A
N/A
8.3
8.6
2.4
N/A
2002
90
67
1.07
N/A
19.3
N/A
N/A
N/A
N/A
0.010
N/A
N/A
10.7
8.4
2.7
N/A
2001
91
73
1.08
N/A
20.5
N/A
N/A
N/A
0.004
0.008
N/A
N/A
11.1
8.9
3.7
N/A
2000
99
52
1.21
N/A
20.9
N/A
N/A
N/A
N/A
N/A
N/A
N/A
12.1
N/A
3.2
N/A
Natural disasters
Type
East Seattle
Northwest Clackamas
Tornado activity compared to U.S. average
5.5%
8.1%
Earthquake activity compared to U.S. average
1,403%
1,566.4%
Natural disasters compared to U.S. average
30%
13%
Transport
Type
East Seattle
Northwest Clackamas
Amtrak stations nearby
3
3
Means of transportation to work
Type
East Seattle
Northwest Clackamas
Bicycle
0.3%
0.3%
Bus
5%
3.7%
Carpooled
11%
9.9%
Car alone
76.3%
78.2%
Motorcycle
0.1%
0.1%
Walked
1.7%
1.9%
Average travel time to work
Type
East Seattle
Northwest Clackamas
Average
25 min
24.1 min
Houses and residents
Type
East Seattle
Northwest Clackamas
Houses
199,933
91,607
Average household size (people)
2.5
2.5
Houses occupied
191,630 (95.8%)
86,783 (94.7%)
Houses occupied by owners
128,209 (66.9%)
59,419 (68.5%)
Houses occupied by renters
63,421 (33.1%)
27,364 (31.5%)
Median rent asked for vacant for-rent units
$2,281
$1,435
Median price asked for vacant for-sale houses and condos
$820,468
$610,128
Estimated median house or condo value
$877,325
$529,522
Median number of rooms in apartments
3.5
4.2
Median number of rooms in houses and condos
7.8
6.9
Housing density (houses/condos per square mile)
920.9
709.6
Household income disparities
34.9%
40.9%
Housing units without a mortgage
22,582 (20.8%)
10,555 (20.5%)
Housing units with both a second mortgage and home equity loan
352 (0.3%)
244 (0.5%)
Housing units with a mortgage
85,751 (79.2%)
41,052 (79.5%)
Housing units with a home equity loan
11,674 (10.8%)
6,561 (12.7%)
Housing units with a second mortgage
9,796 (9%)
6,242 (12.1%)
Housing units lacking complete kitchen facilities
0.8%
1%
Housing units lacking complete plumbing facilities
0.3%
0.3%
Housing units in structures
Housing units in structures
East Seattle
Northwest Clackamas
One, detached
60.2%
66.9%
One, attached
4.5%
2.5%
Two
1.0%
2.1%
3 or 4
3.8%
3.8%
5 to 9
7.4%
5.3%
10 to 19
7.6%
5.1%
20 to 49
5.8%
2.7%
50 or more
7.9%
6.3%
Mobile homes
1.8%
5.2%
Boats, RVs, vans, etc.
0.1%
0.1%
Median real estate property taxes paid for housing units
 East Seattle, WA
 Northwest Clackamas, OR