East San Gabriel Valley, CA, and St. Paul, MN, offer contrasting living experiences shaped by regional variants in climate, economy, cultural settings, and living costs. The Mediterranean climate in East San Gabriel Valley is heavily contrasted by the continental climate in St. Paul, accounting for the vast difference in outdoor activities and lifestyle. However, differences in crime, cost of living, and industry display varied opportunities in both regions. While St. Paul offers a more affordable lifestyle, East San Gabriel Valley hosts more robust real estate and a prosperous job market.
In terms of crime and safety, both areas have relatively moderate crime rates. East San Gabriel Valley is generally considered safe, with a lower crime rate than the national average. However, St. Paul has a higher crime rate compared to other cities its size. While both offer diverse and close-knit communities, residents in St. Paul may need to consider neighborhood safety when making relocation decisions.
Cost of Living
The cost of living in East San Gabriel Valley is significantly higher than St. Paul and the national average. St. Paul residents enjoy a lower cost of living, including more affordable housing and goods and services, which is definitely a plus for families considering relocation.
Income Tax
Both California and Minnesota have a progressive income tax system, but California's highest rate is notably higher than Minnesota's. Therefore, high earners might find it more costly to live in East San Gabriel Valley.
Property Tax
St. Paul's property tax rate is somewhat lower than that of East San Gabriel Valley. Given the high real estate prices in California, this could mean significantly higher property tax payments for homeowners in East San Gabriel Valley.
Sales Tax
In terms of sales tax, California's combined state and local sales tax rate is higher than Minnesota's. Thus, goods and services tend to be more expensive in East San Gabriel Valley than in St. Paul.
Income
Type
East San Gabriel Valley
St. Paul
Estimated median household income
$95,242
$66,098
Estimated per capita income
$34,474
$36,313
Cost of living index (U.S. average is 100)
150.2
114.5
If you make $50,000 in St. Paul, you will have to make $65,590 in East San Gabriel Valley to maintain the same standard of living.
Geographical Conditions
East San Gabriel Valley is known for its hilly topography and close proximity to both beaches and mountains, it's a true delight for outdoor enthusiasts. St. Paul, on the other hand, is situated along the Mississippi River, offering beautiful waterfront views and a variety of water-based activities.
Geographical information
Type
East San Gabriel Valley
St. Paul
Land area
212.6 sq. miles
52.8 sq. miles
Population density
4,478.5 people per sq. mile
5,821.5 people per sq. mile
Relative area comparison
East San Gabriel Valley, CA St. Paul, MN
Education
Both regions prioritize education. The East San Gabriel Valley has a host of public, private, and charter schools, with several colleges within commuting distance. In St. Paul, ongoing educational achievements are witnessed, with the region hosting over three-dozen colleges and universities.
The employment sectors are diverse in both areas but distinctly different due to regional characteristics. East San Gabriel Valley's economy is driven by sectors like technology, education, and health care. St. Paul, on the other hand, features an economy propelled by sectors such as manufacturing, retail, and professional services.
Biggest Employers
East San Gabriel Valley's biggest employers include technology firms and universities, including the California Institute of Technology and the Jet Propulsion Laboratory. In comparison, St. Paul's largest employers are primarily in the healthcare industry, such as Allina Health and HealthPartners, as well as retail companies like Ecolab.
In East San Gabriel Valley (Los Angeles County), 69.7% voted for Democrats and 27.8% for Republicans in 2012 Presidential Election. In St. Paul (Ramsey County), 66.6% voted for Democrats and 31.2% for Republicans.
Elections
Type
Democrats
Republicans
Other
Year
East San Gabriel Valley
St. Paul
East San Gabriel Valley
St. Paul
East San Gabriel Valley
St. Paul
2020
71.0%
71.8%
26.9%
26.3%
2.1%
1.9%
2016
72.0%
65.2%
22.5%
26.0%
5.5%
8.8%
2012
69.7%
66.6%
27.8%
31.2%
2.4%
2.2%
2008
69.2%
66.2%
28.8%
32.2%
1.9%
1.6%
2004
63.3%
63.5%
35.7%
35.9%
1.0%
0.7%
2000
63.6%
57.0%
32.4%
36.1%
4.0%
7.0%
1996
59.3%
58.7%
31.0%
29.3%
9.7%
12.0%
Breakdown of population affiliated with a religious congregation
Type
Adherents
Congregations
Religion
East San Gabriel Valley
St. Paul
East San Gabriel Valley
St. Paul
CATHOLIC CHURCH
36.1%
24.5%
4.7%
11.5%
SOUTHERN BAPTIST CONVENTION
1.0%
0.2%
9.0%
1.8%
MUSLIM ESTIMATE
0.7%
0.8%
1.0%
1.3%
AMERICAN BAPTIST CHURCHES IN THE USA
0.5%
0.7%
3.1%
3.4%
SEVENTH DAY ADVENTIST CHURCH
0.5%
0.1%
2.4%
1.6%
EPISCOPAL CHURCH
0.4%
1.1%
1.4%
3.2%
EVANGELICAL LUTHERAN CHURCH IN AMERICA
0.2%
7.8%
1.9%
14.2%
LUTHERAN CHURCH
0.2%
1.4%
1.6%
3.7%
SALVATION ARMY
0.1%
0.4%
0.4%
0.8%
WISCONSIN EVANGELICAL LUTHERAN SYNOD
0.0%
0.6%
0.1%
2.1%
Weather
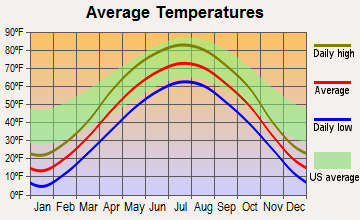
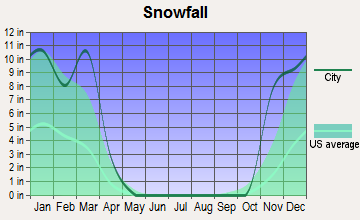
Weather differs significantly between the two regions. East San Gabriel Valley benefits from a mostly warm, Mediterranean Climate, making it ideal for outdoor activities throughout the year. Conversely, St. Paul experiences a continental climate with all four seasons, including cold, snowy winters and hot, humid summers.
Weather and climate
Type
East San Gabriel Valley
St. Paul
Temperature - Average
62.7°F
45.6°F
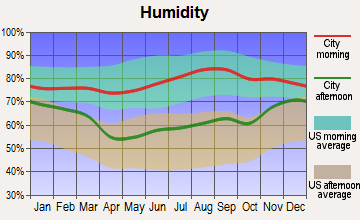
Humidity - Average morning or afternoon humidity
64.7%
74.9%
Humidity - Differences between morning and afternoon humidity
19.6%
33%
Humidity - Maximum monthly morning or afternoon humidity
70.7%
84%
Humidity - Minimum monthly morning or afternoon humidity
51%
51%
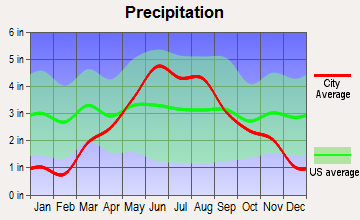
Precipitation - Yearly average
19.1 in
31.8 in
Snowfall - Yearly average
0 in
98.6 in
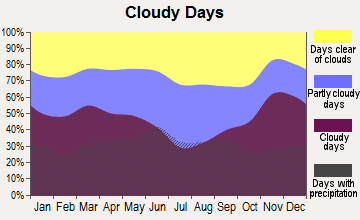
Clouds - Number of days clear of clouds
28.3%
15.8%
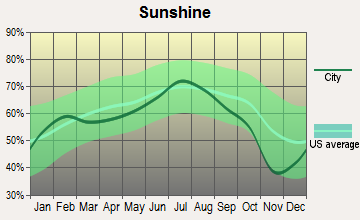
Sunshine amount - Average
78.4%
61.8%
Sunshine amount - Differences during a year
22%
37%
Sunshine amount - Maximum monthly
85%
74%
Sunshine amount - Minimum monthly
63%
37%
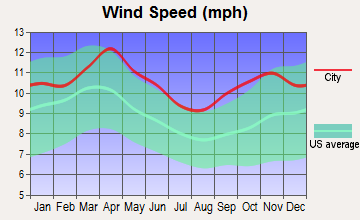
Wind speed - Average
3.7 mph
10.5 mph
Average climate in East San Gabriel Valley, California
Average climate in St. Paul, Minnesota
Air pollution
Type
AQI
CO
NO2
OZONE
PB
PM10
PM25
SO2
Year
East San Gabriel Valley
St. Paul
East San Gabriel Valley
St. Paul
East San Gabriel Valley
St. Paul
East San Gabriel Valley
St. Paul
East San Gabriel Valley
St. Paul
East San Gabriel Valley
St. Paul
East San Gabriel Valley
St. Paul
East San Gabriel Valley
St. Paul
2018
143
81
0.36
0.24
14.1
11.6
29.2
28.2
0.007
N/A
29.6
20.4
13.4
8.5
0.3
1.0
2017
150
71
0.35
0.26
14.8
11.9
30.5
27.9
0.007
N/A
32.7
19.5
12.6
7.5
0.3
1.2
2016
141
76
0.31
0.28
15.5
11.2
29.3
26.7
0.007
N/A
30.3
18.2
12.0
6.8
0.3
1.2
2015
145
80
0.30
0.28
15.2
12.4
30.4
27.8
0.007
N/A
30.0
21.3
14.6
7.5
0.2
1.0
2014
142
83
0.32
0.25
16.8
14.2
29.7
26.8
0.008
N/A
33.6
23.1
11.7
8.1
0.3
0.9
2013
147
81
0.33
N/A
17.0
11.6
27.7
32.1
0.007
N/A
31.5
22.6
11.5
7.2
0.4
0.9
2012
149
80
0.39
N/A
18.3
7.7
27.5
29.0
0.005
N/A
30.9
25.6
15.6
8.3
0.6
0.2
2011
149
90
0.40
0.22
18.6
7.8
26.7
30.1
0.008
N/A
30.3
25.4
17.3
10.0
0.5
0.3
2010
139
101
0.44
N/A
19.3
9.6
26.8
28.3
N/A
0.002
26.6
24.7
14.8
11.1
0.4
0.5
2009
156
103
0.40
N/A
21.0
7.4
28.0
N/A
0.010
0.002
26.0
21.4
16.5
11.0
0.6
1.1
2008
156
92
0.48
N/A
22.7
8.8
27.7
N/A
0.012
0.004
27.0
18.3
15.1
11.0
1.0
1.0
2007
135
102
0.52
N/A
25.3
9.2
24.8
N/A
0.014
0.004
N/A
21.6
N/A
11.4
1.3
0.6
2006
128
88
0.55
N/A
25.1
9.5
24.0
N/A
0.009
0.007
N/A
20.5
N/A
10.4
1.9
1.2
2005
127
107
0.59
N/A
25.7
12.3
22.8
N/A
0.014
0.004
N/A
22.0
N/A
12.1
1.9
1.5
2004
132
103
0.68
N/A
25.4
11.0
24.6
N/A
0.016
0.004
N/A
23.9
N/A
11.9
1.7
2.3
2003
137
114
0.80
N/A
29.9
12.5
24.7
N/A
0.021
0.004
N/A
25.9
N/A
13.0
1.4
2.2
2002
134
95
0.83
0.42
31.4
15.7
23.1
N/A
0.021
0.006
N/A
N/A
N/A
11.1
2.0
1.1
2001
141
82
1.00
0.75
31.8
17.5
21.4
32.4
0.029
0.011
N/A
N/A
N/A
9.3
2.1
1.1
2000
150
68
1.05
0.75
34.7
16.6
20.7
31.2
0.027
0.009
N/A
N/A
N/A
N/A
2.0
1.4
Natural disasters
Type
East San Gabriel Valley
St. Paul
Tornado activity compared to U.S. average
18.5%
129.5%
Earthquake activity compared to U.S. average
7,292.4%
43.1%
Natural disasters compared to U.S. average
57%
18%
Transportation
East San Gabriel Valley, close to Los Angeles, provides extensive freeway systems while St. Paul has a well-developed public transportation network, including an efficient bus system and light rail transit connecting it to Minneapolis.
Transport
Type
East San Gabriel Valley
St. Paul
Amtrak stations
0
1
Amtrak stations nearby
3
1
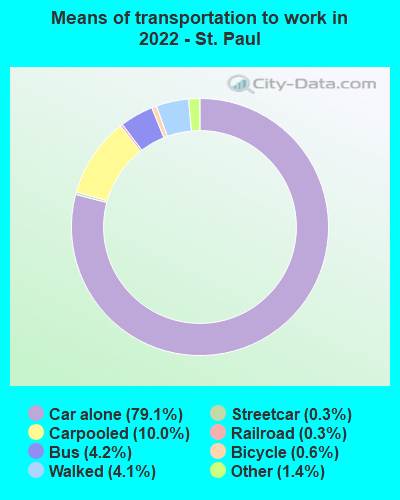
Means of transportation to work
Type
East San Gabriel Valley
St. Paul
Bicycle
0.6%
1%
Bus
2.9%
4.4%
Carpooled
17.1%
9.4%
Car alone
73.3%
79.9%
Motorcycle
0.2%
0.1%
Railroad
0.6%
0.2%
Taxicab
0%
0.2%
Walked
2.2%
3.7%
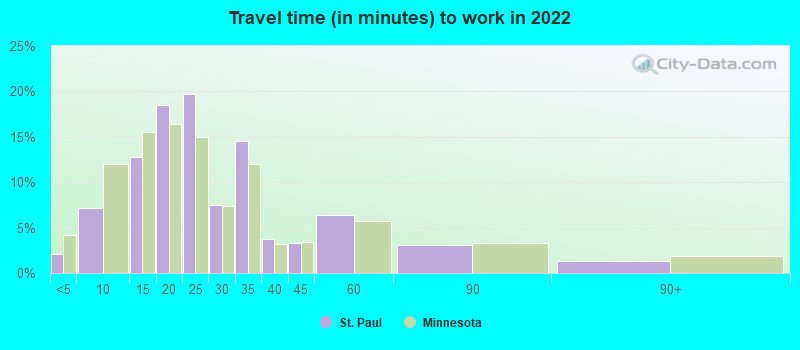
Average travel time to work
Type
East San Gabriel Valley
St. Paul
Average
32.3 min
25.8 min
Real Estate
Property in East San Gabriel Valley is noticeably more expensive than in St. Paul, with median home prices considerably higher than the national average. St. Paul's real estate market offers more affordable housing options, with a lower median home price.
Neighborhoods
East San Gabriel Valley consists of a collection of distinctive, often upscale communities with a suburban feel. St. Paul, in contrast, presents a diverse selection of neighborhoods with varied character, ranging from historic districts to revitalized industrial areas.
Houses and residents
Type
East San Gabriel Valley
St. Paul
Houses
270,240
131,275
Average household size (people)
3.5
2.5
Houses occupied
263,338 (97.4%)
121,964 (92.9%)
Houses occupied by owners
180,683 (68.6%)
67,642 (55.5%)
Houses occupied by renters
82,655 (31.4%)
54,322 (44.5%)
Median rent asked for vacant for-rent units
$1,935
$1,437
Median price asked for vacant for-sale houses and condos
$1,138,428
$431,254
Estimated median house or condo value
$643,048
$267,700
Median number of rooms in apartments
3.7
3.7
Median number of rooms in houses and condos
5.9
6.5
Renting percentage
32.3%
48.7%
Housing density (houses/condos per square mile)
1,270.8
2,487.8
Household income disparities
40.3%
44.1%
Housing units without a mortgage
26,635 (16.4%)
934 (1.9%)
Housing units with both a second mortgage and home equity loan
515 (0.3%)
3,112 (6.5%)
Housing units with a mortgage
136,243 (83.6%)
47,031 (98.1%)
Housing units with a home equity loan
11,429 (7%)
441 (0.9%)
Housing units with a second mortgage
21,150 (13%)
4,559 (9.5%)
Housing units lacking complete kitchen facilities
1%
1.2%
Housing units lacking complete plumbing facilities
Self-employed workers in own not incorporated business
25,753
6,217
State government workers
13,845
9,418
Unpaid family workers
1,494
0
Industries and Occupations
In East San Gabriel Valley, the larger industries include tech companies, healthcare facilities, and school systems. In contrast, St. Paul has a diverse economy with significant sectors being healthcare, retail trade, and professional and business services.
Both regions prioritize healthcare with multiple hospital systems to choose from. East San Gabriel Valley is within the vicinity of world-renowned hospitals like Wardman Medical Center, while St. Paul boasts access to numerous high-quality medical facilities, such as the Allina Health - United Hospital.
Health (county statistics)
Type
East San Gabriel Valley
St. Paul
General health status score of residents in this county from 1 (poor) to 5 (excellent)
Infrastructure in both regions is well developed, with both cities offering quality internet services, numerous parks, and public spaces. However, St. Paul has a more extensive public library system, while East San Gabriel Valley benefits from its proximity to major cultural and commercial hubs.
Infrastructure
Type
East San Gabriel Valley
St. Paul
TV stations
24
18
Culture and Food
Culturally, East San Gabriel Valley benefits from its proximity to Los Angeles, offering diverse culinary experiences and a range of entertainment options. St. Paul, being one-half of the Twin Cities, presents its own mix of arts, music, and a thriving food scene complete with tastes from a variety of cultural backgrounds.
Sports Teams
As for sports, residents of St. Paul can enjoy a wider variety of professional sports including the Minnesota Wild (NHL), the Minnesota Twins (MLB), and the Minnesota Vikings (NFL). East San Gabriel Valley does not have its own professional teams but is within a short drive of Los Angeles, home to several major sports teams.
 East San Gabriel Valley, CA
 St. Paul, MN