When considering relocation or a tourist visit to East San Gabriel Valley, California or Louisville, Kentucky, it's important to examine various aspects such as crime and safety, weather, education, and economy. This comparison provides an invaluable resource for understanding the nuances between these two locations.
Crime rates in East San Gabriel Valley are generally lower than in Louisville. San Gabriel Valley's commitment to public safety makes it an attractive choice for families and individuals. In contrast, Louisville has higher cases of violent crimes and property crimes, making personal safety a concern for residents and tourists alike.
Cost of Living
The cost of living in East San Gabriel Valley is significantly higher than in Louisville, owing to California's high property prices and living costs. Louisville, however, offers more budget-friendly living conditions, with lower utility costs, groceries, and housing prices.
Income Tax
California, where East San Gabriel Valley is located, has a progressive income tax rate, which can go up to 13.3%. Kentucky has a flat income tax rate of 5%.
Property Tax
Property tax in East San Gabriel Valley is around 0.76%, whereas in Louisville, it is 0.94% on average.
Sales Tax
In East San Gabriel Valley, sales tax can increase up to 10.25% compared to Louisville’s 6%. Lower sales tax often makes goods and services cheaper in Louisville.
Income
Type
East San Gabriel Valley
Louisville
Estimated median household income
$95,242
$44,270
Estimated per capita income
$34,474
$29,894
Cost of living index (U.S. average is 100)
150.2
94.1
If you make $50,000 in Louisville, you will have to make $79,809 in East San Gabriel Valley to maintain the same standard of living.
Geographical Conditions
East San Gabriel Valley is located in Southern California and blessed with diverse geographical conditions that includes mountains, valleys, and proximity to beaches. Louisville, located on the Ohio River, is flanked by rolling hills and has vibrant, green parklands.
Geographical information
Type
East San Gabriel Valley
Louisville
Land area
212.6 sq. miles
62.1 sq. miles
Population density
4,478.5 people per sq. mile
4,230.1 people per sq. mile
Relative area comparison
East San Gabriel Valley, CA Louisville, KY
Education
Both locations value education. San Gabriel Valley has a strong educational infrastructure with high-ranking public and private schools, and proximity to highly-rated universities like the California Institute of Technology. Louisville equally values education, and is home to the University of Louisville and many reputable public and private primary and secondary schools.
East San Gabriel Valley has a strong economy, supported by sectors like technology, healthcare, and education. Louisville's economy, on the other hand, is powered by a diverse mix of manufacturing, healthcare, and logistics sectors.
Biggest Employers
In East San Gabriel Valley, some of the biggest employers include Citrus Continental, School District, and City of Hope. Louisville's economy is propelled by the likes of UPS, Ford, and Norton Healthcare.
In East San Gabriel Valley (Los Angeles County), 69.7% voted for Democrats and 27.8% for Republicans in 2012 Presidential Election. In Louisville (Jefferson County), 55.0% voted for Democrats and 43.8% for Republicans.
Elections
Type
Democrats
Republicans
Other
Year
East San Gabriel Valley
Louisville
East San Gabriel Valley
Louisville
East San Gabriel Valley
Louisville
2020
71.0%
59.2%
26.9%
39.1%
2.1%
1.7%
2016
72.0%
54.1%
22.5%
40.8%
5.5%
5.2%
2012
69.7%
55.0%
27.8%
43.8%
2.4%
1.2%
2008
69.2%
55.6%
28.8%
43.5%
1.9%
0.9%
2004
63.3%
50.6%
35.7%
48.9%
1.0%
0.5%
2000
63.6%
49.8%
32.4%
48.2%
4.0%
2.0%
1996
59.3%
51.5%
31.0%
41.0%
9.7%
7.4%
Breakdown of population affiliated with a religious congregation
Type
Adherents
Congregations
Religion
East San Gabriel Valley
Louisville
East San Gabriel Valley
Louisville
CATHOLIC CHURCH
36.1%
16.3%
4.7%
8.5%
SOUTHERN BAPTIST CONVENTION
1.0%
14.3%
9.0%
25.0%
MUSLIM ESTIMATE
0.7%
0.9%
1.0%
1.4%
AMERICAN BAPTIST CHURCHES IN THE USA
0.5%
0.2%
3.1%
0.4%
SEVENTH DAY ADVENTIST CHURCH
0.5%
0.3%
2.4%
1.0%
EPISCOPAL CHURCH
0.4%
0.9%
1.4%
2.6%
EVANGELICAL LUTHERAN CHURCH IN AMERICA
0.2%
0.4%
1.9%
1.6%
Weather
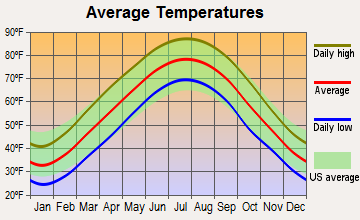
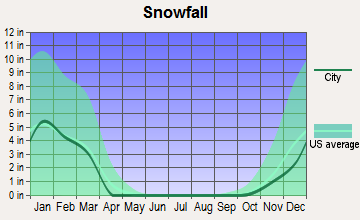
Weather-wise, East San Gabriel Valley boasts of a Mediterranean climate characterized by warm, dry summers and mild, wet winters, offering sunny, outdoor activities year-round. On the other hand, Louisville features a humid subtropical climate with hot, humid summers and moderately cold winters; it also experiences all four seasons distinctly.
Weather and climate
Type
East San Gabriel Valley
Louisville
Temperature - Average
62.7°F
56.9°F
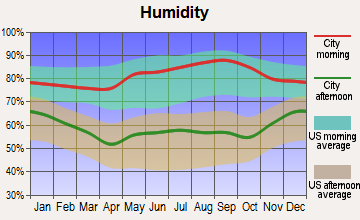
Humidity - Average morning or afternoon humidity
64.7%
73.6%
Humidity - Differences between morning and afternoon humidity
19.6%
35%
Humidity - Maximum monthly morning or afternoon humidity
70.7%
85%
Humidity - Minimum monthly morning or afternoon humidity
51%
50%
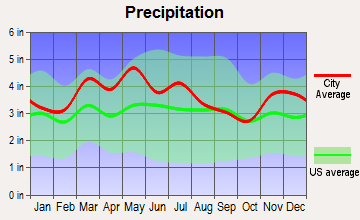
Precipitation - Yearly average
19.1 in
43.8 in
Snowfall - Yearly average
0 in
31.4 in
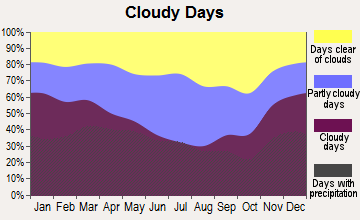
Clouds - Number of days clear of clouds
28.3%
15.5%
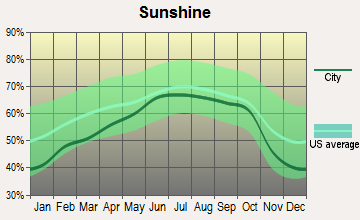
Sunshine amount - Average
78.4%
59.8%
Sunshine amount - Differences during a year
22%
25%
Sunshine amount - Maximum monthly
85%
66%
Sunshine amount - Minimum monthly
63%
41%
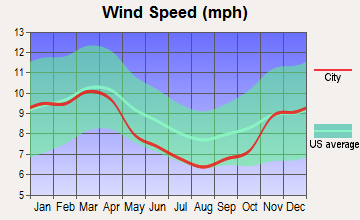
Wind speed - Average
3.7 mph
8.4 mph
Average climate in East San Gabriel Valley, California
Average climate in Louisville, Kentucky
Air pollution
Type
AQI
CO
NO2
OZONE
PB
PM10
PM25
SO2
Year
East San Gabriel Valley
Louisville
East San Gabriel Valley
Louisville
East San Gabriel Valley
Louisville
East San Gabriel Valley
Louisville
East San Gabriel Valley
East San Gabriel Valley
Louisville
East San Gabriel Valley
Louisville
East San Gabriel Valley
Louisville
2018
143
89
0.36
0.27
14.1
11.9
29.2
25.5
0.007
N/A
29.6
18.2
13.4
9.7
0.3
0.8
2017
150
77
0.35
0.27
14.8
12.2
30.5
26.5
0.007
N/A
32.7
17.3
12.6
9.2
0.3
0.6
2016
141
91
0.31
0.30
15.5
11.6
29.3
26.7
0.007
N/A
30.3
15.9
12.0
9.0
0.3
0.6
2015
145
92
0.30
0.31
15.2
12.3
30.4
25.4
0.007
N/A
30.0
17.4
14.6
10.7
0.2
1.0
2014
142
92
0.32
0.32
16.8
12.8
29.7
26.1
0.008
N/A
33.6
18.3
11.7
12.0
0.3
2.0
2013
147
83
0.33
N/A
17.0
N/A
27.7
27.8
0.007
N/A
31.5
16.9
11.5
12.0
0.4
2.1
2012
149
102
0.39
N/A
18.3
N/A
27.5
26.2
0.005
N/A
30.9
19.2
15.6
12.7
0.6
2.6
2011
149
111
0.40
N/A
18.6
N/A
26.7
26.9
0.008
N/A
30.3
19.7
17.3
13.3
0.5
3.1
2010
139
109
0.44
N/A
19.3
N/A
26.8
27.3
N/A
N/A
26.6
21.7
14.8
13.2
0.4
3.1
2009
156
90
0.40
N/A
21.0
13.6
28.0
27.5
0.010
N/A
26.0
18.9
16.5
13.4
0.6
3.1
2008
156
101
0.48
0.35
22.7
15.5
27.7
29.6
0.012
N/A
27.0
20.6
15.1
15.0
1.0
4.3
2007
135
111
0.52
0.44
25.3
15.9
24.8
32.0
0.014
N/A
N/A
24.0
N/A
14.8
1.3
5.9
2006
128
80
0.55
0.66
25.1
15.2
24.0
26.5
0.009
N/A
N/A
22.6
N/A
N/A
1.9
3.7
2005
127
86
0.59
0.39
25.7
16.9
22.8
27.4
0.014
N/A
N/A
24.6
N/A
N/A
1.9
4.1
2004
132
77
0.68
0.36
25.4
16.8
24.6
26.2
0.016
N/A
N/A
22.3
N/A
N/A
1.7
4.6
2003
137
83
0.80
0.46
29.9
17.9
24.7
24.6
0.021
N/A
N/A
24.0
N/A
N/A
1.4
5.0
2002
134
95
0.83
0.49
31.4
17.6
23.1
27.2
0.021
N/A
N/A
N/A
N/A
N/A
2.0
4.4
2001
141
95
1.00
0.56
31.8
18.2
21.4
28.3
0.029
N/A
N/A
N/A
N/A
N/A
2.1
5.6
2000
150
103
1.05
0.53
34.7
15.7
20.7
27.8
0.027
N/A
N/A
N/A
N/A
N/A
2.0
7.6
Natural disasters
Type
East San Gabriel Valley
Louisville
Tornado activity compared to U.S. average
18.5%
165.7%
Earthquake activity compared to U.S. average
7,292.4%
213%
Natural disasters compared to U.S. average
57%
17%
Transportation
East San Gabriel Valley boasts robust public transit options, including buses and railways, and commuting is often made easier due to its comprehensive road network. Louisville also has a decent public transit system, and while it’s true that personal vehicles are commonly used, cycling is promoted for commuting purposes as well.
Transport
Type
East San Gabriel Valley
Louisville
Amtrak stations nearby
3
1
FAA registered aircraft
0
655
FAA registered aircraft manufacturers and dealers
0
4
Means of transportation to work
Type
East San Gabriel Valley
Louisville
Bicycle
0.6%
0.4%
Bus
2.9%
6.7%
Carpooled
17.1%
12.6%
Car alone
73.3%
73.5%
Motorcycle
0.2%
0.1%
Railroad
0.6%
0%
Walked
2.2%
4.1%
Average travel time to work
Type
East San Gabriel Valley
Louisville
Average
32.3 min
21.1 min
Real Estate
The real estate market in East San Gabriel Valley is competitive, with high property values. In comparison, Louisville's real estate is more affordable, making it an attractive option for first-time home buyers.
Neighborhoods
East San Gabriel Valley offers affluent neighborhoods like Pasadena and Arcadia, ones that exude a family-friendly atmosphere. Louisville, however, provides a mix of urban and suburban neighborhoods such as the Highlands and Cherokee Triangle bustling with cultural activities.
Houses and residents
Type
East San Gabriel Valley
Louisville
Houses
270,240
121,107
Average household size (people)
3.5
2.2
Houses occupied
263,338 (97.4%)
111,354 (91.9%)
Houses occupied by owners
180,683 (68.6%)
58,481 (52.5%)
Houses occupied by renters
82,655 (31.4%)
52,873 (47.5%)
Median rent asked for vacant for-rent units
$1,935
$753.66
Median price asked for vacant for-sale houses and condos
$1,138,428
$198,186
Estimated median house or condo value
$643,048
$180,781
Median number of rooms in apartments
3.7
3.2
Median number of rooms in houses and condos
5.9
5.5
Housing density (houses/condos per square mile)
1,270.8
1,949.6
Household income disparities
40.3%
50.8%
Housing units without a mortgage
26,635 (16.4%)
19,560 (37%)
Housing units with both a second mortgage and home equity loan
515 (0.3%)
121 (0.2%)
Housing units with a mortgage
136,243 (83.6%)
33,359 (63%)
Housing units with a home equity loan
11,429 (7%)
4,661 (8.8%)
Housing units with a second mortgage
21,150 (13%)
4,100 (7.7%)
Housing units lacking complete kitchen facilities
1%
1.1%
Housing units lacking complete plumbing facilities
0.8%
0.9%
Housing units in structures
Housing units in structures
East San Gabriel Valley
Louisville
One, detached
68.5%
58.8%
One, attached
8.2%
1.8%
Two
1.0%
5.3%
3 or 4
3.9%
10.1%
5 to 9
3.0%
7.5%
10 to 19
2.4%
6.8%
20 to 49
2.8%
3.9%
50 or more
6.5%
5.5%
Mobile homes
3.6%
0.3%
Boats, RVs, vans, etc.
0.1%
0.0%
Median real estate property taxes paid for housing units
Self-employed workers in own not incorporated business
25,753
5,520
State government workers
13,845
5,067
Unpaid family workers
1,494
295
Industries and Occupations
The primary industries in East San Gabriel Valley are technology, education and healthcare. Professionally, many residents work in managerial, healthcare, and education roles. Louisville, however, is well-known for its manufacturing, logistics, and healthcare sectors, and many residents work in operational, healthcare, and educational roles.
Both places feature well-established health care systems. East San Gabriel Valley is home to world-class medical facilities like the City of Hope. Louisville is renowned for its health and medical sciences sector and centers of excellence like the Norton Healthcare.
Health (county statistics)
Type
East San Gabriel Valley
Louisville
General health status score of residents in this county from 1 (poor) to 5 (excellent)
Infrastructure in East San Gabriel Valley is modern and well-maintained, with a range of amenities available. Louisville's infrastructure, while relatively older, has seen significant improvements over time with modern advancements.
Infrastructure
Type
East San Gabriel Valley
Louisville
TV stations
24
14
Culture and Food
Both places offer a rich, distinctive cultural and food scene. East San Gabriel is renowned for its diverse food options, with its mix of Asian cuisines. Louisville's culinary scene is famed for its southern comfort food and its iconic Kentucky Derby-inspired Mint Julep.
Sports Teams
While East San Gabriel Valley doesn’t have its own professional sports teams, Los Angeles teams in NBA, MLB, and NFL are nearby. Louisville is home to the Louisville Bats (MiLB) and boasts of the renowned Kentucky Derby.
 East San Gabriel Valley, CA
 Louisville, KY