East San Gabriel Valley, California and Glendale, Arizona are two distinct regions with diverse offerings for both residents and tourists alike. These areas are contrasted by their climate, cost of living, education, infrastructure, industries, real-estate, transportation, taxes, culture, geography, and health care. East San Gabriel Valley is recognized as a part of the famous Los Angeles County, offering a blend of suburban living alongside the energetic Californian lifestyle. On the other hand, Glendale, AZ, located in the metropolitan area of Phoenix, is known for its affordability, sports scene and sunshine.
Both Glendale and East San Gabriel Valley have moderate crime rates, usually above the national average. However, this highly depends on the precise neighborhood. Glendale has a more diverse population, which influences crime patterns, while East San Gabriel Valley has its share of both safe and relatively unsafe neighborhoods. Tourists and potential residents are advised to research carefully to find a safe area.
Cost of Living
The cost of living in East San Gabriel Valley is significantly higher than Glendale, especially in terms of housing cost. The California lifestyle comes with a hefty price tag compared to the much more affordable Arizona city.
Income Tax
California, including East San Gabriel Valley, has high state income tax rates, with the top marginal rate being 13.3%. On the other hand, Arizona's top rate is much lower at 4.5%.
Property Tax
Property taxes in East San Gabriel Valley are also significantly higher than in Glendale, with rates around 1.16% compared to Arizona's average of 0.62%.
Sales Tax
The sales tax in East San Gabriel Valley is 9.5%, significantly higher compared to Glendale's 8.6%.
Income
Type
East San Gabriel Valley
Glendale
Estimated median household income
$95,242
$62,910
Estimated per capita income
$34,474
$28,898
Cost of living index (U.S. average is 100)
150.2
100.6
If you make $50,000 in Glendale, you will have to make $74,652 in East San Gabriel Valley to maintain the same standard of living.
Geographical Conditions
Geographically speaking, East San Gabriel Valley has more varied landscapes with hilly areas and close proximity to the beach. Glendale, AZ is mostly flat, with desert landscapes and is known for its beautiful sunsets.
Geographical information
Type
East San Gabriel Valley
Glendale
Land area
212.6 sq. miles
55.7 sq. miles
Population density
4,478.5 people per sq. mile
4,482.9 people per sq. mile
Relative area comparison
East San Gabriel Valley, CA Glendale, AZ
Education
East San Gabriel Valley boasts a number of high-ranking schools, both public and private. Glendale, however, offers more affordable education options, especially in terms of university education, with institutions like the University of Phoenix and Glendale Community College offering a variety of programs.
While both regions have a strong economy, East San Gabriel Valley benefits from being part of the diverse Los Angeles economy, with opportunities in entertainment, healthcare, and technology. Glendale primarily thrives on retail work, with manufacturing and healthcare also providing significant opportunities.
Biggest Employers
The biggest employers in East San Gabriel Valley are primarily hospitals, schools, and government bodies. In Glendale, the biggest employers include Banner Health System, the City of Glendale, and Glendale Unified School District.
In East San Gabriel Valley (Los Angeles County), 69.7% voted for Democrats and 27.8% for Republicans in 2012 Presidential Election. In Glendale (Maricopa County), 43.6% voted for Democrats and 54.3% for Republicans.
Elections
Type
Democrats
Republicans
Other
Year
East San Gabriel Valley
Glendale
East San Gabriel Valley
Glendale
East San Gabriel Valley
Glendale
2020
71.0%
50.2%
26.9%
48.0%
2.1%
1.8%
2016
72.0%
44.9%
22.5%
47.7%
5.5%
7.5%
2012
69.7%
43.6%
27.8%
54.3%
2.4%
2.1%
2008
69.2%
44.0%
28.8%
54.5%
1.9%
1.5%
2004
63.3%
42.4%
35.7%
57.0%
1.0%
0.6%
2000
63.6%
43.0%
32.4%
53.4%
4.0%
3.6%
1996
59.3%
44.5%
31.0%
47.2%
9.7%
8.2%
Breakdown of population affiliated with a religious congregation
Type
Adherents
Congregations
Religion
East San Gabriel Valley
Glendale
East San Gabriel Valley
Glendale
CATHOLIC CHURCH
36.1%
13.6%
4.7%
4.3%
SOUTHERN BAPTIST CONVENTION
1.0%
1.9%
9.0%
6.5%
MUSLIM ESTIMATE
0.7%
0.2%
1.0%
1.0%
AMERICAN BAPTIST CHURCHES IN THE USA
0.5%
0.2%
3.1%
0.6%
SEVENTH DAY ADVENTIST CHURCH
0.5%
0.4%
2.4%
2.0%
EPISCOPAL CHURCH
0.4%
0.3%
1.4%
1.3%
EVANGELICAL LUTHERAN CHURCH IN AMERICA
0.2%
0.8%
1.9%
2.0%
LUTHERAN CHURCH
0.2%
0.5%
1.6%
1.5%
VINEYARD USA
0.1%
0.3%
0.3%
0.6%
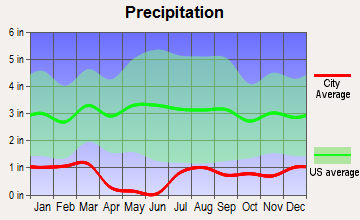
Weather
In terms of weather, Glendale, AZ experiences a desert climate, with scorching summers and mild winters – making it a haven for snowbirds. Alternatively, East San Gabriel Valley enjoys a Mediterranean climate with warm, dry summers, and mild, wet winters – providing a balance for those who enjoy a mix of seasons.
Weather and climate
Type
East San Gabriel Valley
Glendale
Temperature - Average
62.7°F
72.6°F
Humidity - Average morning or afternoon humidity
64.7%
37.5%
Humidity - Differences between morning and afternoon humidity
19.6%
48%
Humidity - Maximum monthly morning or afternoon humidity
70.7%
60%
Humidity - Minimum monthly morning or afternoon humidity
51%
12%
Precipitation - Yearly average
19.1 in
9 in
Snowfall - Yearly average
0 in
0 in
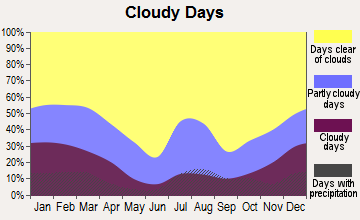
Clouds - Number of days clear of clouds
28.3%
35.3%
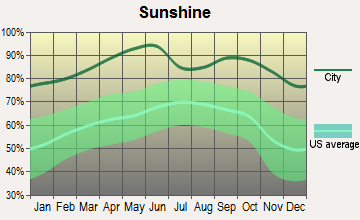
Sunshine amount - Average
78.4%
92.8%
Sunshine amount - Differences during a year
22%
16%
Sunshine amount - Maximum monthly
85%
95%
Sunshine amount - Minimum monthly
63%
79%
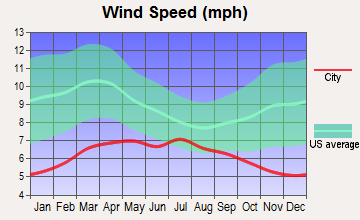
Wind speed - Average
3.7 mph
6.6 mph
Average climate in East San Gabriel Valley, California
Average climate in Glendale, Arizona
Air pollution
Type
AQI
CO
NO2
OZONE
PB
PM10
PM25
SO2
Year
East San Gabriel Valley
Glendale
East San Gabriel Valley
Glendale
East San Gabriel Valley
Glendale
East San Gabriel Valley
Glendale
East San Gabriel Valley
East San Gabriel Valley
Glendale
East San Gabriel Valley
Glendale
East San Gabriel Valley
Glendale
2018
143
155
0.36
0.38
14.1
15.3
29.2
29.7
0.007
N/A
29.6
24.1
13.4
7.4
0.3
0.6
2017
150
117
0.35
0.40
14.8
16.0
30.5
28.8
0.007
N/A
32.7
22.7
12.6
6.8
0.3
1.4
2016
141
114
0.31
0.39
15.5
15.6
29.3
29.7
0.007
N/A
30.3
22.5
12.0
6.8
0.3
0.4
2015
145
101
0.30
0.38
15.2
17.0
30.4
28.5
0.007
N/A
30.0
18.9
14.6
7.0
0.2
0.9
2014
142
116
0.32
0.38
16.8
19.0
29.7
29.5
0.008
N/A
33.6
28.0
11.7
7.8
0.3
1.1
2013
147
127
0.33
0.39
17.0
19.3
27.7
30.4
0.007
N/A
31.5
28.2
11.5
7.6
0.4
0.9
2012
149
125
0.39
0.33
18.3
20.6
27.5
29.7
0.005
N/A
30.9
34.7
15.6
8.8
0.6
1.3
2011
149
162
0.40
0.36
18.6
19.2
26.7
29.8
0.008
N/A
30.3
32.8
17.3
9.2
0.5
0.9
2010
139
100
0.44
0.38
19.3
18.9
26.8
28.2
N/A
N/A
26.6
23.3
14.8
8.3
0.4
1.0
2009
156
101
0.40
0.35
21.0
19.0
28.0
27.1
0.010
N/A
26.0
34.1
16.5
N/A
0.6
1.6
2008
156
106
0.48
0.41
22.7
20.3
27.7
27.6
0.012
N/A
27.0
37.8
15.1
N/A
1.0
2.1
2007
135
127
0.52
0.41
25.3
22.3
24.8
25.9
0.014
N/A
N/A
46.1
N/A
N/A
1.3
2.3
2006
128
127
0.55
0.46
25.1
24.4
24.0
26.8
0.009
N/A
N/A
49.1
N/A
N/A
1.9
2.2
2005
127
106
0.59
0.59
25.7
24.9
22.8
24.4
0.014
N/A
N/A
40.6
N/A
N/A
1.9
2.4
2004
132
96
0.68
0.61
25.4
24.6
24.6
23.7
0.016
N/A
N/A
31.3
N/A
N/A
1.7
1.4
2003
137
99
0.80
0.67
29.9
25.8
24.7
24.2
0.021
N/A
N/A
42.6
N/A
N/A
1.4
1.4
2002
134
106
0.83
0.78
31.4
27.3
23.1
25.0
0.021
N/A
N/A
41.8
N/A
N/A
2.0
1.6
2001
141
104
1.00
0.80
31.8
27.0
21.4
24.1
0.029
N/A
N/A
37.8
N/A
N/A
2.1
1.5
2000
150
118
1.05
0.85
34.7
29.3
20.7
23.9
0.027
N/A
N/A
45.6
N/A
N/A
2.0
1.7
Natural disasters
Type
East San Gabriel Valley
Glendale
Tornado activity compared to U.S. average
18.5%
17.5%
Earthquake activity compared to U.S. average
7,292.4%
2,698.7%
Natural disasters compared to U.S. average
57%
16%
Transportation
Transportation is more accessible in East San Gabriel Valley, due to its proximity to Los Angeles, offering numerous public transit options - the Metro Rail and bus systems. Glendale offers public bus services, but the city is more car-dependent for commuting.
Transport
Type
East San Gabriel Valley
Glendale
Amtrak stations nearby
3
3
FAA registered aircraft
0
212
FAA registered aircraft manufacturers and dealers
0
4
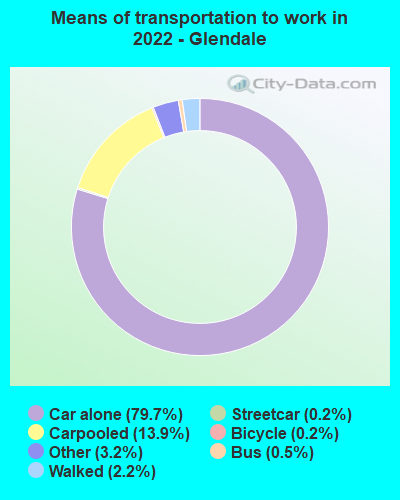
Means of transportation to work
Type
East San Gabriel Valley
Glendale
Bicycle
0.6%
0.5%
Bus
2.9%
0.7%
Carpooled
17.1%
10.6%
Car alone
73.3%
82.1%
Motorcycle
0.2%
0.4%
Railroad
0.6%
0.4%
Walked
2.2%
2.1%
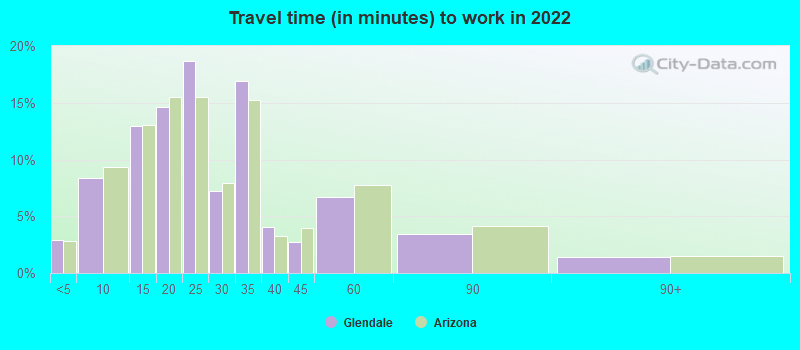
Average travel time to work
Type
East San Gabriel Valley
Glendale
Average
32.3 min
25.2 min
Real Estate
The real estate market in East San Gabriel Valley tends to be pricier, with a strong housing market with both traditional Tudor-style homes and condos. Glendale, AZ has a more affordable real estate market, with plenty of single-family homes available.
Neighborhoods
Both cities have family-friendly neighborhoods with easy access to amenities. However, the neighborhoods in East San Gabriel Valley tend to be more expensive due to the proximity to Los Angeles.
Houses and residents
Type
East San Gabriel Valley
Glendale
Houses
270,240
95,584
Average household size (people)
3.5
2.8
Houses occupied
263,338 (97.4%)
90,604 (94.8%)
Houses occupied by owners
180,683 (68.6%)
52,463 (57.9%)
Houses occupied by renters
82,655 (31.4%)
38,141 (42.1%)
Median rent asked for vacant for-rent units
$1,935
$1,437
Median price asked for vacant for-sale houses and condos
$1,138,428
$439,560
Estimated median house or condo value
$643,048
$325,400
Median number of rooms in apartments
3.7
4.2
Median number of rooms in houses and condos
5.9
6.2
Renting percentage
32.3%
41.4%
Housing density (houses/condos per square mile)
1,270.8
1,716.5
Household income disparities
40.3%
43%
Housing units without a mortgage
26,635 (16.4%)
971 (2.7%)
Housing units with both a second mortgage and home equity loan
515 (0.3%)
1,564 (4.3%)
Housing units with a mortgage
136,243 (83.6%)
35,213 (97.3%)
Housing units with a home equity loan
11,429 (7%)
294 (0.8%)
Housing units with a second mortgage
21,150 (13%)
2,964 (8.2%)
Housing units lacking complete kitchen facilities
1%
1.4%
Housing units lacking complete plumbing facilities
Self-employed workers in own not incorporated business
25,753
6,484
State government workers
13,845
4,087
Unpaid family workers
1,494
557
Industries and Occupations
East San Gabriel Valley, due to its location, houses workers from diverse industries including entertainment, technology, and healthcare. Glendale, on the other hand, is more focused on retail, aviation, and healthcare occupations.
Healthcare services in both regions are well developed with East San Gabriel Valley having the advantage due to the larger number of medical facilities available.
Health (county statistics)
Type
East San Gabriel Valley
Glendale
General health status score of residents in this county from 1 (poor) to 5 (excellent)
Infrastructure in both cities is developed. However, East San Gabriel Valley, being closer to the Los Angeles metropolitan area, benefits from a more developed and interconnected infrastructure system.
Infrastructure
Type
East San Gabriel Valley
Glendale
TV stations
24
16
Culture and Food
Culturally, East San Gabriel Valley offers a more diversified experience with a multicultural environment and cuisines. Glendale has a strong influence from Mexican cuisine, but offers various other food choices as well.
Sports Teams
Sports enthusiasts might lean more towards Glendale, which is home to the Arizona Cardinals NFL team and the Arizona Coyotes NHL team. The Rose Bowl, hosted annually in Pasadena, is also a huge draw in East San Gabriel Valley.
 East San Gabriel Valley, CA
 Glendale, AZ