East San Gabriel Valley and Fremont are both located in California but offer significantly different lifestyles. While East San Gabriel Valley is known for its authentically diverse culture, Fremont is appreciated for its strategic location in the heart of Silicon Valley. Quality of education, cost of living, and health care facilities are some of the key factors to consider while comparing these two cities for relocation or visit.
The crime rate in the East San Gabriel Valley area is higher than in Fremont. However, it varies significantly from one neighborhood to another. While property crimes are common, violent crimes are much less frequent. Fremont, on the other hand, is one of the safest large cities in the country. With a crime index lower than the national average, residents and visitors can enjoy a sense of security.
Cost of Living
Living in Fremont tends to be more expensive than in East San Gabriel Valley, especially when it comes to housing. The cost of groceries, health care, and utilities are also moderately higher in Fremont. Despite this, the high-income potential in Fremont, fueled by a thriving tech industry, can balance the scales.
Income Tax
Both locations are subject to California's progressive income tax system, which ranges from 1% to 13.3% depending on income level.
Property Tax
Both locations have similar property tax rates, aligning with the California average of approximately 0.74% of a property's assessed fair market value.
Sales Tax
Sales tax in both East San Gabriel Valley and Fremont typically follows the California state sales tax rate of 7.25%. However, local sales tax may increase the total rate slightly.
Income
Type
East San Gabriel Valley
Fremont
Estimated median household income
$95,242
$155,968
Estimated per capita income
$34,474
$64,320
Cost of living index (U.S. average is 100)
150.2
124.5
If you make $50,000 in Fremont, you will have to make $60,321 in East San Gabriel Valley to maintain the same standard of living.
Geographical Conditions
Fremont is characterized by its rolling hills and close proximity to the San Francisco Bay. East San Gabriel Valley is more inland, nestled against the San Gabriel Mountains, offering more variety in terms of landscapes.
Geographical information
Type
East San Gabriel Valley
Fremont
Land area
212.6 sq. miles
76.7 sq. miles
Population density
4,478.5 people per sq. mile
2,966.6 people per sq. mile
Relative area comparison
East San Gabriel Valley, CA Fremont, CA
Education
Both regions have a strong commitment to education. East San Gabriel Valley offers numerous public and private education options. Its community colleges are known for strong vocational programs. Fremont boasts highly rated schools, including some of the best in the state, and easy access to renowned institutions like Stanford University and University of California, Berkeley.
While Fremont's economy is heavily influenced by the tech industry and multinational corporations, East San Gabriel Valley's economy is more diverse, featuring healthcare, retail, and education sectors. This diversity provides more varied job opportunities in East San Gabriel Valley; however, jobs in Fremont generally offer higher salaries, especially in the tech sector.
Biggest Employers
Major employers in East San Gabriel Valley include City of Hope, Citrus Valley Health Partners, and Education Management Corporation. In Fremont, some of the biggest employers are Tesla, Lam Research, and Western Digital.
In East San Gabriel Valley (Los Angeles County), 69.7% voted for Democrats and 27.8% for Republicans in 2012 Presidential Election. In Fremont (Alameda County), 78.9% voted for Democrats and 18.2% for Republicans.
Elections
Type
Democrats
Republicans
Other
Year
East San Gabriel Valley
Fremont
East San Gabriel Valley
Fremont
East San Gabriel Valley
Fremont
2020
71.0%
79.8%
26.9%
17.6%
2.1%
2.6%
2016
72.0%
78.2%
22.5%
14.6%
5.5%
7.2%
2012
69.7%
78.9%
27.8%
18.2%
2.4%
3.0%
2008
69.2%
78.8%
28.8%
19.3%
1.9%
2.0%
2004
63.3%
75.5%
35.7%
23.4%
1.0%
1.1%
2000
63.6%
69.6%
32.4%
24.2%
4.0%
6.2%
1996
59.3%
65.8%
31.0%
23.1%
9.7%
11.2%
Breakdown of population affiliated with a religious congregation
Type
Adherents
Congregations
Religion
East San Gabriel Valley
Fremont
East San Gabriel Valley
Fremont
CATHOLIC CHURCH
36.1%
15.3%
4.7%
4.9%
SOUTHERN BAPTIST CONVENTION
1.0%
1.5%
9.0%
10.9%
MUSLIM ESTIMATE
0.7%
2.0%
1.0%
2.5%
AMERICAN BAPTIST CHURCHES IN THE USA
0.5%
0.5%
3.1%
2.5%
SEVENTH DAY ADVENTIST CHURCH
0.5%
0.3%
2.4%
1.4%
EPISCOPAL CHURCH
0.4%
0.3%
1.4%
1.7%
EVANGELICAL LUTHERAN CHURCH IN AMERICA
0.2%
0.3%
1.9%
2.3%
Weather
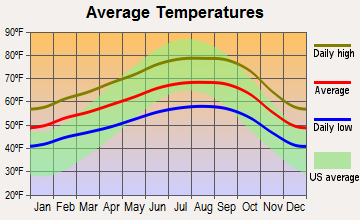
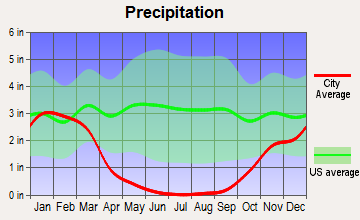
Both East San Gabriel Valley and Fremont experience Mediterranean climates. However, East San Gabriel Valley is generally warmer with less precipitation compared to Fremont. The weather in East San Gabriel Valley is fairly stable, with mild and dry winters. Fremont experiences more variations in temperature and more rainfall in winter months, which can be delightful for those who prefer cooler climates.
Weather and climate
Type
East San Gabriel Valley
Fremont
Temperature - Average
62.7°F
60°F
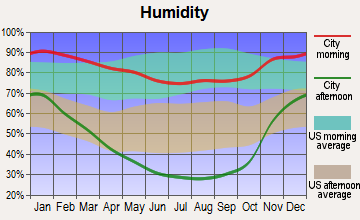
Humidity - Average morning or afternoon humidity
64.7%
81.4%
Humidity - Differences between morning and afternoon humidity
19.6%
29.9%
Humidity - Maximum monthly morning or afternoon humidity
70.7%
87.6%
Humidity - Minimum monthly morning or afternoon humidity
51%
57.7%
Precipitation - Yearly average
19.1 in
14.9 in
Snowfall - Yearly average
0 in
0 in
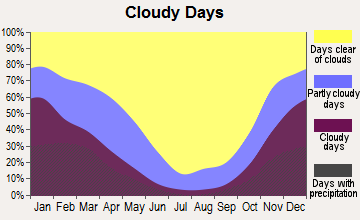
Clouds - Number of days clear of clouds
28.3%
27%
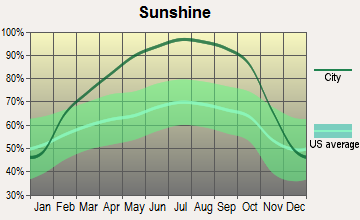
Sunshine amount - Average
78.4%
73.2%
Sunshine amount - Differences during a year
22%
22.3%
Sunshine amount - Maximum monthly
85%
77.1%
Sunshine amount - Minimum monthly
63%
54.8%
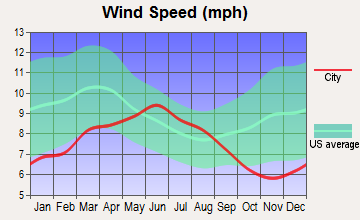
Wind speed - Average
3.7 mph
11 mph
Average climate in East San Gabriel Valley, California
Average climate in Fremont, California
Air pollution
Type
AQI
CO
NO2
OZONE
PB
PM10
PM25
SO2
Year
East San Gabriel Valley
Fremont
East San Gabriel Valley
Fremont
East San Gabriel Valley
Fremont
East San Gabriel Valley
Fremont
East San Gabriel Valley
Fremont
East San Gabriel Valley
East San Gabriel Valley
Fremont
East San Gabriel Valley
Fremont
2018
143
101
0.36
0.47
14.1
12.5
29.2
25.7
0.007
0.006
29.6
N/A
13.4
12.3
0.3
0.3
2017
150
101
0.35
0.45
14.8
11.9
30.5
25.0
0.007
0.004
32.7
N/A
12.6
9.8
0.3
0.3
2016
141
94
0.31
0.41
15.5
11.0
29.3
24.2
0.007
0.003
30.3
N/A
12.0
8.2
0.3
0.4
2015
145
96
0.30
0.45
15.2
12.5
30.4
24.1
0.007
0.004
30.0
N/A
14.6
8.4
0.2
0.4
2014
142
93
0.32
0.40
16.8
12.2
29.7
23.4
0.008
0.004
33.6
N/A
11.7
8.0
0.3
0.3
2013
147
98
0.33
0.41
17.0
12.3
27.7
21.7
0.007
0.004
31.5
N/A
11.5
10.4
0.4
0.4
2012
149
85
0.39
0.38
18.3
10.9
27.5
22.9
0.005
0.002
30.9
N/A
15.6
8.3
0.6
0.7
2011
149
93
0.40
0.39
18.6
12.0
26.7
22.7
0.008
0.002
30.3
N/A
17.3
10.0
0.5
0.7
2010
139
92
0.44
0.38
19.3
12.2
26.8
19.9
N/A
0.002
26.6
N/A
14.8
8.7
0.4
0.5
2009
156
98
0.40
0.38
21.0
13.0
28.0
20.3
0.010
0.004
26.0
N/A
16.5
9.6
0.6
0.6
2008
156
112
0.48
0.44
22.7
14.0
27.7
21.4
0.012
N/A
27.0
N/A
15.1
10.8
1.0
N/A
2007
135
102
0.52
0.44
25.3
14.2
24.8
20.7
0.014
0.007
N/A
N/A
N/A
9.8
1.3
N/A
2006
128
109
0.55
0.51
25.1
15.3
24.0
21.6
0.009
N/A
N/A
N/A
N/A
10.5
1.9
N/A
2005
127
104
0.59
0.46
25.7
15.4
22.8
19.7
0.014
N/A
N/A
N/A
N/A
11.5
1.9
N/A
2004
132
109
0.68
0.39
25.4
15.1
24.6
20.5
0.016
N/A
N/A
N/A
N/A
10.9
1.7
N/A
2003
137
90
0.80
0.44
29.9
17.0
24.7
21.3
0.021
N/A
N/A
N/A
N/A
N/A
1.4
N/A
2002
134
90
0.83
0.54
31.4
19.3
23.1
20.5
0.021
0.005
N/A
N/A
N/A
N/A
2.0
1.6
2001
141
87
1.00
0.54
31.8
19.4
21.4
19.6
0.029
0.005
N/A
N/A
N/A
N/A
2.1
N/A
2000
150
89
1.05
0.56
34.7
19.6
20.7
18.1
0.027
0.005
N/A
N/A
N/A
N/A
2.0
N/A
Natural disasters
Type
East San Gabriel Valley
Fremont
Tornado activity compared to U.S. average
18.5%
9.5%
Earthquake activity compared to U.S. average
7,292.4%
7,767.1%
Natural disasters compared to U.S. average
57%
20%
Transportation
Fremont has a robust public transportation system with buses, light rail, and a BART station providing easy access to the greater Bay Area. In contrast, East San Gabriel Valley is more car-dependent, despite having several bus lines and the Metro Gold Line light rail.
Transport
Type
East San Gabriel Valley
Fremont
Amtrak stations
0
1
Amtrak stations nearby
3
3
FAA registered aircraft
0
54
FAA registered aircraft manufacturers and dealers
0
2
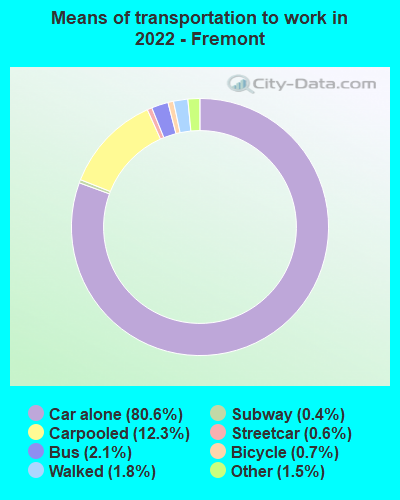
Means of transportation to work
Type
East San Gabriel Valley
Fremont
Bicycle
0.6%
1.5%
Bus
2.9%
3.6%
Carpooled
17.1%
11.2%
Car alone
73.3%
79.7%
Motorcycle
0.2%
0.3%
Railroad
0.6%
0.7%
Streetcar
0%
0.3%
Subway
0.1%
0.6%
Taxicab
0%
0.1%
Walked
2.2%
1%
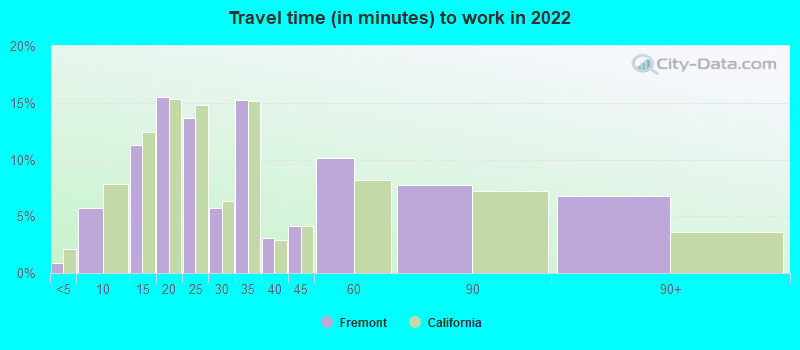
Average travel time to work
Type
East San Gabriel Valley
Fremont
Average
32.3 min
35.4 min
Real Estate
Real estate prices in both locations are high compared to the national average. However, prices in Fremont are significantly higher than those in East San Gabriel Valley due to its closer proximity to Silicon Valley and the Bay Area's thriving economy.
Neighborhoods
East San Gabriel Valley is known for its diverse neighborhoods and communities. It ranges from the affluent areas of San Marino and Arcadia to the cultural centers of Monterey Park and Alhambra. Fremont is subdivided into several districts, each with its unique character. Mission San Jose is known for its upscale homes, while Centerville offers charming, vintage homes close to shops and eateries.
Houses and residents
Type
East San Gabriel Valley
Fremont
Houses
270,240
79,480
Average household size (people)
3.5
3
Houses occupied
263,338 (97.4%)
75,716 (95.3%)
Houses occupied by owners
180,683 (68.6%)
46,436 (61.3%)
Houses occupied by renters
82,655 (31.4%)
29,280 (38.7%)
Median rent asked for vacant for-rent units
$1,935
$3,296
Median price asked for vacant for-sale houses and condos
$1,138,428
$1,442,729
Estimated median house or condo value
$643,048
Over $1,000,000
Median number of rooms in apartments
3.7
3.4
Median number of rooms in houses and condos
5.9
5.9
Renting percentage
32.3%
37.4%
Housing density (houses/condos per square mile)
1,270.8
1,036.4
Household income disparities
40.3%
33.8%
Housing units without a mortgage
26,635 (16.4%)
500 (1.5%)
Housing units with both a second mortgage and home equity loan
515 (0.3%)
2,014 (6.2%)
Housing units with a mortgage
136,243 (83.6%)
32,079 (98.5%)
Housing units with a home equity loan
11,429 (7%)
169 (0.5%)
Housing units with a second mortgage
21,150 (13%)
2,762 (8.5%)
Housing units lacking complete kitchen facilities
1%
1.3%
Housing units lacking complete plumbing facilities
Self-employed workers in own not incorporated business
25,753
5,630
State government workers
13,845
2,311
Unpaid family workers
1,494
0
Industries and Occupations
East San Gabriel Valley supports a wide array of industries from retail to healthcare. The job market in Fremont is predominantly dictated by its proximity to Silicon Valley, with a heavy emphasis on the tech industry. Many residents are employed in professional, scientific, and technical services.
Both locations offer excellent health care services with several top-rated hospitals. However, Fremont could have the upper hand as it is home to a number of specialized medical centers and high-ranking hospitals.
Health (county statistics)
Type
East San Gabriel Valley
Fremont
General health status score of residents in this county from 1 (poor) to 5 (excellent)
Both locations have well-established urban infrastructures. However, Fremont's proximity to the Bay Area provides it with an edge. It has greater access to high-speed internet, public utilities, and world-class urban amenities. San Gabriel Valley, while having good infrastructure, lacks the high-tech facilities of Fremont.
Infrastructure
Type
East San Gabriel Valley
Fremont
TV stations
24
24
Culture and Food
The East San Gabriel Valley is renowned for its rich array of multicultural cuisines, particularly Asian delicacies. Fremont also offers an array of eateries, especially Indian and Afghan cuisines reflective of its diverse population.
Sports Teams
East San Gabriel Valley does not have any major sports teams. Fremont residents, on the other hand, can root for nearby Bay Area teams such as the San Francisco 49ers, Oakland Athletics, or Golden State Warriors.
 East San Gabriel Valley, CA
 Fremont, CA