Comparing living in East San Gabriel Valley and Fontana, California reveals some important contrasts and resemblances in living conditions. Factors such as crime and safety, weather, cost of living, education, work and economy, infrastructure, biggest employers, and real estate vary between both locations, making each unique in its offerings. This comparison will provide you with all the required details to help you make a fruitful choice whether you're planning to relocate or just visiting.
Both East San Gabriel Valley and Fontana prioritize crime prevention and community safety. In comparison to Fontana, East San Gabriel Valley reports lower crime rates, making it a safer place for both residents and tourists. Fontana, while having higher crime rates, has been actively employing measures to curb criminal activities and improve safety. It's crucial to stay informed of respective neighborhood security precautions to ensure personal safety.
Cost of Living
The cost of living in East San Gabriel Valley is generally higher than in Fontana. This disparity is mainly due to housing prices, where East San Gabriel Valley properties often command higher prices. Groceries, health care, transportation, and other living costs are relatively similar in both regions, making them comparable for daily expenditure requirements.
Income Tax
The income tax in both cities is determined by California's progressive tax system, where higher income earners pay a higher tax rate. Whether you're in East San Gabriel Valley or Fontana, you'll be exposed to the same state income tax rates.
Property Tax
Property tax rates vary slightly between the two cities. East San Gabriel Valley generally has higher property taxes due to the high value of properties, while Fontana has lower property tax rates.
Sales Tax
Both East San Gabriel Valley and Fontana have similar sales tax rates. The combined city and state sales tax in these regions is relatively high compared to the national average, matching the overall tax rates common in California.
Income
Type
East San Gabriel Valley
Fontana
Estimated median household income
$95,242
$93,851
Estimated per capita income
$34,474
$28,677
Cost of living index (U.S. average is 100)
150.2
82.5
If you make $50,000 in Fontana, you will have to make $91,030 in East San Gabriel Valley to maintain the same standard of living.
Geographical Conditions
East San Gabriel Valley is nestled among picturesque hills, providing beautiful views and opportunities for outdoor activities. Fontana, meanwhile, has a more urbanized landscape, but is in close proximity to the San Bernardino Mountains for nature exploration.
Geographical information
Type
East San Gabriel Valley
Fontana
Land area
212.6 sq. miles
36.1 sq. miles
Population density
4,478.5 people per sq. mile
5,835.5 people per sq. mile
Relative area comparison
East San Gabriel Valley, CA Fontana, CA
Education
Educational facilities in both cities hold high standards. However, the East San Gabriel Valley has a higher concentration of top-rated public and private schools. The region is also near prestigious universities such as the California Institute of Technology and Pomona College. On the other hand, Fontana offers good quality public education with several community colleges around the area.
East San Gabriel Valley boasts a strong economy supported by sectors like health care and professional services. Fontana also has a robust economy focusing mainly on manufacturing and logistics due to its crucial geographic location along major transport routes. The availability of jobs in both cities is ample with similar average salaries.
Biggest Employers
The largest employers in East San Gabriel Valley are mainly universities and health care institutions. In contrast, Fontana's largest employers come from various sectors, including Fontana Unified School District, Kaiser Permanente, and Fontana City.
In East San Gabriel Valley (Los Angeles County), 69.7% voted for Democrats and 27.8% for Republicans in 2012 Presidential Election. In Fontana (San Bernardino County), 52.3% voted for Democrats and 45.0% for Republicans.
Elections
Type
Democrats
Republicans
Other
Year
East San Gabriel Valley
Fontana
East San Gabriel Valley
Fontana
East San Gabriel Valley
Fontana
2020
71.0%
54.2%
26.9%
43.6%
2.1%
2.2%
2016
72.0%
52.1%
22.5%
41.5%
5.5%
6.4%
2012
69.7%
52.3%
27.8%
45.0%
2.4%
2.6%
2008
69.2%
52.2%
28.8%
45.8%
1.9%
2.0%
2004
63.3%
43.8%
35.7%
55.6%
1.0%
0.6%
2000
63.6%
47.3%
32.4%
48.8%
4.0%
3.9%
1996
59.3%
44.4%
31.0%
43.6%
9.7%
12.1%
Breakdown of population affiliated with a religious congregation
Type
Adherents
Congregations
Religion
East San Gabriel Valley
Fontana
East San Gabriel Valley
Fontana
CATHOLIC CHURCH
36.1%
21.9%
4.7%
4.3%
SOUTHERN BAPTIST CONVENTION
1.0%
2.2%
9.0%
9.6%
MUSLIM ESTIMATE
0.7%
0.6%
1.0%
1.1%
AMERICAN BAPTIST CHURCHES IN THE USA
0.5%
0.3%
3.1%
1.6%
SEVENTH DAY ADVENTIST CHURCH
0.5%
1.6%
2.4%
4.6%
EPISCOPAL CHURCH
0.4%
0.1%
1.4%
1.3%
Weather
The weather conditions in both regions have minor differences. East San Gabriel Valley experiences mild winters and hot, dry summers. In contrast, Fontana experiences slightly hotter summers due to its geographical location. Both regions enjoy plenty of sunshine throughout the year, making them tourist-friendly for those seeking warm climates.
Weather and climate
Type
East San Gabriel Valley
Fontana
Temperature - Average
62.7°F
65.6°F
Humidity - Average morning or afternoon humidity
64.7%
65.7%
Humidity - Differences between morning and afternoon humidity
19.6%
20.4%
Humidity - Maximum monthly morning or afternoon humidity
70.7%
72%
Humidity - Minimum monthly morning or afternoon humidity
51%
51.6%
Precipitation - Yearly average
19.1 in
22.6 in
Snowfall - Yearly average
0 in
0 in
Clouds - Number of days clear of clouds
28.3%
27.5%
Sunshine amount - Average
78.4%
78.3%
Sunshine amount - Differences during a year
22%
21.7%
Sunshine amount - Maximum monthly
85%
84.5%
Sunshine amount - Minimum monthly
63%
62.8%
Wind speed - Average
3.7 mph
4.1 mph
Average climate in East San Gabriel Valley, California
Average climate in Fontana, California
Air pollution
Type
AQI
CO
NO2
OZONE
PB
PM10
PM25
SO2
Year
East San Gabriel Valley
Fontana
East San Gabriel Valley
Fontana
East San Gabriel Valley
Fontana
East San Gabriel Valley
Fontana
East San Gabriel Valley
Fontana
East San Gabriel Valley
Fontana
East San Gabriel Valley
Fontana
East San Gabriel Valley
Fontana
2018
143
153
0.36
0.32
14.1
18.3
29.2
30.5
0.007
0.006
29.6
40.7
13.4
14.0
0.3
0.4
2017
150
152
0.35
0.33
14.8
18.3
30.5
32.4
0.007
0.004
32.7
43.5
12.6
15.1
0.3
0.2
2016
141
140
0.31
0.20
15.5
18.2
29.3
31.8
0.007
0.006
30.3
39.6
12.0
14.8
0.3
0.4
2015
145
148
0.30
0.17
15.2
18.7
30.4
31.5
0.007
0.004
30.0
39.2
14.6
15.7
0.2
0.3
2014
142
149
0.32
0.16
16.8
19.9
29.7
31.1
0.008
0.006
33.6
41.8
11.7
16.7
0.3
0.3
2013
147
148
0.33
0.26
17.0
20.6
27.7
29.5
0.007
0.006
31.5
41.0
11.5
15.7
0.4
0.5
2012
149
148
0.39
0.26
18.3
22.1
27.5
30.6
0.005
0.007
30.9
40.4
15.6
17.3
0.6
0.6
2011
149
150
0.40
0.32
18.6
21.1
26.7
30.9
0.008
0.006
30.3
37.7
17.3
19.3
0.5
0.6
2010
139
147
0.44
0.32
19.3
23.2
26.8
30.4
N/A
0.008
26.6
33.3
14.8
18.1
0.4
1.0
2009
156
153
0.40
0.37
21.0
23.7
28.0
29.2
0.010
0.009
26.0
34.9
16.5
19.2
0.6
0.9
2008
156
163
0.48
0.44
22.7
20.4
27.7
29.7
0.012
0.010
27.0
39.3
15.1
19.0
1.0
1.6
2007
135
136
0.52
0.60
25.3
23.4
24.8
28.2
0.014
0.012
N/A
N/A
N/A
N/A
1.3
1.8
2006
128
126
0.55
0.59
25.1
27.0
24.0
27.7
0.009
0.007
N/A
N/A
N/A
N/A
1.9
1.9
2005
127
134
0.59
0.59
25.7
30.7
22.8
26.5
0.014
0.012
N/A
N/A
N/A
N/A
1.9
2.1
2004
132
143
0.68
0.71
25.4
27.0
24.6
28.1
0.016
0.013
N/A
N/A
N/A
N/A
1.7
1.0
2003
137
143
0.80
0.73
29.9
30.1
24.7
27.5
0.021
0.018
N/A
N/A
N/A
N/A
1.4
0.8
2002
134
140
0.83
0.73
31.4
33.3
23.1
27.2
0.021
0.016
N/A
N/A
N/A
N/A
2.0
1.3
2001
141
143
1.00
0.82
31.8
35.5
21.4
25.8
0.029
0.029
N/A
N/A
N/A
N/A
2.1
1.4
2000
150
155
1.05
0.86
34.7
35.7
20.7
24.5
0.027
0.034
N/A
N/A
N/A
N/A
2.0
2.0
Natural disasters
Type
East San Gabriel Valley
Fontana
Tornado activity compared to U.S. average
18.5%
17.1%
Earthquake activity compared to U.S. average
7,292.4%
7,438.3%
Natural disasters compared to U.S. average
57%
46%
Transportation
Transportation in both cities is relatively straightforward, with a solid network of highways and public transit options. East San Gabriel Valley is serviced by the Metro Rail and Metro Bus Lines, while Fontana has the Metrolink train service and Omnitrans bus service. Both cities have sufficient commuting options for residents and visitors.
Transport
Type
East San Gabriel Valley
Fontana
Amtrak stations nearby
3
3
FAA registered aircraft
0
36
FAA registered aircraft manufacturers and dealers
0
4
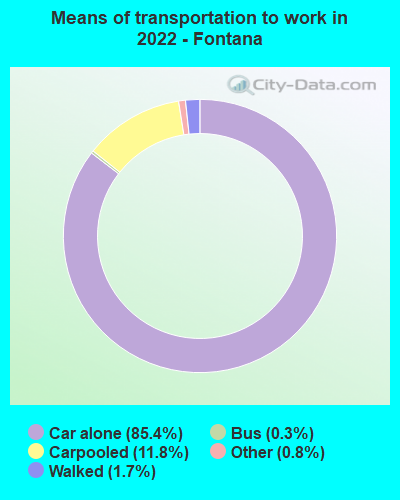
Means of transportation to work
Type
East San Gabriel Valley
Fontana
Bicycle
0.6%
0.2%
Bus
2.9%
0.4%
Carpooled
17.1%
11.7%
Car alone
73.3%
84.7%
Motorcycle
0.2%
0.1%
Railroad
0.6%
0%
Taxicab
0%
0.1%
Walked
2.2%
1.6%
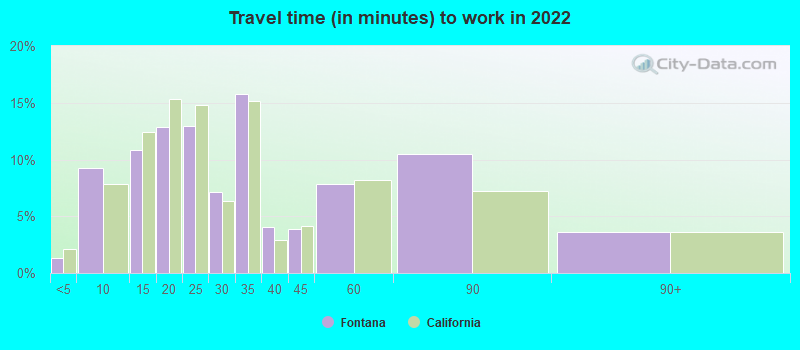
Average travel time to work
Type
East San Gabriel Valley
Fontana
Average
32.3 min
30.3 min
Real Estate
East San Gabriel Valley's real estate market is more expensive compared to Fontana. The housing options range from upscale single-family homes to affordable apartments in both locales, allowing for a variety of choices depending on individual preferences and budgets.
Neighborhoods
East San Gabriel Valley has a mix of urban and suburban neighborhoods, providing a diverse living environment. Fontana also offers various neighborhood types, from tight-knit suburban areas to more urbanized districts, each with its unique charm and character.
Houses and residents
Type
East San Gabriel Valley
Fontana
Houses
270,240
58,533
Average household size (people)
3.5
4
Houses occupied
263,338 (97.4%)
57,836 (98.8%)
Houses occupied by owners
180,683 (68.6%)
39,490 (68.3%)
Houses occupied by renters
82,655 (31.4%)
18,346 (31.7%)
Median rent asked for vacant for-rent units
$1,935
$628.91
Median price asked for vacant for-sale houses and condos
$1,138,428
$322,101
Estimated median house or condo value
$643,048
$511,000
Median number of rooms in apartments
3.7
4.3
Median number of rooms in houses and condos
5.9
6
Renting percentage
32.3%
31.1%
Housing density (houses/condos per square mile)
1,270.8
1,620.6
Household income disparities
40.3%
36.9%
Housing units without a mortgage
26,635 (16.4%)
356 (1.1%)
Housing units with both a second mortgage and home equity loan
515 (0.3%)
846 (2.6%)
Housing units with a mortgage
136,243 (83.6%)
32,565 (98.9%)
Housing units with a home equity loan
11,429 (7%)
0 (0%)
Housing units with a second mortgage
21,150 (13%)
1,037 (3.1%)
Housing units lacking complete kitchen facilities
1%
1.1%
Housing units lacking complete plumbing facilities
Self-employed workers in own not incorporated business
25,753
4,423
State government workers
13,845
5,298
Unpaid family workers
1,494
0
Industries and Occupations
Major industries in East San Gabriel Valley include health care, education, and professional services, while Fontana is characterized by its prominence in manufacturing, logistics, and retail. Both cities offer diverse employment opportunities. The occupational distribution is balanced between white-collar and blue-collar jobs in both locations.
Both East San Gabriel Valley and Fontana offer high-quality healthcare, with numerous hospitals, clinics, and specialty centers. Major healthcare providers in the regions include the Emanate Health Queen of the Valley Hospital in West Covina and the Kaiser Permanente Fontana Medical Center.
Health (county statistics)
Type
East San Gabriel Valley
Fontana
General health status score of residents in this county from 1 (poor) to 5 (excellent)
Both regions enjoy modern infrastructures. The East San Gabriel Valley is known for its beautiful boulevards and landscaped neighborhoods. Fontana, on the other hand, has seen significant infrastructure development over the years, particularly in civic and sporting facilities, including the Fontana Parks Department and the Auto Club Speedway.
Infrastructure
Type
East San Gabriel Valley
Fontana
TV stations
24
7
Culture and Food
As part of Greater Los Angeles, East San Gabriel Valley enjoys a rich cultural scene and diverse food options. Fontana also offers a lively culture with numerous entertainment venues and a plethora of dining options, including classic American and Mexican cuisine.
Sports Teams
Sports enthusiasts won't be disappointed in either city. While Fontana doesn't have any major sports teams, it is home to the Auto Club Speedway that hosts major racing events. East San Gabriel Valley residents also have easy access to Los Angeles's many professional sports teams.
 East San Gabriel Valley, CA
 Fontana, CA