East San Gabriel Valley, CA vs Colorado Springs, CO
When comparing East San Gabriel Valley, CA to Colorado Springs, CO, several factors need to be considered. These factors include crime/safety, weather, cost of living, education, work and economy, infrastructure, industries and occupations, biggest employers, real estate, neighborhoods, transportation/public transit/commuting, taxes, culture/food, sports teams, geographical conditions, and healthcare. Below is an overview of all these areas in both cities.
East San Gabriel Valley usually experiences a slightly higher crime rate than Colorado Springs. However, it varies by neighborhood, so specific area research is recommended. On the other hand, Colorado Springs tends to have lower crime rates, making it more appealing to those prioritizing safety. Both cities invest heavily in community policing to ensure security.
Cost of Living
The cost of living is notoriously high in California. Housing, necessities, and taxes are generally more expensive in East San Gabriel Valley than in Colorado Springs. In contrast, Colorado Springs offers an affordable cost of living, especially in terms of housing, when compared to many US cities.
Income Tax
California has a higher state income tax rate than Colorado. Individuals living in East San Gabriel Valley would pay more in state income tax compared to those living in Colorado Springs.
Property Tax
Property taxes are lower in Colorado Springs compared to East San Gabriel Valley. However, it's worth noting that the assessment for property taxes is different in each state.
Sales Tax
Sales tax is higher in East San Gabriel Valley, which is part of Los Angeles County, than in Colorado Springs, reflecting the general cost differences between California and Colorado.
Income
Type
East San Gabriel Valley
Colorado Springs
Estimated median household income
$95,242
$74,579
Estimated per capita income
$34,474
$39,808
Cost of living index (U.S. average is 100)
150.2
99.6
If you make $50,000 in Colorado Springs, you will have to make $75,402 in East San Gabriel Valley to maintain the same standard of living.
Geographical Conditions
Geographically, East San Gabriel Valley is characterized by a hilly terrain, while Colorado Springs is located near the base of one of the most famous American mountains, Pikes Peak, at the eastern edge of the Southern Rocky Mountains.
Geographical information
Type
East San Gabriel Valley
Colorado Springs
Land area
212.6 sq. miles
185.7 sq. miles
Population density
4,478.5 people per sq. mile
2,605.5 people per sq. mile
Relative area comparison
East San Gabriel Valley, CA Colorado Springs, CO
Education
Both regions host several highly ranked public and private schools and higher education institutions. East San Gabriel Valley is within reach of the many colleges and universities in Greater Los Angeles. Colorado Springs is home to well-reputed schools like the United States Air Force Academy and Colorado College.
Economically, both cities thrive. East San Gabriel Valley benefits from the booming economy of nearby Los Angeles. However, Colorado Springs has a robust economy too, mainly fueled by the defense and technology industries. Job growth is strong in both cities.
Biggest Employers
In East San Gabriel Valley, some of the largest employers include healthcare systems and school districts. Colorado Springs' biggest employers are in defense and aerospace, including the United States Air Force Academy and several high-tech companies.
In East San Gabriel Valley (Los Angeles County), 69.7% voted for Democrats and 27.8% for Republicans in 2012 Presidential Election. In Colorado Springs (El Paso County), 38.7% voted for Democrats and 59.2% for Republicans.
Elections
Type
Democrats
Republicans
Other
Year
East San Gabriel Valley
Colorado Springs
East San Gabriel Valley
Colorado Springs
East San Gabriel Valley
Colorado Springs
2020
71.0%
43.0%
26.9%
53.9%
2.1%
3.1%
2016
72.0%
34.1%
22.5%
56.6%
5.5%
9.4%
2012
69.7%
38.7%
27.8%
59.2%
2.4%
2.0%
2008
69.2%
40.0%
28.8%
58.9%
1.9%
1.1%
2004
63.3%
32.2%
35.7%
66.9%
1.0%
0.9%
2000
63.6%
30.9%
32.4%
64.1%
4.0%
5.0%
1996
59.3%
32.2%
31.0%
59.0%
9.7%
8.8%
Breakdown of population affiliated with a religious congregation
Type
Adherents
Congregations
Religion
East San Gabriel Valley
Colorado Springs
East San Gabriel Valley
Colorado Springs
CATHOLIC CHURCH
36.1%
8.4%
4.7%
5.4%
SOUTHERN BAPTIST CONVENTION
1.0%
2.6%
9.0%
11.3%
MUSLIM ESTIMATE
0.7%
0.0%
1.0%
0.2%
AMERICAN BAPTIST CHURCHES IN THE USA
0.5%
0.3%
3.1%
1.2%
SEVENTH DAY ADVENTIST CHURCH
0.5%
0.2%
2.4%
1.2%
EPISCOPAL CHURCH
0.4%
0.4%
1.4%
1.6%
EVANGELICAL LUTHERAN CHURCH IN AMERICA
0.2%
1.0%
1.9%
2.3%
LUTHERAN CHURCH
0.2%
0.7%
1.6%
1.9%
PRESBYTERIAN CHURCH IN AMERICA
0.0%
0.4%
0.6%
1.2%
Weather
Weather-wise, East San Gabriel Valley enjoys the typical Southern California weather – mild winters and hot summers with low humidity. In contrast, Colorado Springs experiences a range of weather patterns with cold, snowy winters and relatively warm summers. It also gets a good amount of sunny days which is appreciated by outdoor enthusiasts.
Weather and climate
Type
East San Gabriel Valley
Colorado Springs
Temperature - Average
62.7°F
43.4°F
Humidity - Average morning or afternoon humidity
64.7%
53.3%
Humidity - Differences between morning and afternoon humidity
19.6%
30%
Humidity - Maximum monthly morning or afternoon humidity
70.7%
64%
Humidity - Minimum monthly morning or afternoon humidity
51%
34%
Precipitation - Yearly average
19.1 in
18.6 in
Snowfall - Yearly average
0 in
77 in
Clouds - Number of days clear of clouds
28.3%
21.2%
Sunshine amount - Average
78.4%
82.2%
Sunshine amount - Differences during a year
22%
10.5%
Sunshine amount - Maximum monthly
85%
79.7%
Sunshine amount - Minimum monthly
63%
69.2%
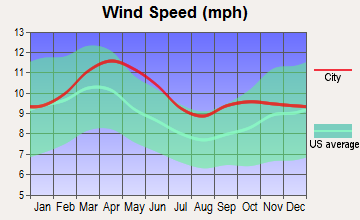
Wind speed - Average
3.7 mph
10.3 mph
Average climate in East San Gabriel Valley, California
Average climate in Colorado Springs, Colorado
Air pollution
Type
AQI
CO
NO2
OZONE
PB
PM10
PM25
SO2
Year
East San Gabriel Valley
Colorado Springs
East San Gabriel Valley
Colorado Springs
East San Gabriel Valley
Colorado Springs
East San Gabriel Valley
East San Gabriel Valley
Colorado Springs
East San Gabriel Valley
Colorado Springs
East San Gabriel Valley
Colorado Springs
East San Gabriel Valley
Colorado Springs
2018
143
60
0.36
N/A
14.1
N/A
29.2
N/A
0.007
N/A
29.6
N/A
13.4
6.3
0.3
N/A
2017
150
58
0.35
N/A
14.8
N/A
30.5
N/A
0.007
N/A
32.7
N/A
12.6
6.1
0.3
N/A
2016
141
48
0.31
N/A
15.5
N/A
29.3
N/A
0.007
N/A
30.3
N/A
12.0
6.9
0.3
N/A
2015
145
N/A
0.30
N/A
15.2
N/A
30.4
N/A
0.007
N/A
30.0
N/A
14.6
N/A
0.2
N/A
2014
142
N/A
0.32
N/A
16.8
N/A
29.7
N/A
0.008
N/A
33.6
N/A
11.7
N/A
0.3
N/A
2013
147
N/A
0.33
N/A
17.0
N/A
27.7
N/A
0.007
N/A
31.5
N/A
11.5
N/A
0.4
N/A
2012
149
N/A
0.39
N/A
18.3
N/A
27.5
N/A
0.005
N/A
30.9
N/A
15.6
N/A
0.6
N/A
2011
149
N/A
0.40
N/A
18.6
N/A
26.7
N/A
0.008
N/A
30.3
N/A
17.3
N/A
0.5
N/A
2010
139
N/A
0.44
N/A
19.3
N/A
26.8
N/A
N/A
N/A
26.6
N/A
14.8
N/A
0.4
N/A
2009
156
N/A
0.40
N/A
21.0
N/A
28.0
N/A
0.010
N/A
26.0
N/A
16.5
N/A
0.6
N/A
2008
156
N/A
0.48
N/A
22.7
N/A
27.7
N/A
0.012
N/A
27.0
N/A
15.1
N/A
1.0
N/A
2007
135
N/A
0.52
N/A
25.3
N/A
24.8
N/A
0.014
N/A
N/A
N/A
N/A
N/A
1.3
N/A
2006
128
15
0.55
0.50
25.1
N/A
24.0
N/A
0.009
0.005
N/A
N/A
N/A
N/A
1.9
N/A
2005
127
17
0.59
0.55
25.7
N/A
22.8
N/A
0.014
0.027
N/A
N/A
N/A
N/A
1.9
N/A
2004
132
17
0.68
0.56
25.4
N/A
24.6
N/A
0.016
0.010
N/A
N/A
N/A
N/A
1.7
N/A
2003
137
19
0.80
0.59
29.9
N/A
24.7
N/A
0.021
0.011
N/A
N/A
N/A
N/A
1.4
N/A
2002
134
24
0.83
0.66
31.4
N/A
23.1
N/A
0.021
0.010
N/A
N/A
N/A
N/A
2.0
N/A
2001
141
51
1.00
0.63
31.8
16.7
21.4
N/A
0.029
0.005
N/A
21.3
N/A
N/A
2.1
1.9
2000
150
78
1.05
0.58
34.7
22.5
20.7
N/A
0.027
0.010
N/A
21.0
N/A
N/A
2.0
2.3
Natural disasters
Type
East San Gabriel Valley
Colorado Springs
Tornado activity compared to U.S. average
18.5%
78.4%
Earthquake activity compared to U.S. average
7,292.4%
816.1%
Natural disasters compared to U.S. average
57%
17%
Transportation
Public transportation and commuting systems are comprehensive in both cities, with a range of options including buses, trains, and airports. However, East San Gabriel Valley benefits from its proximity to Los Angeles, offering extensive public transit facilities.
Transport
Type
East San Gabriel Valley
Colorado Springs
Amtrak stations
0
1
Amtrak stations nearby
3
1
FAA registered aircraft
0
552
FAA registered aircraft manufacturers and dealers
0
44
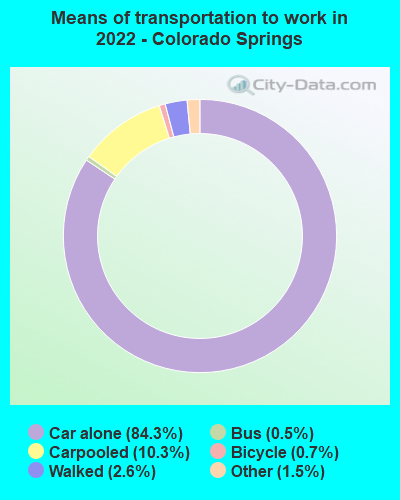
Means of transportation to work
Type
East San Gabriel Valley
Colorado Springs
Bicycle
0.6%
0.3%
Bus
2.9%
0.4%
Carpooled
17.1%
9.2%
Car alone
73.3%
87%
Motorcycle
0.2%
0.1%
Railroad
0.6%
0%
Taxicab
0%
0.1%
Walked
2.2%
2.1%
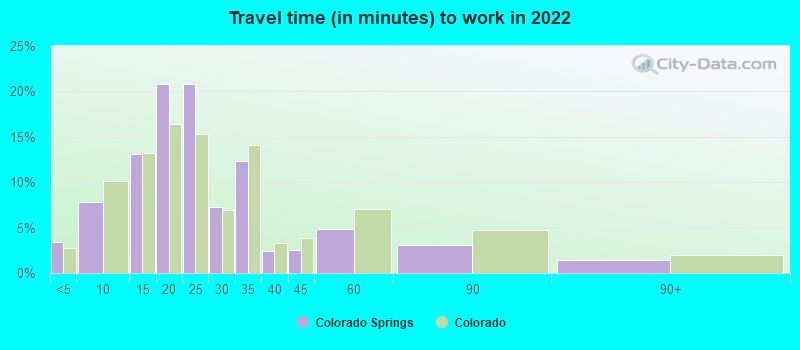
Average travel time to work
Type
East San Gabriel Valley
Colorado Springs
Average
32.3 min
23.8 min
Real Estate
Real estate differs greatly between the cities. Properties in East San Gabriel Valley are expensive, reflecting the overall cost of living in California. Colorado Springs, on the other hand, has reasonably priced real estate and a variety of housing options.
Neighborhoods
Both East San Gabriel Valley and Colorado Springs boast diverse neighborhoods, offering options from urban to suburban living. East San Gabriel Valley is well known for its cultural variety, while Colorado Springs offers a mix of historic and modern neighborhoods.
Houses and residents
Type
East San Gabriel Valley
Colorado Springs
Houses
270,240
205,380
Average household size (people)
3.5
2.4
Houses occupied
263,338 (97.4%)
197,542 (96.2%)
Houses occupied by owners
180,683 (68.6%)
123,398 (62.5%)
Houses occupied by renters
82,655 (31.4%)
74,144 (37.5%)
Median rent asked for vacant for-rent units
$1,935
$1,458
Median price asked for vacant for-sale houses and condos
$1,138,428
$595,239
Estimated median house or condo value
$643,048
$390,500
Median number of rooms in apartments
3.7
4.1
Median number of rooms in houses and condos
5.9
7.2
Renting percentage
32.3%
39.9%
Housing density (houses/condos per square mile)
1,270.8
1,105.7
Household income disparities
40.3%
41%
Housing units without a mortgage
26,635 (16.4%)
1,835 (2.1%)
Housing units with both a second mortgage and home equity loan
515 (0.3%)
6,564 (7.3%)
Housing units with a mortgage
136,243 (83.6%)
87,580 (97.9%)
Housing units with a home equity loan
11,429 (7%)
86 (0.1%)
Housing units with a second mortgage
21,150 (13%)
7,898 (8.8%)
Housing units lacking complete kitchen facilities
1%
0.6%
Housing units lacking complete plumbing facilities
Self-employed workers in own not incorporated business
25,753
13,110
State government workers
13,845
7,029
Unpaid family workers
1,494
735
Industries and Occupations
East San Gabriel Valley is diverse in terms of industries, with significant representation in healthcare, education, and trade. Colorado Springs is known for aerospace/defense, tourism, and high-tech manufacturing.
Both areas excel in healthcare, with numerous highly-ranked hospitals and medical facilities. However, the East San Gabriel Valley, being close to LA, offers more robust and diverse healthcare options.
Health (county statistics)
Type
East San Gabriel Valley
Colorado Springs
General health status score of residents in this county from 1 (poor) to 5 (excellent)
Infrastructure in both regions is well maintained and constantly improving. East San Gabriel Valley benefits from its proximity to Los Angeles and its facilities, while Colorado Springs is known for its well-planned city structure and ability to handle growth.
Infrastructure
Type
East San Gabriel Valley
Colorado Springs
TV stations
24
18
Culture and Food
Culturally rich, both East San Gabriel Valley and Colorado Springs offer a wide array of cuisine, arts, and music. East San Gabriel Valley boasts a culturally diverse food scene, largely influenced by its Asian-American community. Colorado Springs has an active arts scene and provides more traditional American comfort food.
Sports Teams
Sports lovers would be closer to major sports teams in East San Gabriel Valley, given its proximity to Los Angeles, while Colorado Springs hosts minor league teams and Olympic training facilities.
 East San Gabriel Valley, CA
 Colorado Springs, CO