The regional variances between East San Gabriel Valley, California, and Baton Rouge, Louisiana, range from their contrasting weather patterns to their unique cultural offerings. As both places offer something unique and enticing, the decision to relocate or visit either of these regions will largely depend on personal preferences and lifestyle choices. Here is a comparative analysis of key categories to aid in making an informed decision.
By national standards, Baton Rouge is above the average US crime rate, while East San Gabriel Valley's crime rate is similar to that of most California neighborhoods. East San Gabriel Valley provides a safer community with active and vigilant neighborhood watch groups. Baton Rouge has been implementing measures to reduce crime, but travelers and potential new residents should be aware of safety factors.
Cost of Living
Overall, the cost of living is higher in East San Gabriel Valley than in Baton Rouge. Housing is the primary factor that pushes this cost up, followed by transportation and healthcare. Baton Rouge is among the most affordable cities in the US, making it an attractive option for those looking to tighten their budgets.
Income Tax
California's income tax rates are considerably higher than Louisiana's, so individuals considering a move to East San Gabriel Valley must consider this. In comparison, Louisiana's lower rates may offer a significant benefit for those on a salary or fixed income.
Property Tax
Property tax rates in Baton Rouge, LA are higher than average for Louisiana but still lower than most places in the US. In contrast, California has relatively low property tax rates, though the higher home prices in East San Gabriel Valley can still make taxes hefty.
Sales Tax
Sales tax in Baton Rouge is higher, totaling 9.45% when counting city and state taxes. In contrast, the combined sales tax for the East San Gabriel Valley is typically 9.5%, just a hair above Baton Rouge's.
Income
Type
East San Gabriel Valley
Baton Rouge
Estimated median household income
$95,242
$41,257
Estimated per capita income
$34,474
$28,621
Cost of living index (U.S. average is 100)
150.2
90.2
If you make $50,000 in Baton Rouge, you will have to make $83,259 in East San Gabriel Valley to maintain the same standard of living.
Geographical Conditions
Geographically, East San Gabriel Valley is nestled between several mountains and forests, offering numerous outdoor activities. Baton Rouge, beside the Mississippi River, offers various water activities and is close to the Gulf of Mexico.
Geographical information
Type
East San Gabriel Valley
Baton Rouge
Land area
212.6 sq. miles
76.8 sq. miles
Population density
4,478.5 people per sq. mile
2,891.4 people per sq. mile
Relative area comparison
East San Gabriel Valley, CA Baton Rouge, LA
Education
Both areas take pride in their strong education systems. However, East San Gabriel Valley tends to have higher-rated public schools compared to Baton Rouge. It's also closer to numerous higher education institutions, including the renowned University of Southern California. Baton Rouge is not far behind, offering good public schools and housing Louisiana State University.
The job market in Baton Rouge centers around industries like petrochemicals, healthcare, and education. In contrast, the East San Gabriel Valley economy thrives on healthcare, education, retail trade, and the service industry. The latter tends to have a higher average income than Baton Rouge.
Biggest Employers
Baton Rouge's biggest employers range from the Louisiana State University to the ExxonMobil refinery. In the East San Gabriel Valley, major employers include the Citrus Valley Medical Center, Mt. San Antonio College, and Unified School Districts, offering a variety of job opportunities.
In East San Gabriel Valley (Los Angeles County), 69.7% voted for Democrats and 27.8% for Republicans in 2012 Presidential Election. In Baton Rouge (East Baton Rouge Parish), 52.0% voted for Democrats and 46.7% for Republicans.
Elections
Type
Democrats
Republicans
Other
Year
East San Gabriel Valley
Baton Rouge
East San Gabriel Valley
Baton Rouge
East San Gabriel Valley
Baton Rouge
2020
71.0%
55.8%
26.9%
42.7%
2.1%
1.5%
2016
72.0%
52.6%
22.5%
43.3%
5.5%
4.1%
2012
69.7%
52.0%
27.8%
46.7%
2.4%
1.3%
2008
69.2%
50.7%
28.8%
48.5%
1.9%
0.8%
2004
63.3%
45.0%
35.7%
54.7%
1.0%
0.3%
2000
63.6%
45.4%
32.4%
52.9%
4.0%
1.7%
1996
59.3%
74.9%
31.0%
22.4%
9.7%
2.7%
Breakdown of population affiliated with a religious congregation
Type
Adherents
Congregations
Religion
East San Gabriel Valley
Baton Rouge
East San Gabriel Valley
Baton Rouge
CATHOLIC CHURCH
36.1%
22.2%
4.7%
5.5%
SOUTHERN BAPTIST CONVENTION
1.0%
12.1%
9.0%
16.1%
MUSLIM ESTIMATE
0.7%
0.3%
1.0%
1.1%
AMERICAN BAPTIST CHURCHES IN THE USA
0.5%
0.5%
3.1%
0.5%
SEVENTH DAY ADVENTIST CHURCH
0.5%
0.3%
2.4%
1.1%
EPISCOPAL CHURCH
0.4%
1.3%
1.4%
2.1%
Weather
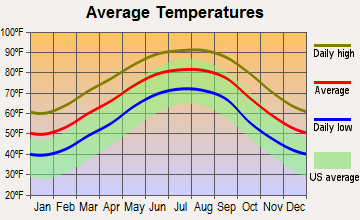
California's East San Gabriel Valley experiences a Mediterranean climate with mild, wet winters and hot, dry summers. Baton Rouge, on the other hand, provides a humid subtropical climate, causing hot and humid summers but mild and short winters. If outdoor activities are a priority for you, then Baton Rouge's year-round warm weather might appeal more.
Weather and climate
Type
East San Gabriel Valley
Baton Rouge
Temperature - Average
62.7°F
67°F
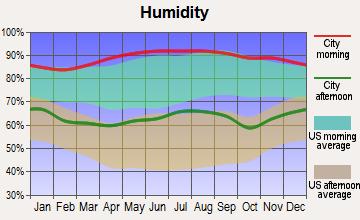
Humidity - Average morning or afternoon humidity
64.7%
80%
Humidity - Differences between morning and afternoon humidity
19.6%
39%
Humidity - Maximum monthly morning or afternoon humidity
70.7%
93%
Humidity - Minimum monthly morning or afternoon humidity
51%
54%
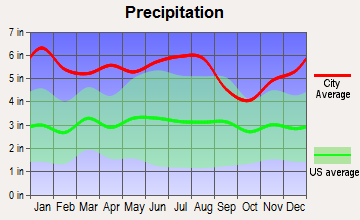
Precipitation - Yearly average
19.1 in
64.4 in
Snowfall - Yearly average
0 in
0.4 in
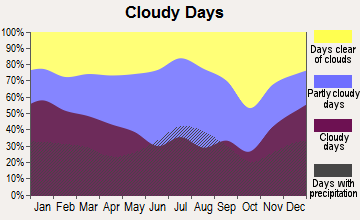
Clouds - Number of days clear of clouds
28.3%
16.5%
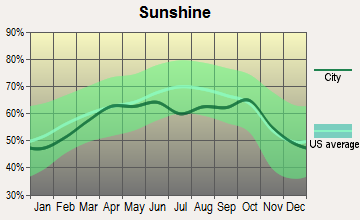
Sunshine amount - Average
78.4%
64.3%
Sunshine amount - Differences during a year
22%
22.5%
Sunshine amount - Maximum monthly
85%
70.4%
Sunshine amount - Minimum monthly
63%
47.9%
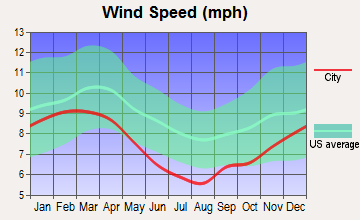
Wind speed - Average
3.7 mph
6.9 mph
Average climate in East San Gabriel Valley, California
Average climate in Baton Rouge, Louisiana
Air pollution
Type
AQI
CO
NO2
OZONE
PB
PM10
PM25
SO2
Year
East San Gabriel Valley
Baton Rouge
East San Gabriel Valley
Baton Rouge
East San Gabriel Valley
Baton Rouge
East San Gabriel Valley
Baton Rouge
East San Gabriel Valley
East San Gabriel Valley
Baton Rouge
East San Gabriel Valley
Baton Rouge
East San Gabriel Valley
Baton Rouge
2018
143
92
0.36
0.20
14.1
10.1
29.2
22.6
0.007
N/A
29.6
26.9
13.4
10.4
0.3
0.6
2017
150
82
0.35
0.21
14.8
10.2
30.5
25.3
0.007
N/A
32.7
22.5
12.6
10.3
0.3
0.4
2016
141
78
0.31
0.22
15.5
10.6
29.3
23.0
0.007
N/A
30.3
25.5
12.0
11.4
0.3
1.1
2015
145
97
0.30
0.22
15.2
9.4
30.4
24.1
0.007
N/A
30.0
26.2
14.6
12.1
0.2
1.1
2014
142
91
0.32
0.26
16.8
10.3
29.7
23.6
0.008
N/A
33.6
24.1
11.7
10.0
0.3
1.2
2013
147
90
0.33
0.20
17.0
9.7
27.7
24.2
0.007
N/A
31.5
23.1
11.5
10.0
0.4
0.6
2012
149
96
0.39
0.22
18.3
10.9
27.5
25.5
0.005
N/A
30.9
25.3
15.6
10.3
0.6
0.8
2011
149
104
0.40
0.22
18.6
11.4
26.7
25.8
0.008
N/A
30.3
33.2
17.3
12.6
0.5
1.3
2010
139
112
0.44
0.25
19.3
12.0
26.8
25.9
N/A
N/A
26.6
28.2
14.8
10.5
0.4
1.3
2009
156
97
0.40
0.22
21.0
11.7
28.0
23.0
0.010
N/A
26.0
26.1
16.5
9.2
0.6
1.9
2008
156
99
0.48
0.28
22.7
12.8
27.7
22.3
0.012
N/A
27.0
N/A
15.1
10.9
1.0
2.5
2007
135
115
0.52
0.38
25.3
14.3
24.8
23.0
0.014
N/A
N/A
N/A
N/A
12.2
1.3
2.6
2006
128
120
0.55
0.34
25.1
14.6
24.0
23.4
0.009
N/A
N/A
N/A
N/A
12.7
1.9
3.6
2005
127
122
0.59
0.41
25.7
15.5
22.8
24.7
0.014
N/A
N/A
N/A
N/A
13.1
1.9
4.4
2004
132
106
0.68
0.56
25.4
15.4
24.6
22.8
0.016
N/A
N/A
N/A
N/A
12.1
1.7
3.5
2003
137
124
0.80
0.66
29.9
16.0
24.7
21.5
0.021
N/A
N/A
N/A
N/A
11.0
1.4
3.4
2002
134
104
0.83
0.70
31.4
16.2
23.1
21.8
0.021
N/A
N/A
N/A
N/A
9.7
2.0
2.7
2001
141
109
1.00
0.82
31.8
16.6
21.4
23.5
0.029
N/A
N/A
N/A
N/A
9.6
2.1
3.7
2000
150
135
1.05
0.76
34.7
16.9
20.7
24.0
0.027
N/A
N/A
N/A
N/A
11.0
2.0
3.7
Natural disasters
Type
East San Gabriel Valley
Baton Rouge
Tornado activity compared to U.S. average
18.5%
167.3%
Earthquake activity compared to U.S. average
7,292.4%
54.9%
Natural disasters compared to U.S. average
57%
28%
Transportation
Public transportation and commuting are more comfortable and efficient in East San Gabriel Valley, thanks to LA's Metro and extensive bus services. Baton Rouge, mainly a driving city, offers a local bus service called Capital Area Transit System, but a vehicle may be necessary for most commuters.
Transport
Type
East San Gabriel Valley
Baton Rouge
Amtrak stations
0
1
Amtrak stations nearby
3
1
FAA registered aircraft
0
320
FAA registered aircraft manufacturers and dealers
0
10
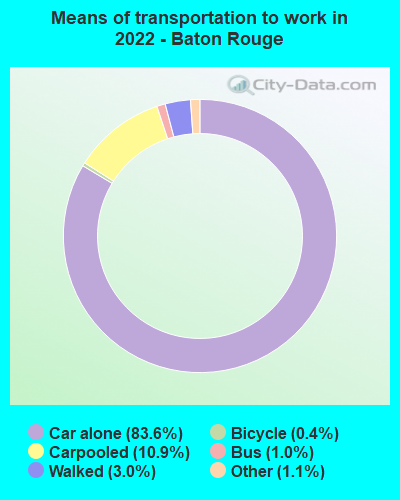
Means of transportation to work
Type
East San Gabriel Valley
Baton Rouge
Bicycle
0.6%
0.6%
Bus
2.9%
1.1%
Carpooled
17.1%
9.1%
Car alone
73.3%
87.9%
Motorcycle
0.2%
0.1%
Railroad
0.6%
0%
Walked
2.2%
0.7%
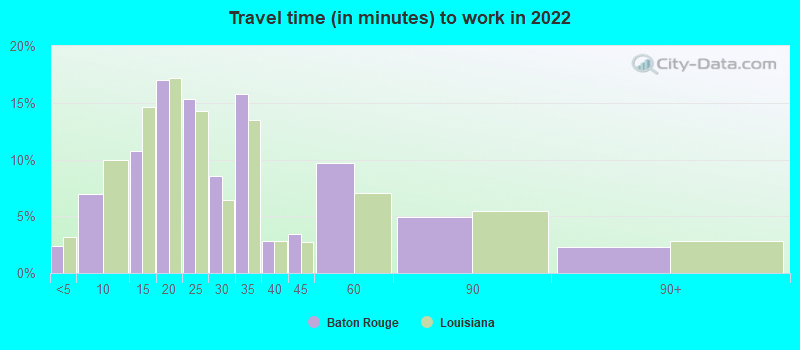
Average travel time to work
Type
East San Gabriel Valley
Baton Rouge
Average
32.3 min
30.9 min
Real Estate
Real estate costs in Baton Rouge are below the national average, making it an affordable place to live. In contrast, East San Gabriel Valley's real estate market is high, reflecting California’s overall market. Both areas offer a variety of housing options from condos to single-family homes.
Neighborhoods
Baton Rouge is known for its historic neighborhoods, such as the Garden District and Spanish Town with a mix of architectural styles. East San Gabriel Valley offers a variety of neighborhoods, each with its unique personality. From the close-knit community of Walnut to the bustling city of West Covina, there's something for everyone.
Houses and residents
Type
East San Gabriel Valley
Baton Rouge
Houses
270,240
107,002
Average household size (people)
3.5
2.4
Houses occupied
263,338 (97.4%)
87,440 (81.7%)
Houses occupied by owners
180,683 (68.6%)
41,267 (47.2%)
Houses occupied by renters
82,655 (31.4%)
46,173 (52.8%)
Median rent asked for vacant for-rent units
$1,935
$1,167
Median price asked for vacant for-sale houses and condos
$1,138,428
$351,611
Estimated median house or condo value
$643,048
$199,600
Median number of rooms in apartments
3.7
4
Median number of rooms in houses and condos
5.9
6.6
Renting percentage
32.3%
50.7%
Housing density (houses/condos per square mile)
1,270.8
1,392.5
Household income disparities
40.3%
52.9%
Housing units without a mortgage
26,635 (16.4%)
607 (2.5%)
Housing units with both a second mortgage and home equity loan
515 (0.3%)
1,424 (6%)
Housing units with a mortgage
136,243 (83.6%)
23,275 (97.5%)
Housing units with a home equity loan
11,429 (7%)
140 (0.6%)
Housing units with a second mortgage
21,150 (13%)
1,954 (8.2%)
Housing units lacking complete kitchen facilities
1%
6.1%
Housing units lacking complete plumbing facilities
Self-employed workers in own not incorporated business
25,753
5,415
State government workers
13,845
9,361
Unpaid family workers
1,494
351
Industries and Occupations
In Baton Rouge, the leading industries include petrochemicals, healthcare, and education. The city is renowned for manufacturing, construction, and public administration occupations. In East San Gabriel Valley, healthcare, education, retail trade, and professional services are top sectors. Here, executive, management, and healthcare are the most popular fields.
Both places have robust healthcare systems. Baton Rouge is home to several highly rated hospitals like the Baton Rouge General Medical Center. East San Gabriel Valley, with its proximity to Los Angeles, offers access to commendable healthcare services, including leading research hospitals like the City of Hope National Medical Center.
Health (county statistics)
Type
East San Gabriel Valley
Baton Rouge
General health status score of residents in this county from 1 (poor) to 5 (excellent)
Both places boast robust infrastructures but in different ways. Baton Rouge has a substantial, well-structured city grid, easy-to-reach amenities, and a major port. East San Gabriel Valley gets high marks for its public transport system, solid roadways, and quick access to the rest of the Los Angeles area.
Infrastructure
Type
East San Gabriel Valley
Baton Rouge
TV stations
24
16
Culture and Food
Both regions offer rich cultural scenes. Baton Rouge combines Southern charm with the vibrancy of a large university community, boasting a mixed culinary scene of Cajun and Creole cuisine, regular music festivals, and vibrant arts scene. East San Gabriel Valley is a cultural melting pot, offering cuisines from around the world, heritage festivals, and easy access to Los Angeles' rich cultural and arts scene.
Sports Teams
For sports enthusiasts, Baton Rouge is home to the LSU Tigers, while East San Gabriel Valley does not host any major sports teams but is incredibly close to Los Angeles, home to several professional sports teams like the Lakers and Dodgers.
 East San Gabriel Valley, CA
 Baton Rouge, LA