Detroit, Michigan, and Tulsa, Oklahoma are two distinct American cities with unique features, making them potential options for relocation or tourism. Detroit, once a thriving automobile production hub, is currently enjoying a regeneration phase despite the story of its economic decline and somewhat high crime rates. Tulsa, on the other hand, is a smaller city known for its relaxed lifestyle and strong basis in oil, gas, and aerospace industries. In both cities, you will find a reasonable cost of living compared to the national average and a rich cultural scene.
Distance between
Detroit, MI and
Tulsa, OK : 810.0 miles
Detroit's population is larger by 54%. Its population has decreased by 318,806 people (33.5%) since 2000. The population of Tulsa has grown by 18,352 people (4.7%) during that time.
Crime rates in Detroit have been historically high, although they have been gradually decreasing in recent years. The city still struggles with violent and property crime rates higher than the national average. On the other hand, Tulsa's crime rates are also higher than the national average but still significantly lower than Detroit's. Tulsa reports an average of 589 violent crimes per 100,000 people per year, compared to Detroit's 2,007.
Cost of Living
Comparatively, Tulsa offers a lower cost of living than Detroit. This includes aspects such as housing, groceries, transportation, and utilities. In Tulsa, the median home cost is around $126,700, quite lower than Detroit's $187,500. Overall, residents in Tulsa typically have more purchasing power than their counterparts in Detroit.
Income Tax
Detroit imposes a city income tax of 2.4% for residents and 1.2% for non-residents, in addition to the Michigan state income tax, which is a flat rate of 4.25%. In Tulsa, there's no city income tax, but the state of Oklahoma has a progressive income tax rate ranging from 0.5% to 5%.
Property Tax
In Detroit, the city's property tax ranges from 19 mills to 65 mills, depending on the property's classification and location. Tulsa’s average property tax rate is lower, with homeowners paying about 0.88% of their home value.
Sales Tax
The combined city and state sales tax rate in Detroit is 6%, all from the state as the city doesn't levy additional sales tax. Tulsa, however, has a combined city and state sales tax rate of 8.517%.
Income
Type
Detroit
Tulsa
Estimated median household income
$36,140
$51,008
Estimated per capita income
$22,122
$33,002
Cost of living index (U.S. average is 100)
94.1
86.5
If you make $50,000 in Tulsa, you will have to make $54,393 in Detroit to maintain the same standard of living.
Geographical Conditions
Detroit sits along the Detroit River, providing beautiful waterfront views. It's relatively flat, with minimal elevation changes. Conversely, Tulsa is located in the Green Country region of Oklahoma, known for its rolling green hills. The Arkansas River runs through the city, offering waterfront views and recreation.
Detroit Public Schools Community District serves Detroit, but its academic performance has historically been below average. However, there are top-ranking magnet schools like Renaissance High School and Bates Academy. Tulsa Public Schools, the largest school district in Oklahoma, serves Tulsa with high-ranking schools like Booker T. Washington High School. There are also several universities in both cities, such as Wayne State University in Detroit, and the University of Tulsa.
Detroit's economy, once dominated by auto manufacturing, experienced severe downturns but is showing signs of recovery. The city is diversifying into sectors like technology and health care. On the other hand, Tulsa's economy is stable, anchored by energy, aviation, telecommunications, and technology. Unemployment rates in both cities hover around the national average, but job growth is expected to be stronger in Tulsa.
Biggest Employers
In Detroit, major employers include the Detroit Medical Center, Quicken Loans, General Motors, and Ford Motor Company. In Tulsa, the healthcare and education sectors provide a large number of jobs, with major employers being Saint Francis Health System, Tulsa Public Schools, and American Airlines (Maintenance Base).
There were 10 building permits issued in Detroit in 2012 (8 less than in 2011) compared to 652 building permits issued in Tulsa in 2012 (333 more than in 2011).
In Detroit (Wayne County), 73.1% voted for Democrats and 26.2% for Republicans in 2012 Presidential Election. In Tulsa (Tulsa County), 36.3% voted for Democrats and 63.7% for Republicans.
Elections
Type
Democrats
Republicans
Other
Year
Detroit
Tulsa
Detroit
Tulsa
Detroit
Tulsa
2020
68.6%
40.9%
30.4%
56.5%
1.0%
2.7%
2016
66.6%
35.6%
29.4%
58.4%
4.0%
6.1%
2012
73.1%
36.3%
26.2%
63.7%
0.6%
0.0%
2008
74.4%
37.8%
24.7%
62.2%
0.9%
0.0%
2004
69.7%
35.6%
29.9%
64.4%
0.4%
0.0%
2000
69.1%
37.3%
29.1%
61.3%
1.8%
1.3%
1996
69.0%
37.1%
24.0%
53.6%
7.0%
9.3%
Breakdown of population affiliated with a religious congregation
Type
Adherents
Congregations
Religion
Detroit
Tulsa
Detroit
Tulsa
CATHOLIC CHURCH
16.3%
8.1%
11.2%
3.1%
MUSLIM ESTIMATE
3.7%
0.5%
2.9%
0.7%
AMERICAN BAPTIST CHURCHES IN THE USA
1.5%
0.3%
2.4%
0.5%
LUTHERAN CHURCH
1.2%
0.7%
3.9%
1.2%
EVANGELICAL LUTHERAN CHURCH IN AMERICA
0.7%
0.4%
2.8%
0.9%
EPISCOPAL CHURCH
0.4%
0.8%
2.5%
1.3%
SEVENTH DAY ADVENTIST CHURCH
0.4%
0.4%
1.4%
1.1%
SOUTHERN BAPTIST CONVENTION
0.4%
14.9%
3.2%
18.6%
EVANGELICAL PRESBYTERIAN CHURCH
0.3%
0.4%
0.3%
0.1%
NATIONAL ASSOCIATION FREE WILL BAPTISTS
0.1%
0.5%
1.2%
3.1%
INTERNA PENTECO HOLINESS CHURCH
0.0%
0.7%
0.1%
0.7%
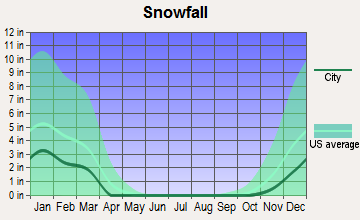
Weather
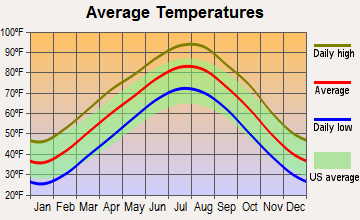
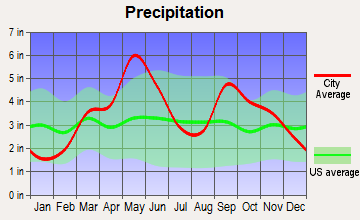
Detroit and Tulsa offer relatively distinct climates. Detroit experiences a Midwestern climate with hot summers and cold, snowy winters. It's not uncommon for temperatures to drop below freezing in the winter months. Conversely, Tulsa has a temperate humid subtropical climate, with hot, humid summers and mild, somewhat dry winters. Both cities experience roughly 35 inches of annual rainfall.
Weather and climate
Type
Detroit
Tulsa
Temperature - Average
50°F
60.4°F
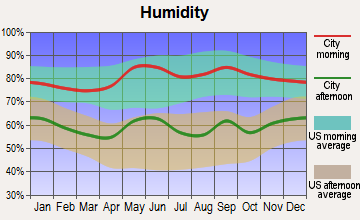
Humidity - Average morning or afternoon humidity
75.3%
73.8%
Humidity - Differences between morning and afternoon humidity
33%
33%
Humidity - Maximum monthly morning or afternoon humidity
86%
85%
Humidity - Minimum monthly morning or afternoon humidity
53%
52%
Precipitation - Yearly average
33.6 in
42.1 in
Snowfall - Yearly average
86.5 in
18.4 in
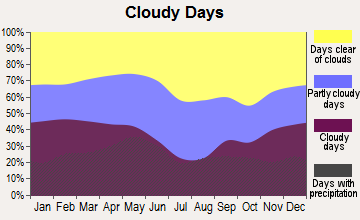
Clouds - Number of days clear of clouds
12.7%
21.1%
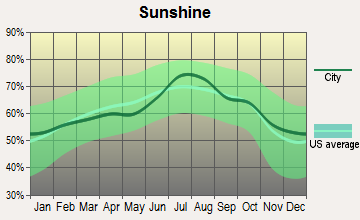
Sunshine amount - Average
56.8%
64.8%
Sunshine amount - Differences during a year
38%
24%
Sunshine amount - Maximum monthly
69%
74%
Sunshine amount - Minimum monthly
31%
50%
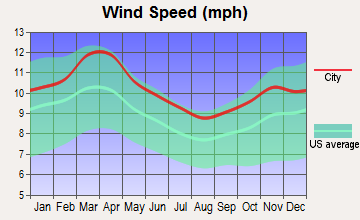
Wind speed - Average
10.2 mph
10.2 mph
Average climate in Detroit, Michigan
Average climate in Tulsa, Oklahoma
Air pollution
Type
AQI
CO
NO2
OZONE
PB
PM25
SO2
Year
Detroit
Tulsa
Detroit
Tulsa
Detroit
Tulsa
Detroit
Tulsa
Detroit
Tulsa
Detroit
Tulsa
Detroit
Tulsa
2018
90
88
0.44
0.24
12.9
N/A
25.8
28.6
N/A
0.004
10.1
11.6
1.1
0.4
2017
87
80
0.56
0.22
12.7
N/A
20.9
29.9
N/A
0.004
10.1
10.2
1.3
0.5
2016
86
86
0.47
0.24
13.2
N/A
22.0
29.1
N/A
0.005
10.9
9.5
0.8
0.5
2015
95
74
0.49
0.25
14.8
N/A
26.5
28.1
N/A
0.004
11.9
8.6
1.2
0.8
2014
95
74
0.48
0.16
14.2
N/A
24.2
29.2
N/A
0.005
12.0
9.2
1.7
0.3
2013
80
85
0.53
0.21
14.4
N/A
24.5
29.8
N/A
0.005
11.0
10.1
1.3
0.5
2012
99
103
0.49
0.21
14.6
N/A
25.7
32.4
N/A
0.007
6.6
11.7
1.7
0.7
2011
94
108
0.32
0.27
12.9
N/A
24.3
33.8
N/A
0.005
6.5
13.8
1.6
0.8
2010
96
83
0.28
0.26
11.8
N/A
24.7
30.1
0.006
0.004
12.1
12.2
1.6
0.7
2009
68
88
0.27
0.26
12.7
N/A
23.4
29.8
N/A
0.004
N/A
12.2
1.9
0.7
2008
67
71
0.27
N/A
12.8
N/A
N/A
26.7
N/A
0.007
N/A
N/A
2.0
N/A
2007
81
77
0.29
0.32
13.7
N/A
25.8
28.8
0.017
0.007
N/A
N/A
N/A
0.8
2006
63
95
0.31
N/A
14.0
N/A
19.8
32.9
0.022
N/A
N/A
N/A
3.2
N/A
2005
83
84
0.36
N/A
17.4
N/A
22.6
28.9
0.019
N/A
N/A
N/A
4.0
N/A
2004
70
71
0.43
N/A
15.0
N/A
N/A
27.5
0.014
N/A
N/A
N/A
3.7
N/A
2003
86
94
0.40
N/A
18.5
N/A
N/A
29.2
0.013
N/A
N/A
N/A
4.8
N/A
2002
88
85
0.36
0.83
18.3
7.8
N/A
27.7
0.019
N/A
N/A
N/A
4.3
N/A
2001
83
102
0.36
0.75
19.0
14.4
N/A
30.6
0.020
N/A
N/A
N/A
4.4
N/A
2000
71
101
0.35
0.69
18.2
15.3
N/A
28.9
0.027
N/A
N/A
N/A
5.2
N/A
Natural disasters
Type
Detroit
Tulsa
Tornado activity compared to U.S. average
128.5%
277.6%
Earthquake activity compared to U.S. average
53.2%
901.9%
Natural disasters compared to U.S. average
14%
34%
Transportation
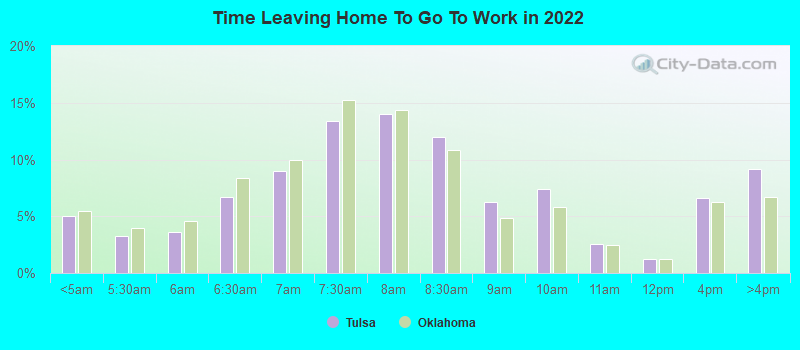
Detroit's public transit includes buses and the QLine streetcar system. Commute times are below the national average. Tulsa Transit provides bus service in Tulsa, but many residents rely on cars for commuting. Both cities have bike-share programs, but biking infrastructure is still developing.
Transport
Type
Detroit
Tulsa
Amtrak stations
1
1
Amtrak stations nearby
3
1
FAA registered aircraft
93
808
FAA registered aircraft manufacturers and dealers
3
35
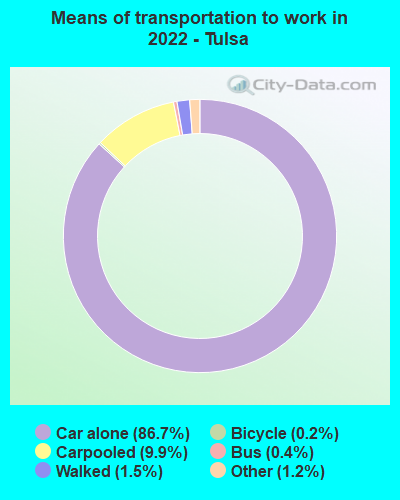
Means of transportation to work
Type
Detroit
Tulsa
Bicycle
0.5%
0.1%
Bus
4%
0.1%
Carpooled
7.5%
9%
Car alone
83.4%
87.9%
Motorcycle
0%
0.1%
Taxicab
0.5%
0.1%
Walked
2.7%
1.4%
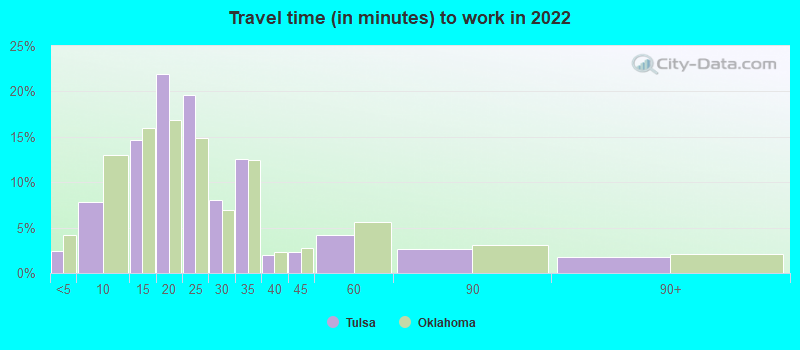
Average travel time to work
Type
Detroit
Tulsa
Average
30.6 min
23.8 min
Other means
26 min
19.2 min
Public transportation
47.7 min
40.1 min
Private vehicle occupancy
Type
Detroit
Tulsa
Average
1.2
1.2
Drove alone
87.1%
88.9%
In 2 person carpool
10.5%
8.7%
In 3 person carpool
1%
1.5%
In 4 person carpool
1%
0.3%
In 5-6 person carpool
0.3%
0.5%
In 7+ person carpool
0.2%
0.1%
How many people usually rode to work in the car, truck or van.
Real Estate
Real estate in Detroit is cheaper than the national average, with the median home price around $187,500. However, the market is volatile due to the city's economic situation. Conversely, Tulsa's real estate market is stable and affordable, with a median home price of $126,700.
Neighborhoods
Detroit is known for its variety of neighborhoods like Midtown, known for its cultural institutions, and Greektown, famous for its entertainment. Tulsa, on the other hand, boasts neighborhoods like Brookside, known for shopping and dining, and Cherry Street, an historic area with a thriving arts scene.
Houses and residents
Type
Detroit
Tulsa
Houses
322,906
194,402
Average household size (people)
2.6
2.3
Median year apartment built
1953
1975
Median year house/condo built
1946
1969
Length of stay in the house since moving in
16.7 years
12.9 years
Houses occupied
251,729 (78%)
173,943 (89.5%)
Houses occupied by owners
129,084 (51.3%)
89,307 (51.3%)
Houses occupied by renters
122,645 (48.7%)
84,636 (48.7%)
Median rent asked for vacant for-rent units
$798.06
$899.30
Median monthly housing costs
$755
$897
Median price asked for vacant for-sale houses and condos
$86,452
$163,212
Estimated median house or condo value
$69,300
$172,000
Median numbers of rooms
5.7
5.2
Median number of rooms in apartments
5
4.1
Median number of rooms in houses and condos
6.3
6.4
Median house price - detached houses
$96,752
$247,367
Median house price - in 2-unit structures
$72,631
$496,968
Median house price - in 3-to-4-unit structures
$183,952
$94,964
Median house price - in 5 or more unit structures
$242,851
$176,274
Median house price - mobile homes
$43,864
$73,235
Median house price - Townhouses or other attached units
$128,652
$184,309
Median house price - All housing units
$101,554
$241,263
Median house age
74
49
Renting percentage
48.9%
46.5%
Housing density (houses/condos per square mile)
2,326.9
1,064.4
House value disparities
48.4%
41.8%
Household income disparities
49.3%
48.1%
Median household income for houses/condes with a mortgage
$61,259
$84,820
Median household income for apartments without a mortgage
$38,901
$57,403
Housing units without a mortgage
2,599 (5.6%)
855 (1.7%)
Housing units with both a second mortgage and home equity loan
2,270 (4.9%)
2,464 (4.8%)
Housing units with a mortgage
43,675 (94.4%)
50,494 (98.3%)
Housing units with a home equity loan
357 (0.8%)
93 (0.2%)
Housing units with a second mortgage
3,466 (7.5%)
3,580 (7%)
House/condo owner moved in on average (years ago)
16
11
House/condo renter moved in on average (years ago)
4
1
Housing units lacking complete kitchen facilities
17.1%
2.9%
Housing units lacking complete plumbing facilities
13.6%
1.7%
Housing units in structures
Housing units in structures
Detroit
Tulsa
One, detached
66.0%
62.9%
One, attached
6.1%
2.8%
Two
6.5%
1.9%
3 or 4
2.7%
5.0%
5 to 9
2.2%
6.8%
10 to 19
2.7%
9.2%
20 to 49
3.9%
4.4%
50 or more
9.4%
5.8%
Mobile homes
0.5%
1.1%
Boats, RVs, vans, etc.
0.0%
0.2%
Median real estate property taxes paid for housing units
Self-employed workers in own not incorporated business
11,725
13,964
State government workers
8,763
5,897
Unpaid family workers
441
284
Industries and Occupations
Motor vehicle manufacturing historically dominated Detroit's industry, but today's labor force is diversified, with major sectors in healthcare, education, and public administration. By comparison, Tulsa's economy revolves around energy, aerospace, and manufacturing. Both cities have an increasing number of jobs in professional and business services.
Detroit is served by the Detroit Medical Center, Henry Ford Health System, and several other healthcare institutions. It has several nationally ranked hospitals. Meanwhile, Tulsa is home to several medical centers like the Saint Francis Hospital and the Tulsa Spine & Specialty Hospital.
Health (county statistics)
Type
Detroit
Tulsa
General health status score of residents in this county from 1 (poor) to 5 (excellent)
Detroit's infrastructure has suffered from the city's economic issues, but revitalization efforts are ongoing. Major highways, a busy international airport, and a public transit system are available. Tulsa's infrastructure is comparatively well-maintained. It also boasts an international airport, highways, and a public bus system. Both cities are investing in improving their infrastructure.
Infrastructure
Type
Detroit
Tulsa
Hospitals
41
45
TV stations
16
20
Arenas or stadiums
4
2
Bank branches located here
98
160
Bank institutions located here
12
40
Main business address for public companies
11
27
Drinking water stations with no reported violations in the past
5
0
Drinking water stations with reported violations in the past
HMDA - Conventional home purchase loans - Applications denied
Year
Detroit
Tulsa
1999
2,901
2,135
2000
4,079
1,531
2001
3,815
1,216
2002
3,247
1,106
2003
5,511
1,243
2004
9,068
1,354
2005
13,958
1,709
2006
16,654
1,756
2007
10,742
1,014
2008
2,823
517
2009
484
327
Culture and Food
Detroit boasts a variety of cultural experiences and a vibrant food scene, influenced by Middle-Eastern, Greek, and Caribbean cuisines. Its Motown and techno music roots make it a staple in American culture. Tulsa offers rich Native American and Western history with a culinary scene influenced by barbecue and Southern comfort food. Music-wise, it's known for a vibrant live music scene, particularly country and rock.
Sports Teams
Detroit is home to four major sports teams: The Detroit Lions (NFL), Detroit Pistons (NBA), Detroit Tigers (MLB), and Detroit Red Wings (NHL). Tulsa has no major league sports teams, but it has minor league and Division I college sports, with teams such as the Tulsa Drillers (Double-A baseball) and Tulsa Golden Hurricane (NCAA).


 Detroit, MI
 Tulsa, OK