Detroit, Michigan, and Raleigh, North Carolina, offer different experiences in various aspects. Detroit's history as a long-established city, mainly associated with the auto industry, contrasts with Raleigh's reputation as a thriving tech hub in the Research Triangle. Considering relocating or visiting these two cities will give a diverse perspective on American lifestyle and culture. Aspects such as crime and safety, cost of living, education, and economy will significantly impact one's experience and decision to stay.
Distance between
Detroit, MI and
Raleigh, NC : 512.7 miles
Detroit's population is larger by 35%. Its population has decreased by 318,806 people (33.5%) since 2000. The population of Raleigh has grown by 193,031 people (69.9%) during that time.
Detroit's high crime rates are often highlighted, over the years they have been declining, and ongoing initiatives aimed at making the city safer are underway. However, Raleigh's crime rates are significantly lower, making it overall a safer city for both residents and tourists. People relocating or visiting Raleigh can generally expect lower crime levels than in Detroit.
City-data.com crime index counts serious crimes and violent crime more heavily. It adjusts for the number of visitors and daily workers commuting into cities. (higher means more crime, U.S. average = 301.1)
City-data.com crime index counts serious crimes and violent crime more heavily. It adjusts for the number of visitors and daily workers commuting into cities. (higher means more crime, U.S. average = 301.1)
Sex Offenders
According to our data, there are 3,462 registered sex offenders living in Detroit and 2,186 registered sex offenders living in . The ratio of residents to sex offenders in Detroit is 194 to 1; the ratio in Raleigh is 210 to 1. The number of registered sex offenders compared to the number of residents in Detroit is near to than in Raleigh.
Cost of Living
The cost of living in Detroit is significantly lower than in Raleigh, largely due to the lower housing costs. Groceries, healthcare, and utilities also tend to be cheaper in Detroit. For those contemplating relocation or a visit, Detroit would be a more economical choice.
Income Tax
Michigan has a flat income tax rate of 4.25%, while North Carolina’s income tax rate is 5.25%. These tax rates can affect disposable income for residents of both cities.
Property Tax
Though Detroit has lower property values, its property tax rates are significantly higher than in Raleigh, impacting the cost of homeownership.
Sales Tax
Detroit, in the state of Michigan, has a lower sales tax rate of 6% compared to Raleigh in North Carolina's 7.25%, potentially making Detroit a more attractive option for consumers.
Income
Type
Detroit
Raleigh
Estimated median household income
$36,140
$74,612
Estimated per capita income
$22,122
$44,001
Cost of living index (U.S. average is 100)
94.1
95.1
If you make $50,000 in Detroit, you will have to make $50,531 in Raleigh to maintain the same standard of living.
Geographical Conditions
Detroit is located on the Detroit River, with a landscape shaped by the Great Lakes. Raleigh is characterized by rolling hills located near the Atlantic Coast and Appalachian Mountains, offering a lot of natural beauty.
Raleigh surpasses Detroit in terms of educational opportunities, being part of the Research Triangle, which includes renowned universities like Duke and UNC Chapel Hill. While Detroit offers good schools, like Wayne State University, the variety and reputation of Raleigh's educational institutions make it a more desirable destination for students.
Detroit's economy is synonymous with the auto industry, although it is diversifying into sectors like technology, healthcare, and finance. Raleigh, however, offers a more diversified economy with strong sectors in IT, biotech, and healthcare, boosted by a highly educated workforce.
Biggest Employers
Detroit's largest employers are the automotive giants: General Motors, Ford, and Fiat Chrysler. In contrast, Raleigh's biggest employers include IBM, WakeMed Health & Hospitals, and North Carolina State University.
There were 10 building permits issued in Detroit in 2012 (8 less than in 2011) compared to 1,354 building permits issued in Raleigh in 2012 (366 more than in 2011).
In Detroit (Wayne County), 73.1% voted for Democrats and 26.2% for Republicans in 2012 Presidential Election. In Raleigh (Wake County), 54.9% voted for Democrats and 43.5% for Republicans.
Elections
Type
Democrats
Republicans
Other
Year
Detroit
Raleigh
Detroit
Raleigh
Detroit
Raleigh
2020
68.6%
62.3%
30.4%
35.9%
1.0%
1.8%
2016
66.6%
57.4%
29.4%
37.2%
4.0%
5.5%
2012
73.1%
54.9%
26.2%
43.5%
0.6%
1.6%
2008
74.4%
56.8%
24.7%
42.3%
0.9%
0.9%
2004
69.7%
48.7%
29.9%
50.9%
0.4%
0.4%
2000
69.1%
46.1%
29.1%
53.2%
1.8%
0.7%
1996
69.0%
45.9%
24.0%
48.2%
7.0%
5.9%
Breakdown of population affiliated with a religious congregation
Type
Adherents
Congregations
Religion
Detroit
Raleigh
Detroit
Raleigh
CATHOLIC CHURCH
16.3%
11.0%
11.2%
2.4%
MUSLIM ESTIMATE
3.7%
1.1%
2.9%
1.0%
AMERICAN BAPTIST CHURCHES IN THE USA
1.5%
0.4%
2.4%
0.6%
LUTHERAN CHURCH
1.2%
0.4%
3.9%
0.6%
EVANGELICAL LUTHERAN CHURCH IN AMERICA
0.7%
0.6%
2.8%
1.1%
EPISCOPAL CHURCH
0.4%
1.1%
2.5%
1.8%
SEVENTH DAY ADVENTIST CHURCH
0.4%
0.2%
1.4%
1.0%
SOUTHERN BAPTIST CONVENTION
0.4%
9.0%
3.2%
22.5%
Weather
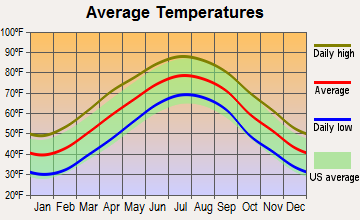
Weather-wise, Detroit experiences a continental climate with cold, snowy winters, and warm to hot summers. In contrast, Raleigh experiences a subtropical climate with mild winters and hot, humid summers. Depending upon personal preferences, people might prefer the milder winter temperatures in Raleigh over the heavy snowfall in Detroit.
Weather and climate
Type
Detroit
Raleigh
Temperature - Average
50°F
59.8°F
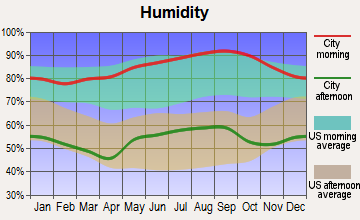
Humidity - Average morning or afternoon humidity
75.3%
73.7%
Humidity - Differences between morning and afternoon humidity
33%
44%
Humidity - Maximum monthly morning or afternoon humidity
86%
90%
Humidity - Minimum monthly morning or afternoon humidity
53%
46%
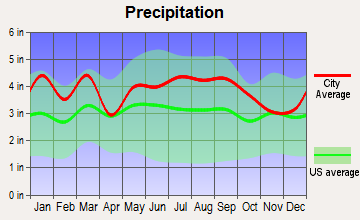
Precipitation - Yearly average
33.6 in
46.2 in
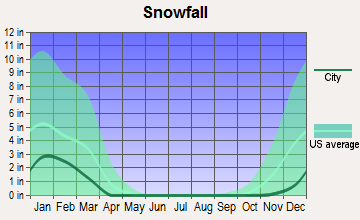
Snowfall - Yearly average
86.5 in
13.4 in
Clouds - Number of days clear of clouds
12.7%
18.5%
Sunshine amount - Average
56.8%
63.9%
Sunshine amount - Differences during a year
38%
13%
Sunshine amount - Maximum monthly
69%
64%
Sunshine amount - Minimum monthly
31%
51%
Wind speed - Average
10.2 mph
7.1 mph
Average climate in Detroit, Michigan
Average climate in Raleigh, North Carolina
Air pollution
Type
AQI
CO
NO2
OZONE
PB
PM10
PM25
SO2
Year
Detroit
Raleigh
Detroit
Raleigh
Detroit
Raleigh
Detroit
Raleigh
Detroit
Raleigh
Detroit
Raleigh
Detroit
Raleigh
2018
90
71
0.44
0.23
12.9
4.9
25.8
27.5
N/A
N/A
14.6
N/A
10.1
9.5
1.1
0.2
2017
87
70
0.56
0.23
12.7
5.5
20.9
25.8
N/A
N/A
14.7
N/A
10.1
9.3
1.3
0.2
2016
86
80
0.47
0.23
13.2
5.6
22.0
26.9
N/A
N/A
8.7
N/A
10.9
10.0
0.8
0.3
2015
95
79
0.49
0.27
14.8
5.7
26.5
28.6
N/A
N/A
12.4
N/A
11.9
11.0
1.2
0.3
2014
95
74
0.48
0.26
14.2
6.0
24.2
29.9
N/A
N/A
N/A
N/A
12.0
11.2
1.7
0.3
2013
80
72
0.53
0.26
14.4
N/A
24.5
26.9
N/A
N/A
N/A
N/A
11.0
10.7
1.3
0.4
2012
99
80
0.49
0.28
14.6
N/A
25.7
29.7
N/A
N/A
N/A
N/A
6.6
9.5
1.7
0.6
2011
94
84
0.32
0.27
12.9
N/A
24.3
32.9
N/A
N/A
N/A
N/A
6.5
10.3
1.6
0.7
2010
96
89
0.28
0.30
11.8
N/A
24.7
32.4
0.006
N/A
N/A
N/A
12.1
10.9
1.6
1.0
2009
68
77
0.27
0.30
12.7
N/A
23.4
27.8
N/A
N/A
N/A
N/A
N/A
10.3
1.9
1.0
2008
67
99
0.27
0.36
12.8
N/A
N/A
32.3
N/A
N/A
N/A
N/A
N/A
12.5
2.0
1.4
2007
81
98
0.29
0.40
13.7
N/A
25.8
35.7
0.017
N/A
N/A
N/A
N/A
13.9
N/A
1.2
2006
63
90
0.31
0.44
14.0
N/A
19.8
31.9
0.022
N/A
N/A
N/A
N/A
13.5
3.2
0.9
2005
83
80
0.36
0.38
17.4
N/A
22.6
33.9
0.019
N/A
N/A
N/A
N/A
N/A
4.0
2.5
2004
70
82
0.43
0.40
15.0
N/A
N/A
28.4
0.014
N/A
N/A
N/A
N/A
N/A
3.7
2.6
2003
86
82
0.40
N/A
18.5
N/A
N/A
29.9
0.013
N/A
N/A
N/A
N/A
N/A
4.8
3.0
2002
88
89
0.36
N/A
18.3
N/A
N/A
36.1
0.019
N/A
N/A
N/A
N/A
N/A
4.3
2.6
2001
83
128
0.36
N/A
19.0
N/A
N/A
34.5
0.020
N/A
N/A
N/A
N/A
N/A
4.4
N/A
2000
71
115
0.35
0.64
18.2
N/A
N/A
34.1
0.027
N/A
N/A
N/A
N/A
N/A
5.2
N/A
Natural disasters
Type
Detroit
Raleigh
Tornado activity compared to U.S. average
128.5%
95.1%
Earthquake activity compared to U.S. average
53.2%
52.6%
Natural disasters compared to U.S. average
14%
18%
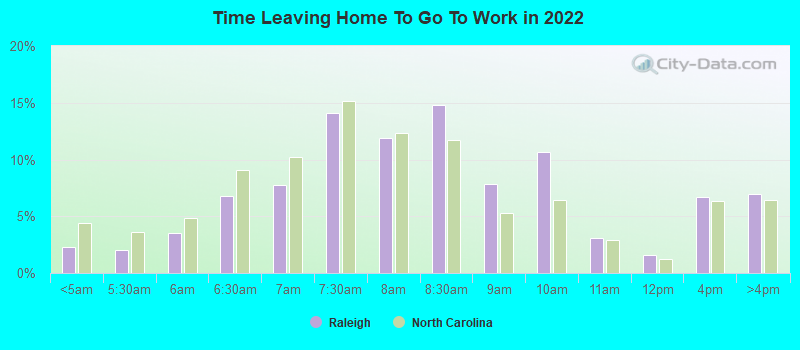
Transportation
Detroit's public transportation includes buses and a monorail system, while Raleigh has buses and an expanding bike-sharing program. Commuting times can be higher in Detroit due to its urban sprawl.
Transport
Type
Detroit
Raleigh
Amtrak stations
1
1
Amtrak stations nearby
3
3
FAA registered aircraft
93
499
FAA registered aircraft manufacturers and dealers
3
12
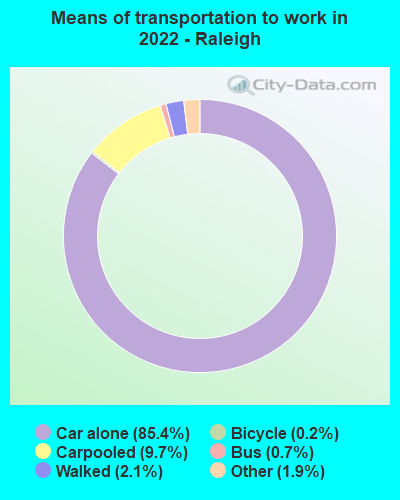
Means of transportation to work
Type
Detroit
Raleigh
Bicycle
0.5%
0.2%
Bus
4%
1.1%
Carpooled
7.5%
8.5%
Car alone
83.4%
87.4%
Motorcycle
0%
0.1%
Taxicab
0.5%
0.3%
Walked
2.7%
1.1%
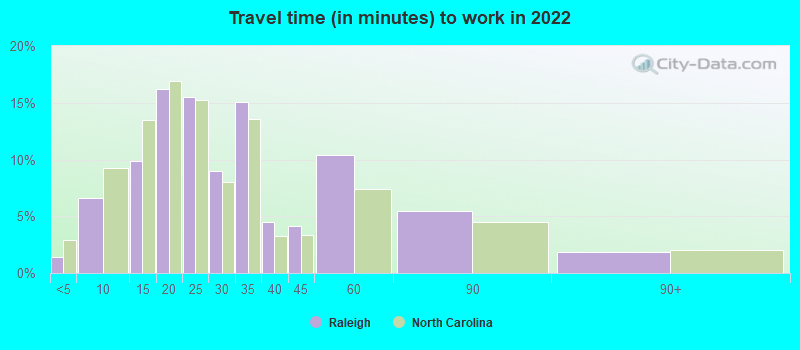
Average travel time to work
Type
Detroit
Raleigh
Average
30.6 min
29.4 min
Other means
26 min
22.5 min
Public transportation
47.7 min
39.9 min
Private vehicle occupancy
Type
Detroit
Raleigh
Average
1.2
1.1
Drove alone
87.1%
90.1%
In 2 person carpool
10.5%
7.6%
In 3 person carpool
1%
1.4%
In 4 person carpool
1%
0.3%
In 5-6 person carpool
0.3%
0.6%
In 7+ person carpool
0.2%
0.1%
How many people usually rode to work in the car, truck or van.
Real Estate
Detroit's real estate market presents lower property values, making it more affordable. On the other hand, Raleigh's real estate market is more competitive, with higher home prices due to its growing popularity and economic prosperity.
Neighborhoods
Detroit is known for its culturally rich neighborhoods, such as Greektown and Corktown. Raleigh offers diverse neighborhoods – from the historic Oakwood to hip and modern districts like Warehouse District.
Houses and residents
Type
Detroit
Raleigh
Houses
322,906
217,866
Average household size (people)
2.6
2.4
Median year apartment built
1953
1995
Median year house/condo built
1946
1995
Length of stay in the house since moving in
16.7 years
11.5 years
Houses occupied
251,729 (78%)
194,917 (89.5%)
Houses occupied by owners
129,084 (51.3%)
103,367 (53%)
Houses occupied by renters
122,645 (48.7%)
91,550 (47%)
Median rent asked for vacant for-rent units
$798.06
$1,740
Median monthly housing costs
$755
$1,298
Median price asked for vacant for-sale houses and condos
$86,452
$302,120
Estimated median house or condo value
$69,300
$340,200
Median numbers of rooms
5.7
5.1
Median number of rooms in apartments
5
3.9
Median number of rooms in houses and condos
6.3
6.7
Median house price - detached houses
$96,752
$446,507
Median house price - in 2-unit structures
$72,631
$403,968
Median house price - in 3-to-4-unit structures
$183,952
$170,635
Median house price - in 5 or more unit structures
$242,851
$306,998
Median house price - mobile homes
$43,864
$31,622
Median house price - Townhouses or other attached units
$128,652
$292,086
Median house price - All housing units
$101,554
$404,828
Median house age
74
26
Renting percentage
48.9%
46.5%
Housing density (houses/condos per square mile)
2,326.9
1,901.1
House value disparities
48.4%
30.8%
Household income disparities
49.3%
45.4%
Median household income for houses/condes with a mortgage
$61,259
$114,680
Median household income for apartments without a mortgage
$38,901
$81,716
Housing units without a mortgage
2,599 (5.6%)
1,689 (2.1%)
Housing units with both a second mortgage and home equity loan
2,270 (4.9%)
6,627 (8.2%)
Housing units with a mortgage
43,675 (94.4%)
78,923 (97.9%)
Housing units with a home equity loan
357 (0.8%)
0 (0%)
Housing units with a second mortgage
3,466 (7.5%)
7,783 (9.7%)
House/condo owner moved in on average (years ago)
16
8
House/condo renter moved in on average (years ago)
4
1
Housing units lacking complete kitchen facilities
17.1%
0.6%
Housing units lacking complete plumbing facilities
13.6%
0.5%
Housing units in structures
Housing units in structures
Detroit
Raleigh
One, detached
66.0%
45.0%
One, attached
6.1%
14.0%
Two
6.5%
1.2%
3 or 4
2.7%
4.6%
5 to 9
2.2%
6.3%
10 to 19
2.7%
12.4%
20 to 49
3.9%
6.0%
50 or more
9.4%
9.2%
Mobile homes
0.5%
1.2%
Median real estate property taxes paid for housing units
Self-employed workers in own not incorporated business
11,725
12,488
State government workers
8,763
19,792
Unpaid family workers
441
523
Industries and Occupations
Detroit has long been tied to manufacturing, primarily automotive. Meanwhile, Raleigh is an emerging tech hub, offering numerous opportunities in software development, IT, and biotech. Both cities have a healthcare industry presence.
Both Detroit and Raleigh have good healthcare facilities. Detroit's major hospital systems include Detroit Medical Center and Henry Ford Health System, while Raleigh boasts the state-of-the-art Duke University Medical Center.
Health (county statistics)
Type
Detroit
Raleigh
General health status score of residents in this county from 1 (poor) to 5 (excellent)
Both cities have distinct advantages. Detroit's historic architecture stands in contrast to Raleigh's more modern infrastructure punctuated with green spaces. Raleigh's infrastructure, especially around public facilities, often ranks higher in terms of quality and maintenance.
Infrastructure
Type
Detroit
Raleigh
Hospitals
41
19
TV stations
16
20
Arenas or stadiums
4
3
Bank branches located here
98
136
Bank institutions located here
12
27
Main business address for public companies
11
21
Nuclear power plants nearby
0
1
Drinking water stations with no reported violations in the past
5
2
Drinking water stations with reported violations in the past
HMDA - Conventional home purchase loans - Applications denied
Year
Detroit
Raleigh
1999
2,901
1,618
2000
4,079
890
2001
3,815
557
2002
3,247
510
2003
5,511
564
2004
9,068
700
2005
13,958
1,083
2006
16,654
1,097
2007
10,742
859
2008
2,823
424
2009
484
253
Culture and Food
Detroit's cultural scene is deeply rooted in music, particularly Motown and Techno, and automotive history. Raleigh boasts rich southern culture with a strong arts scene. Food in both cities reflects their cultures - Detroit with its Coney dog and square pizza, Raleigh with its barbecues and southern comfort food.
Sports Teams
Detroit has a rich sports legacy, home to teams in all "big four" sports. Raleigh, while smaller, is home to the NHL's Carolina Hurricanes and supports college sports enthusiastically, especially basketball.


 Detroit, MI
 Raleigh, NC