Comparing Detroit, Michigan to Greensboro, North Carolina involves considering various factors that ranging from crime rates, climates, to their unique cultural identities. Detroit has struggled with a high crime rate and a challenging economy, but it boasts a rich industrial history and a vibrant music and sports culture. Contrarily, Greensboro boasts a lower cost of living, a more pleasant weather, and a more diversified economy. However, when making such a decision, it is essential to break it down into various factors for a clearer context.
Distance between
Detroit, MI and
Greensboro, NC : 469.8 miles
Detroit's population is larger by 112%. Its population has decreased by 318,806 people (33.5%) since 2000. The population of Greensboro has grown by 74,372 people (33.2%) during that time.
Detroit has unfortunately been associated with high crime rates for several years, which can be a concern for potential residents and tourists. The city has been putting measures to address this, including restructuring its police department to improve safety. Conversely, Greensboro's crime rate is lower in comparison, making it a more comfortable choice.
City-data.com crime index counts serious crimes and violent crime more heavily. It adjusts for the number of visitors and daily workers commuting into cities. (higher means more crime, U.S. average = 301.1)
City-data.com crime index counts serious crimes and violent crime more heavily. It adjusts for the number of visitors and daily workers commuting into cities. (higher means more crime, U.S. average = 301.1)
Sex Offenders
According to our data, there are 3,462 registered sex offenders living in Detroit and 607 registered sex offenders living in . The ratio of residents to sex offenders in Detroit is 194 to 1; the ratio in Greensboro is 473 to 1. The number of registered sex offenders compared to the number of residents is larger in Detroit than in Greensboro.
Cost of Living
The cost of living in Detroit is generally lower than the national average, including housing costs. On the contrary, Greensboro’s cost of living is even lower, with cheaper housing and utility costs.
Income Tax
Michigan's state income tax rate is a flat 4.25%. On the other hand, North Carolina levies a flat state income tax rate of 5.25%.
Property Tax
Detroit property owners typically see higher property taxes in comparison to their Greensboro counterparts, with a rate of 1.69%. In Greensboro, the Guilford County property tax rate is approximately 0.77%, significantly lower than that of Detroit.
Sales Tax
Detroit residents and businesses are subjected to Michigan's 6% state sales tax. On the other hand, Greensboro residents and businesses deal with North Carolina's state sales tax of 4.75%, with an added local tax rate of 2-2.25%.
Income
Type
Detroit
Greensboro
Estimated median household income
$36,140
$51,825
Estimated per capita income
$22,122
$32,208
Cost of living index (U.S. average is 100)
94.1
91.2
If you make $50,000 in Greensboro, you will have to make $51,590 in Detroit to maintain the same standard of living.
Geographical Conditions
Detroit is located in southeastern Michigan, on the Detroit River, with close proximity to Canada. Greensboro is located in the picturesque Piedmont Triad region of central North Carolina, known for its rolling hills and green spaces.
Detroit's education system has struggled in the past, but it's seeing improvement with new innovations and reforms. In contrast, Greensboro enjoys a strong educational backbone, with numerous high-ranking public schools and universities.
Once a booming industrial powerhouse, Detroit has faced economic struggles but the city is gradually recovering, diversifying its economy with information technology, healthcare, and other sectors. Greensboro has a diversified economy, strong in education, health care, transportation, and telecommunications sectors.
Biggest Employers
Major employers in Detroit include General Motors, Ford, and Fiat Chrysler Automobiles alongside Quicken Loans. In Greensboro, major employers include Cone Health, Guilford County Schools, and the city of Greensboro.
There were 10 building permits issued in Detroit in 2012 (8 less than in 2011) compared to 529 building permits issued in Greensboro in 2012 (235 more than in 2011).
In Detroit (Wayne County), 73.1% voted for Democrats and 26.2% for Republicans in 2012 Presidential Election. In Greensboro (Guilford County), 57.8% voted for Democrats and 41.4% for Republicans.
Elections
Type
Democrats
Republicans
Other
Year
Detroit
Greensboro
Detroit
Greensboro
Detroit
Greensboro
2020
68.6%
61.1%
30.4%
37.9%
1.0%
1.1%
2016
66.6%
58.0%
29.4%
38.1%
4.0%
3.9%
2012
73.1%
57.8%
26.2%
41.4%
0.6%
0.8%
2008
74.4%
58.9%
24.7%
40.5%
0.9%
0.5%
2004
69.7%
50.2%
29.9%
49.3%
0.4%
0.4%
2000
69.1%
48.6%
29.1%
50.8%
1.8%
0.7%
1996
69.0%
46.9%
24.0%
45.9%
7.0%
7.2%
Breakdown of population affiliated with a religious congregation
Type
Adherents
Congregations
Religion
Detroit
Greensboro
Detroit
Greensboro
CATHOLIC CHURCH
16.3%
3.6%
11.2%
1.0%
MUSLIM ESTIMATE
3.7%
0.8%
2.9%
0.7%
AMERICAN BAPTIST CHURCHES IN THE USA
1.5%
0.1%
2.4%
0.3%
LUTHERAN CHURCH
1.2%
0.2%
3.9%
0.7%
EVANGELICAL LUTHERAN CHURCH IN AMERICA
0.7%
0.8%
2.8%
2.2%
EPISCOPAL CHURCH
0.4%
1.2%
2.5%
1.5%
SEVENTH DAY ADVENTIST CHURCH
0.4%
0.5%
1.4%
0.7%
SOUTHERN BAPTIST CONVENTION
0.4%
9.6%
3.2%
16.5%
INTERNA PENTECO HOLINESS CHURCH
0.0%
0.3%
0.1%
1.5%
Weather
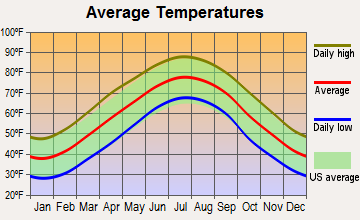
Detroit experiences a typical Midwestern climate, with hot summers, cold winters, and appreciable seasonal variation. On the other hand, Greensboro enjoys a warmer, more temperate climate, with mild winters and hot summers, making it generally more appealing to those less fond of harsh winters.
Weather and climate
Type
Detroit
Greensboro
Temperature - Average
50°F
58.4°F
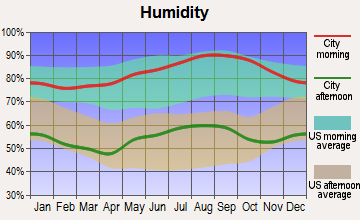
Humidity - Average morning or afternoon humidity
75.3%
72.8%
Humidity - Differences between morning and afternoon humidity
33%
42%
Humidity - Maximum monthly morning or afternoon humidity
86%
88%
Humidity - Minimum monthly morning or afternoon humidity
53%
46%
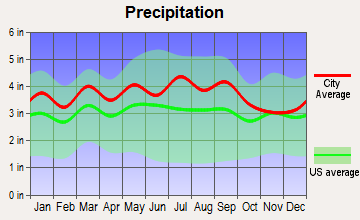
Precipitation - Yearly average
33.6 in
44.3 in
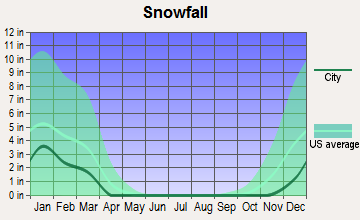
Snowfall - Yearly average
86.5 in
17 in
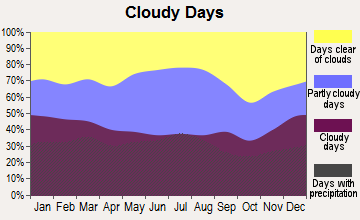
Clouds - Number of days clear of clouds
12.7%
18.3%
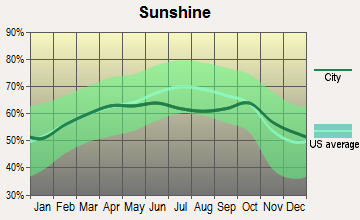
Sunshine amount - Average
56.8%
64.7%
Sunshine amount - Differences during a year
38%
10%
Sunshine amount - Maximum monthly
69%
64%
Sunshine amount - Minimum monthly
31%
54%
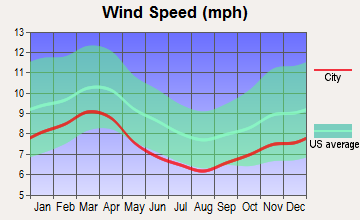
Wind speed - Average
10.2 mph
7.7 mph
Average climate in Detroit, Michigan
Average climate in Greensboro, North Carolina
Air pollution
Type
AQI
CO
NO2
OZONE
PB
PM10
PM25
SO2
Year
Detroit
Greensboro
Detroit
Greensboro
Detroit
Greensboro
Detroit
Greensboro
Detroit
Greensboro
Detroit
Greensboro
Detroit
Greensboro
2018
90
69
0.44
N/A
12.9
6.7
25.8
32.1
N/A
N/A
16.7
N/A
10.1
7.4
1.1
0.2
2017
87
71
0.56
N/A
12.7
7.0
20.9
29.1
N/A
N/A
11.9
N/A
10.1
7.9
1.3
0.3
2016
86
82
0.47
N/A
13.2
6.6
22.0
31.9
N/A
N/A
11.1
N/A
10.9
8.5
0.8
0.2
2015
95
74
0.49
N/A
14.8
6.8
26.5
28.8
N/A
N/A
12.3
N/A
11.9
8.2
1.2
0.3
2014
95
72
0.48
N/A
14.2
6.3
24.2
33.5
N/A
N/A
12.9
N/A
12.0
9.0
1.7
0.4
2013
80
74
0.53
N/A
14.4
6.0
24.5
28.5
N/A
N/A
12.0
N/A
11.0
8.3
1.3
0.3
2012
99
83
0.49
N/A
14.6
8.9
25.7
32.5
N/A
N/A
13.5
N/A
6.6
9.2
1.7
0.4
2011
94
84
0.32
N/A
12.9
7.5
24.3
34.7
N/A
N/A
14.8
N/A
6.5
9.9
1.6
1.0
2010
96
97
0.28
N/A
11.8
9.5
24.7
35.6
0.006
N/A
16.0
N/A
12.1
10.4
1.6
0.3
2009
68
81
0.27
N/A
12.7
13.3
23.4
30.4
N/A
N/A
14.2
N/A
N/A
9.9
1.9
3.9
2008
67
98
0.27
N/A
12.8
11.1
N/A
33.7
N/A
N/A
16.7
N/A
N/A
12.7
2.0
6.3
2007
81
102
0.29
N/A
13.7
11.1
25.8
37.9
0.017
N/A
19.8
N/A
N/A
13.7
N/A
5.5
2006
63
90
0.31
N/A
14.0
10.3
19.8
33.6
0.022
N/A
19.4
N/A
N/A
14.9
3.2
5.1
2005
83
83
0.36
0.70
17.4
10.5
22.6
33.1
0.019
N/A
19.6
N/A
N/A
N/A
4.0
5.1
2004
70
76
0.43
0.56
15.0
12.9
N/A
24.9
0.014
N/A
19.8
N/A
N/A
N/A
3.7
4.3
2003
86
88
0.40
0.56
18.5
14.8
N/A
29.3
0.013
N/A
18.9
N/A
N/A
N/A
4.8
5.5
2002
88
99
0.36
0.65
18.3
14.3
N/A
34.8
0.019
N/A
19.7
N/A
N/A
N/A
4.3
5.0
2001
83
103
0.36
0.70
19.0
16.0
N/A
31.0
0.020
N/A
21.4
N/A
N/A
N/A
4.4
4.5
2000
71
90
0.35
0.68
18.2
17.1
N/A
31.2
0.027
N/A
21.2
N/A
N/A
N/A
5.2
4.4
Natural disasters
Type
Detroit
Greensboro
Tornado activity compared to U.S. average
128.5%
76.6%
Earthquake activity compared to U.S. average
53.2%
67.4%
Natural disasters compared to U.S. average
14%
20%
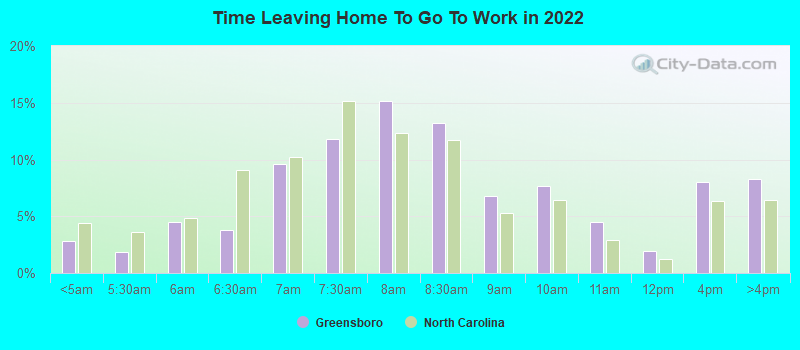
Transportation
Detroit has an extensive transportation network, including buses, the People Mover, and the QLine. Greensboro’s transportation system includes buses, shuttles, and Amtrak service, with less crowds and typically shorter commute times.
Transport
Type
Detroit
Greensboro
Amtrak stations
1
1
Amtrak stations nearby
3
2
FAA registered aircraft
93
300
FAA registered aircraft manufacturers and dealers
3
13
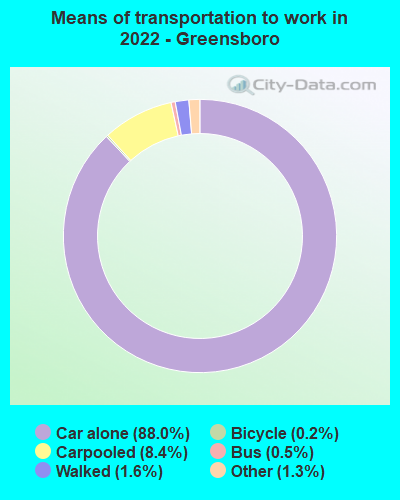
Means of transportation to work
Type
Detroit
Greensboro
Bicycle
0.5%
0.1%
Bus
4%
1%
Carpooled
7.5%
6.8%
Car alone
83.4%
89.4%
Taxicab
0.5%
0.2%
Walked
2.7%
1.2%
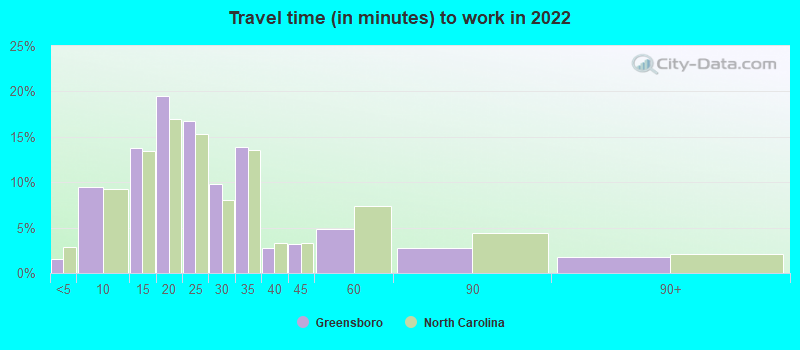
Average travel time to work
Type
Detroit
Greensboro
Average
30.6 min
24.8 min
Other means
26 min
20.9 min
Public transportation
47.7 min
42.2 min
Private vehicle occupancy
Type
Detroit
Greensboro
Average
1.2
1.1
Drove alone
87.1%
91.9%
In 2 person carpool
10.5%
5.8%
In 3 person carpool
1%
1.5%
In 4 person carpool
1%
0.5%
In 5-6 person carpool
0.3%
0.1%
In 7+ person carpool
0.2%
0.2%
How many people usually rode to work in the car, truck or van.
Real Estate
Detroit has struggled with real estate in the past, but the market is improving, and there are plans for redevelopment. Real estate in Greensboro is more stable and more affordable, with growth in both residential and commercial sectors.
Houses and residents
Type
Detroit
Greensboro
Houses
322,906
139,565
Average household size (people)
2.6
2.3
Median year apartment built
1953
1989
Median year house/condo built
1946
1981
Length of stay in the house since moving in
16.7 years
13.6 years
Houses occupied
251,729 (78%)
123,955 (88.8%)
Houses occupied by owners
129,084 (51.3%)
69,834 (56.3%)
Houses occupied by renters
122,645 (48.7%)
54,121 (43.7%)
Median rent asked for vacant for-rent units
$798.06
$1,295
Median monthly housing costs
$755
$981
Median price asked for vacant for-sale houses and condos
$86,452
$336,309
Estimated median house or condo value
$69,300
$186,200
Median numbers of rooms
5.7
5.3
Median number of rooms in apartments
5
4
Median number of rooms in houses and condos
6.3
6.3
Median house price - detached houses
$96,752
$261,886
Median house price - in 2-unit structures
$72,631
$205,442
Median house price - in 3-to-4-unit structures
$183,952
$240,978
Median house price - in 5 or more unit structures
$242,851
$129,256
Median house price - mobile homes
$43,864
$86,037
Median house price - Townhouses or other attached units
$128,652
$221,087
Median house price - All housing units
$101,554
$252,845
Median house age
74
37
Renting percentage
48.9%
47.5%
Housing density (houses/condos per square mile)
2,326.9
1,332.9
House value disparities
48.4%
36.2%
Household income disparities
49.3%
45.9%
Median household income for houses/condes with a mortgage
$61,259
$75,953
Median household income for apartments without a mortgage
$38,901
$62,470
Housing units without a mortgage
2,599 (5.6%)
1,421 (3.1%)
Housing units with both a second mortgage and home equity loan
2,270 (4.9%)
3,736 (8.1%)
Housing units with a mortgage
43,675 (94.4%)
44,909 (96.9%)
Housing units with a home equity loan
357 (0.8%)
227 (0.5%)
Housing units with a second mortgage
3,466 (7.5%)
5,099 (11%)
House/condo owner moved in on average (years ago)
16
12
House/condo renter moved in on average (years ago)
4
1
Housing units lacking complete kitchen facilities
17.1%
1.8%
Housing units lacking complete plumbing facilities
13.6%
0.5%
Housing units in structures
Housing units in structures
Detroit
Greensboro
One, detached
66.0%
55.4%
One, attached
6.1%
7.3%
Two
6.5%
1.7%
3 or 4
2.7%
5.4%
5 to 9
2.2%
9.0%
10 to 19
2.7%
8.6%
20 to 49
3.9%
7.0%
50 or more
9.4%
4.3%
Mobile homes
0.5%
1.3%
Median real estate property taxes paid for housing units
Self-employed workers in own not incorporated business
11,725
6,258
State government workers
8,763
9,041
Unpaid family workers
441
205
Industries and Occupations
Detroit has a rich auto-manufacturing history, thus manufacturing, information technology, and healthcare are significant employment sectors. Greensboro is known for its strength in the transport, logistics, manufacturing, and telecommunications sectors.
Detroit is well-served in healthcare, boasting several nationally recognized hospitals. Greensboro also has strong healthcare facilities, with Cone Health being one of the major providers in the region.
Health (county statistics)
Type
Detroit
Greensboro
General health status score of residents in this county from 1 (poor) to 5 (excellent)
Both cities possess comprehensive infrastructures, although Greensboro is smaller and may offer shorter commute times. Detroit's longer history and more extensive industrial past mean it has an older, more developed infrastructure.
Infrastructure
Type
Detroit
Greensboro
Hospitals
41
16
TV stations
16
10
Arenas or stadiums
4
1
Bank branches located here
98
97
Bank institutions located here
12
19
Main business address for public companies
11
11
Drinking water stations with no reported violations in the past
5
3
Drinking water stations with reported violations in the past
HMDA - Conventional home purchase loans - Applications denied
Year
Detroit
Greensboro
1999
2,901
1,540
2000
4,079
1,012
2001
3,815
739
2002
3,247
787
2003
5,511
568
2004
9,068
692
2005
13,958
748
2006
16,654
880
2007
10,742
653
2008
2,823
290
2009
484
164
Culture and Food
Detroit is known for its vibrant music scene and unique culinary identity shaped by various ethnic influences. In contrast, Greensboro enjoys a mix of Southern culture and a university-town feel, with a diversified food scene blending traditional Southern cooking with international cuisines.
Sports Teams
For sports enthusiasts, Detroit is home to several professional sports teams, including Detroit Red Wings (NHL), Detroit Pistons (NBA), Detroit Tigers (MLB), and Detroit Lions (NFL). Greensboro, while not having major league teams, hosts minor league baseball and hockey teams, and local college sports are extremely popular.


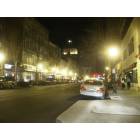
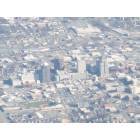
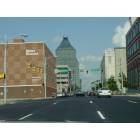

 Detroit, MI
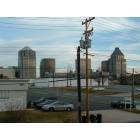
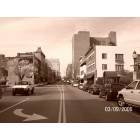
 Greensboro, NC