Detroit, Michigan, and Durham, North Carolina, offer different experiences for both residents and visitors. While Detroit has a rich industrial history and strong sports culture, Durham pairs progressive, academic culture with a scenic setting ideal for outdoor activities. By comparing aspects of crime, weather, cost of living, education, work opportunities, infrastructure, taxation, cultural pursuits, and healthcare, we can derive a clear understanding of life in these two cities.
Distance between
Detroit, MI and
Durham, NC : 495.7 miles
Detroit's population is larger by 122%. Its population has decreased by 318,806 people (33.5%) since 2000. The population of Durham has grown by 98,492 people (52.7%) during that time.
Detroit has struggled with its reputation for crime, although recent years have shown considerable improvements in safety. The city's revitalization efforts have begun to pay off, with many neighborhoods seeing reduced crime rates. Still, safety issues remain an aspect to consider when moving to or visiting Detroit. Conversely, Durham has relatively low crime rates that are akin to the national averages. Its most popular neighborhoods are generally considered safe for both residents and tourists, making the city an attractive choice in terms of safety.
City-data.com crime index counts serious crimes and violent crime more heavily. It adjusts for the number of visitors and daily workers commuting into cities. (higher means more crime, U.S. average = 301.1)
City-data.com crime index counts serious crimes and violent crime more heavily. It adjusts for the number of visitors and daily workers commuting into cities. (higher means more crime, U.S. average = 301.1)
Sex Offenders
According to our data, there are 3,462 registered sex offenders living in Detroit and 405 registered sex offenders living in . The ratio of residents to sex offenders in Detroit is 194 to 1; the ratio in Durham is 649 to 1. The number of registered sex offenders compared to the number of residents is much larger in Detroit than that in Durham.
Cost of Living
The cost of living in Durham is slightly higher than the national average but is significantly less than in many major cities. Housing costs drive most of this difference. In contrast, Detroit has a lower cost of living, driven by affordable housing, making it an attractive choice for those looking to stretch their dollars further.
Income Tax
Michigan has a flat income tax rate of 4.25%. North Carolina also uses a flat tax system but at a slightly higher rate of 5.25%.
Property Tax
Property taxes in Detroit are relatively high, with a millage rate of around 70 mills. Durham county has a lower millage rate of around 0.82%, potentially making homeownership more affordable.
Sales Tax
The combined sales tax rate for Detroit is 6%, while Durham has a combined sales tax rate of 7.5%, which might impact your budget depending on your spending habits.
Income
Type
Detroit
Durham
Estimated median household income
$36,140
$71,343
Estimated per capita income
$22,122
$42,469
Cost of living index (U.S. average is 100)
94.1
94.1
If you make $50,000 in Durham, you will have to make $50,000 in Detroit to maintain the same standard of living.
Geographical Conditions
Detroit, located near the Great Lakes, offers waterfront living opportunities. However, Durham, located between the Blue Ridge Mountains and the Atlantic, offers a variety of outdoor activities and picturesque views.
Education is a strong suit for Durham, home to Duke University and North Carolina Central University. These reputable institutions contribute to a well-educated local population and offer tremendous resources. Detroit's education landscape is more varied, with challenges in the public school system offset by strong charter and private schools and well-regarded universities like Wayne State.
Detroit's economy, once largely dependant on the auto industry, has been diversifying. More tech and healthcare jobs are emerging, although unemployment is still higher than average. In contrast, Durham boasts a strong, diverse economy with lower-than-average unemployment. The presence of the Research Triangle Park contributes to a wealth of opportunities in tech, biotech, and healthcare industries.
Biggest Employers
Detroit's biggest employers include the Detroit Medical Center, General Motors, and Quicken Loans. In contrast, Durham's top employers include Duke University and Medical Center, IBM Corporation, and the biotech firm, Biogen.
There were 10 building permits issued in Detroit in 2012 (8 less than in 2011) compared to 1,960 building permits issued in Durham in 2012 (1077 more than in 2011).
In Detroit (Wayne County), 73.1% voted for Democrats and 26.2% for Republicans in 2012 Presidential Election. In Durham (Durham County), 75.8% voted for Democrats and 23.0% for Republicans.
Elections
Type
Democrats
Republicans
Other
Year
Detroit
Durham
Detroit
Durham
Detroit
Durham
2020
68.6%
80.5%
30.4%
18.1%
1.0%
1.4%
2016
66.6%
77.7%
29.4%
18.2%
4.0%
4.2%
2012
73.1%
75.8%
26.2%
23.0%
0.6%
1.2%
2008
74.4%
75.8%
24.7%
23.7%
0.9%
0.5%
2004
69.7%
68.0%
29.9%
31.6%
0.4%
0.3%
2000
69.1%
63.8%
29.1%
35.7%
1.8%
0.5%
1996
69.0%
60.8%
24.0%
34.4%
7.0%
4.8%
Breakdown of population affiliated with a religious congregation
Type
Adherents
Congregations
Religion
Detroit
Durham
Detroit
Durham
CATHOLIC CHURCH
16.3%
3.9%
11.2%
1.3%
MUSLIM ESTIMATE
3.7%
0.7%
2.9%
1.6%
AMERICAN BAPTIST CHURCHES IN THE USA
1.5%
3.2%
2.4%
2.9%
LUTHERAN CHURCH
1.2%
0.1%
3.9%
0.3%
EVANGELICAL LUTHERAN CHURCH IN AMERICA
0.7%
0.4%
2.8%
1.3%
EPISCOPAL CHURCH
0.4%
1.0%
2.5%
2.0%
SEVENTH DAY ADVENTIST CHURCH
0.4%
0.4%
1.4%
2.0%
SOUTHERN BAPTIST CONVENTION
0.4%
9.7%
3.2%
20.3%
PRESBYTERIAN CHURCH IN AMERICA
0.0%
0.4%
0.0%
0.3%
Weather
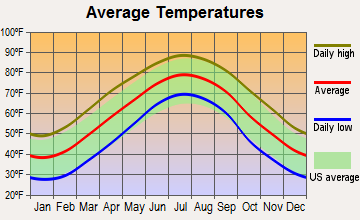
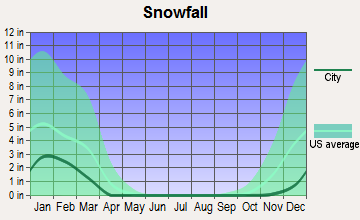
Detroit has a strong four-season climate, with cold, snowy winters and warm summers, which can sometimes become hot and humid. Durham’s climate is relatively moderate and tends to be warmer, with hot, humid summers and mild winters. This allows for a myriad of outdoor activities throughout the year, appealing to people who enjoy a balance of all seasons.
Weather and climate
Type
Detroit
Durham
Temperature - Average
50°F
59°F
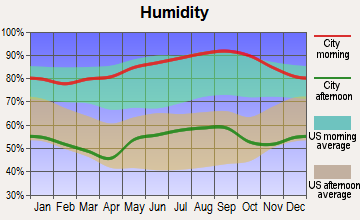
Humidity - Average morning or afternoon humidity
75.3%
73.7%
Humidity - Differences between morning and afternoon humidity
33%
44%
Humidity - Maximum monthly morning or afternoon humidity
86%
90%
Humidity - Minimum monthly morning or afternoon humidity
53%
46%
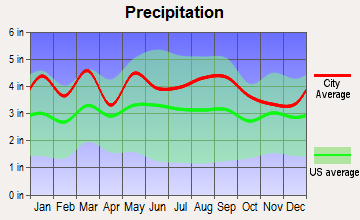
Precipitation - Yearly average
33.6 in
47.5 in
Snowfall - Yearly average
86.5 in
13.4 in
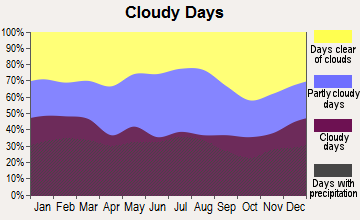
Clouds - Number of days clear of clouds
12.7%
18.5%
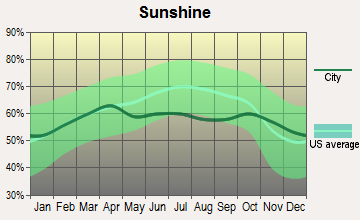
Sunshine amount - Average
56.8%
63.9%
Sunshine amount - Differences during a year
38%
13%
Sunshine amount - Maximum monthly
69%
64%
Sunshine amount - Minimum monthly
31%
51%
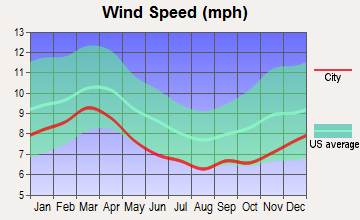
Wind speed - Average
10.2 mph
7.1 mph
Average climate in Detroit, Michigan
Average climate in Durham, North Carolina
Air pollution
Type
AQI
CO
NO2
OZONE
PB
PM10
PM25
SO2
Year
Detroit
Durham
Detroit
Durham
Detroit
Durham
Detroit
Durham
Detroit
Durham
Detroit
Durham
Detroit
Durham
2018
90
70
0.44
0.23
12.9
8.0
25.8
27.9
N/A
N/A
12.7
N/A
10.1
8.8
1.1
0.3
2017
87
68
0.56
0.23
12.7
8.6
20.9
25.8
N/A
N/A
13.3
N/A
10.1
9.2
1.3
0.2
2016
86
79
0.47
0.23
13.2
8.5
22.0
25.8
N/A
N/A
7.9
N/A
10.9
9.4
0.8
0.3
2015
95
78
0.49
0.27
14.8
8.9
26.5
27.6
N/A
N/A
12.4
N/A
11.9
9.0
1.2
0.5
2014
95
74
0.48
0.26
14.2
9.7
24.2
29.7
N/A
N/A
N/A
N/A
12.0
8.2
1.7
0.3
2013
80
73
0.53
0.26
14.4
N/A
24.5
26.4
N/A
N/A
N/A
N/A
11.0
8.0
1.3
0.2
2012
99
77
0.49
0.28
14.6
N/A
25.7
29.0
N/A
N/A
N/A
N/A
6.6
8.4
1.7
0.6
2011
94
83
0.32
0.27
12.9
N/A
24.3
32.0
N/A
N/A
N/A
N/A
6.5
9.8
1.6
0.7
2010
96
94
0.28
0.30
11.8
N/A
24.7
31.2
0.006
N/A
N/A
N/A
12.1
10.1
1.6
1.0
2009
68
78
0.27
0.33
12.7
N/A
23.4
25.3
N/A
N/A
N/A
N/A
N/A
9.8
1.9
1.0
2008
67
95
0.27
0.39
12.8
N/A
N/A
30.1
N/A
N/A
N/A
N/A
N/A
13.1
2.0
1.5
2007
81
98
0.29
0.40
13.7
N/A
25.8
35.4
0.017
N/A
N/A
N/A
N/A
13.9
N/A
1.2
2006
63
90
0.31
0.43
14.0
N/A
19.8
30.1
0.022
N/A
N/A
N/A
N/A
13.5
3.2
0.9
2005
83
73
0.36
0.41
17.4
N/A
22.6
31.4
0.019
N/A
N/A
N/A
N/A
N/A
4.0
2.5
2004
70
63
0.43
0.44
15.0
N/A
N/A
27.9
0.014
N/A
N/A
N/A
N/A
N/A
3.7
3.7
2003
86
84
0.40
N/A
18.5
N/A
N/A
29.4
0.013
N/A
N/A
N/A
N/A
N/A
4.8
3.0
2002
88
89
0.36
N/A
18.3
N/A
N/A
35.3
0.019
N/A
N/A
N/A
N/A
N/A
4.3
2.6
2001
83
86
0.36
N/A
19.0
N/A
N/A
30.7
0.020
N/A
N/A
N/A
N/A
N/A
4.4
2.2
2000
71
102
0.35
0.65
18.2
N/A
N/A
32.4
0.027
N/A
N/A
N/A
N/A
N/A
5.2
N/A
Natural disasters
Type
Detroit
Durham
Tornado activity compared to U.S. average
128.5%
84.9%
Earthquake activity compared to U.S. average
53.2%
55.7%
Natural disasters compared to U.S. average
14%
16%
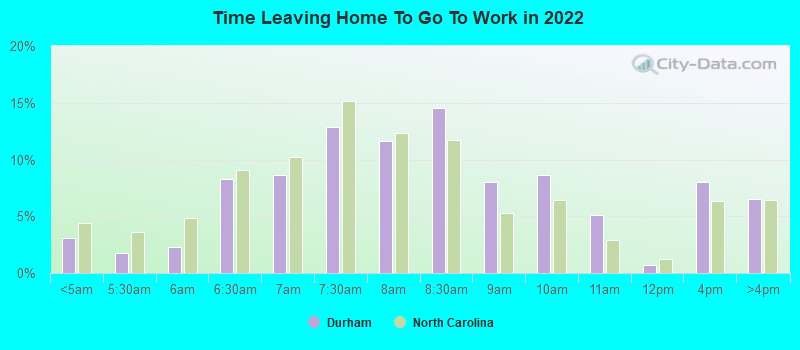
Transportation
Durham has a reasonably efficient public transportation system, and most residents benefit from short commuting times. Detroit's public transport system includes buses, people movers, and a light rail line, but many residents rely on cars for commuting.
Transport
Type
Detroit
Durham
Amtrak stations
1
1
Amtrak stations nearby
3
2
FAA registered aircraft
93
100
FAA registered aircraft manufacturers and dealers
3
4
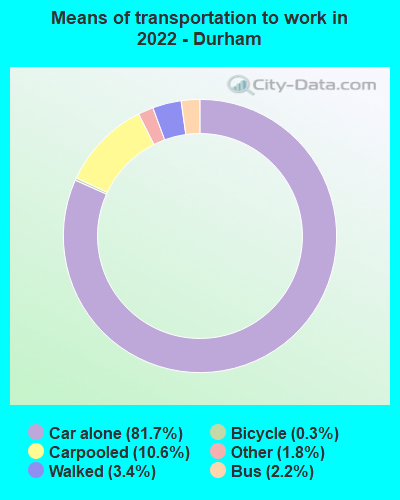
Means of transportation to work
Type
Detroit
Durham
Bicycle
0.5%
0.6%
Bus
4%
1.3%
Carpooled
7.5%
9.3%
Car alone
83.4%
84.4%
Railroad
0%
0.1%
Taxicab
0.5%
0.2%
Walked
2.7%
2.1%
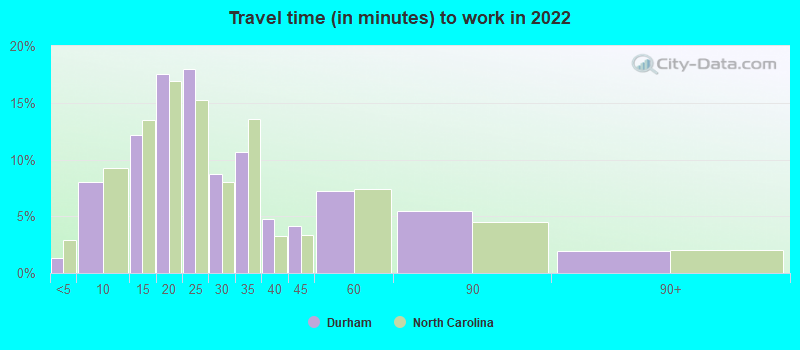
Average travel time to work
Type
Detroit
Durham
Average
30.6 min
27.4 min
Other means
26 min
21.3 min
Public transportation
47.7 min
36.9 min
Private vehicle occupancy
Type
Detroit
Durham
Average
1.2
1.2
Drove alone
87.1%
89.5%
In 2 person carpool
10.5%
7.9%
In 3 person carpool
1%
2.2%
In 4 person carpool
1%
0.1%
In 5-6 person carpool
0.3%
0%
In 7+ person carpool
0.2%
0.4%
How many people usually rode to work in the car, truck or van.
Real Estate
In Detroit, real estate prices are below the national average, offering opportunities for investment and affordable homes. Durham's real estate market, while pricier, is less volatile and shows consistent growth in home values.
Neighborhoods
Each city offers a range of neighborhoods to suit different lifestyles. Detroit has seen neighborhood revitalization, with areas like Midtown becoming increasingly trendy. Durham, featuring neighborhoods from historic districts to new suburban developments, is known for its tight-knit communities.
Houses and residents
Type
Detroit
Durham
Houses
322,906
131,917
Average household size (people)
2.6
2.3
Median year apartment built
1953
1994
Median year house/condo built
1946
1995
Length of stay in the house since moving in
16.7 years
10.7 years
Houses occupied
251,729 (78%)
122,412 (92.8%)
Houses occupied by owners
129,084 (51.3%)
62,550 (51.1%)
Houses occupied by renters
122,645 (48.7%)
59,862 (48.9%)
Median rent asked for vacant for-rent units
$798.06
$2,314
Median monthly housing costs
$755
$1,261
Median price asked for vacant for-sale houses and condos
$86,452
$117,283
Estimated median house or condo value
$69,300
$325,000
Median numbers of rooms
5.7
5.1
Median number of rooms in apartments
5
4
Median number of rooms in houses and condos
6.3
6.6
Median house price - detached houses
$96,752
$361,977
Median house price - in 2-unit structures
$72,631
$169,611
Median house price - in 3-to-4-unit structures
$183,952
$259,774
Median house price - in 5 or more unit structures
$242,851
$194,008
Median house price - mobile homes
$43,864
$83,086
Median house price - Townhouses or other attached units
$128,652
$286,940
Median house price - All housing units
$101,554
$350,027
Median house age
74
26
Renting percentage
48.9%
50.2%
Housing density (houses/condos per square mile)
2,326.9
1,394
House value disparities
48.4%
29.7%
Household income disparities
49.3%
44.4%
Median household income for houses/condes with a mortgage
$61,259
$106,360
Median household income for apartments without a mortgage
$38,901
$79,496
Housing units without a mortgage
2,599 (5.6%)
1,538 (3.1%)
Housing units with both a second mortgage and home equity loan
2,270 (4.9%)
3,157 (6.4%)
Housing units with a mortgage
43,675 (94.4%)
47,533 (96.9%)
Housing units with a home equity loan
357 (0.8%)
99 (0.2%)
Housing units with a second mortgage
3,466 (7.5%)
3,728 (7.6%)
House/condo owner moved in on average (years ago)
16
6
House/condo renter moved in on average (years ago)
4
1
Housing units lacking complete kitchen facilities
17.1%
1.1%
Housing units lacking complete plumbing facilities
13.6%
0.6%
Housing units in structures
Housing units in structures
Detroit
Durham
One, detached
66.0%
50.1%
One, attached
6.1%
9.8%
Two
6.5%
2.5%
3 or 4
2.7%
5.2%
5 to 9
2.2%
8.5%
10 to 19
2.7%
11.1%
20 to 49
3.9%
4.5%
50 or more
9.4%
8.1%
Mobile homes
0.5%
0.3%
Median real estate property taxes paid for housing units
Self-employed workers in own not incorporated business
11,725
5,381
State government workers
8,763
13,743
Unpaid family workers
441
371
Industries and Occupations
In Detroit, manufacturing remains a key industry, though healthcare, technology, and renewable energy are growing sectors. Durham has a dynamic job sector, known for opportunities in academia, healthcare, tech, and biotech, thanks to the Research Triangle Park.
Healthcare in Detroit has improved in recent years, lead by the Detroit Medical Center and Henry Ford Health System. Durham is known for its superior healthcare, mainly due to the renowned Duke University Health System.
Health (county statistics)
Type
Detroit
Durham
General health status score of residents in this county from 1 (poor) to 5 (excellent)
Durham enjoys a well-maintained infrastructure, with ongoing investments in public amenities. Detroit's infrastructure, while improving, has faced challenges due to economic struggles. However, revitalization projects are addressing these issues, with the focus on rebuilding and modernizing essential infrastructure.
Infrastructure
Type
Detroit
Durham
Hospitals
41
18
TV stations
16
25
Arenas or stadiums
4
1
Bank branches located here
98
63
Bank institutions located here
12
14
Main business address for public companies
11
7
Drinking water stations with no reported violations in the past
5
2
Drinking water stations with reported violations in the past
HMDA - Conventional home purchase loans - Applications denied
Year
Detroit
Durham
1999
2,901
991
2000
4,079
666
2001
3,815
510
2002
3,247
440
2003
5,511
369
2004
9,068
485
2005
13,958
593
2006
16,654
846
2007
10,742
610
2008
2,823
231
2009
484
144
Culture and Food
Both cities boast vibrant cultural scenes. Detroit's rich history of music, cars, and sports is hard to beat, as is its burgeoning food scene with its Coney Island hotdogs and Detroit-style pizza. Durham, known as the "Foodie Capital of the South," celebrates a unique blend of rich southern heritage, academic culture, and a burgeoning culinary and arts scene.
Sports Teams
For sports fans, Detroit’s professional sports scene is very appealing, with teams in all major leagues, such as the Tigers (MLB), Lions (NFL), Pistons (NBA), and Red Wings (NHL). Durham, while lacking a professional sports team of its own, is home to the minor league baseball team Durham Bulls and Duke University’s Blue Devils.


 Detroit, MI
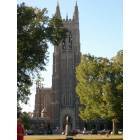
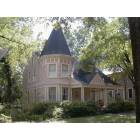
 Durham, NC