Detroit, Michigan and Chesapeake, Virginia are two uniquely different cities offering diverse living conditions. Detroit is a city experiencing a rebirth after an economic setback, awash with rich history and culture, while Chesapeake is a family-friendly city known for its low crime rate and high quality of life. Of course,like any metropolis, both have their pros and cons, and this looks at aspects like crime/safety, weather, cost of living, and education among others.
Distance between
Detroit, MI and
Chesapeake, VA : 531.1 miles
Detroit's population is larger by 152%. Its population has decreased by 318,806 people (33.5%) since 2000. The population of Chesapeake has grown by 52,085 people (26.1%) during that time.
Detroit, unfortunately, has a reputaion for high crime rates, particularly in certain neighborhoods. However, recent times have seen improvement, thanks to various revitalization initiatives. For tourists, downtown areas are generally safe and well policed. Conversely, Chesapeake boasts one of the lowest crime rates in Virginia, making it an ideal location for families and a safer destination for tourists.
City-data.com crime index counts serious crimes and violent crime more heavily. It adjusts for the number of visitors and daily workers commuting into cities. (higher means more crime, U.S. average = 301.1)
City-data.com crime index counts serious crimes and violent crime more heavily. It adjusts for the number of visitors and daily workers commuting into cities. (higher means more crime, U.S. average = 301.1)
Sex Offenders
According to our data, there are 3,462 registered sex offenders living in Detroit and 478 registered sex offenders living in . The ratio of residents to sex offenders in Detroit is 194 to 1; the ratio in Chesapeake is 494 to 1. The number of registered sex offenders compared to the number of residents is much larger in Detroit than that in Chesapeake.
Cost of Living
Living in Detroit is generally more affordable than in Chesapeake. The cost difference reflects in areas like housing, entertainment and groceries. However, Chesapeake residents often enjoy higher incomes, partly offsetting the higher cost of living.
Income Tax
Another financial aspect to consider is income tax. Detroit has city income tax in addition to state tax, while Chesapeake residents only need to concern themselves with the Virginia state income tax.
Property Tax
When it comes to property tax, Chesapeake has lower rates than Detroit. This difference could potentially offset some of Chesapeake's higher housing costs over time.
Sales Tax
Both cities have similar sales tax rates, though Michigan's slightly lower. State and city sales taxes are general expenses to consider when comparing these cities.
Income
Type
Detroit
Chesapeake
Estimated median household income
$36,140
$88,815
Estimated per capita income
$22,122
$39,875
Cost of living index (U.S. average is 100)
94.1
96.1
If you make $50,000 in Detroit, you will have to make $51,063 in Chesapeake to maintain the same standard of living.
Geographical Conditions
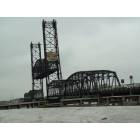
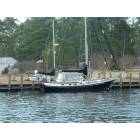
Detroit sits near the US-Canada border and borders the Great Lakes, while Chesapeake is located on the Atlantic seaboard in a landscape dominated by waterways and rich greenery.
The cities have their strengths in education. Detroit is home to prestigious universities like Wayne State University and the University of Detroit Mercy. Chesapeake, though lacking in large universities, prides itself on its K-12 system, widely regarded as one of the best in the state.
Detroit’s economy, once heavily centered around auto manufacturing, has diversified into sectors like healthcare and technology. Chesapeake's economy, while diversified, has strong concentrations in the military, government, and healthcare sectors.
Biggest Employers
Detroit’s biggest employer is the Detroit Medical Center. In Chesapeake, that accolade goes to Chesapeake Regional Healthcare.
There were 10 building permits issued in Detroit in 2012 (8 less than in 2011) compared to 942 building permits issued in Chesapeake in 2012 (289 more than in 2011).
In Detroit (Wayne County), 73.1% voted for Democrats and 26.2% for Republicans in 2012 Presidential Election. In Chesapeake (Chesapeake city), 50.1% voted for Democrats and 49.1% for Republicans.
Elections
Type
Democrats
Republicans
Other
Year
Detroit
Chesapeake
Detroit
Chesapeake
Detroit
Chesapeake
2020
68.6%
52.2%
30.4%
45.8%
1.0%
2.0%
2016
66.6%
46.7%
29.4%
48.0%
4.0%
5.3%
2012
73.1%
50.1%
26.2%
49.1%
0.6%
0.8%
2008
74.4%
50.5%
24.7%
49.2%
0.9%
0.3%
2004
69.7%
42.4%
29.9%
57.3%
0.4%
0.3%
2000
69.1%
45.2%
29.1%
53.4%
1.8%
1.4%
1996
69.0%
45.8%
24.0%
46.7%
7.0%
7.5%
Breakdown of population affiliated with a religious congregation
Type
Adherents
Congregations
Religion
Detroit
Chesapeake
Detroit
Chesapeake
CATHOLIC CHURCH
16.3%
5.9%
11.2%
2.5%
MUSLIM ESTIMATE
3.7%
1.5%
2.9%
0.5%
AMERICAN BAPTIST CHURCHES IN THE USA
1.5%
0.0%
2.4%
0.5%
LUTHERAN CHURCH
1.2%
0.1%
3.9%
1.0%
EVANGELICAL LUTHERAN CHURCH IN AMERICA
0.7%
0.1%
2.8%
0.5%
EPISCOPAL CHURCH
0.4%
0.4%
2.5%
1.0%
SEVENTH DAY ADVENTIST CHURCH
0.4%
0.2%
1.4%
2.5%
SOUTHERN BAPTIST CONVENTION
0.4%
10.7%
3.2%
19.1%
Weather
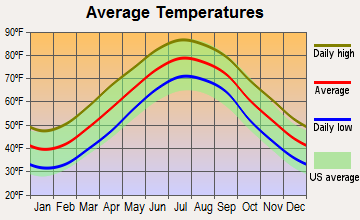
Detroit experiences a continental climate, with warm summers, cold winters, and notable snowfall. The city is also prone to infrequent natural disasters. On the other hand, Chesapeake enjoys mild weather and seasons, though it is susceptible to hurricanes due to its coastal location.
Weather and climate
Type
Detroit
Chesapeake
Temperature - Average
50°F
59.5°F
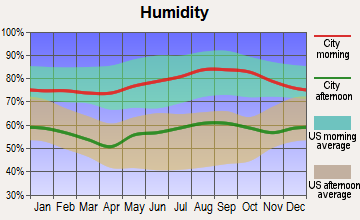
Humidity - Average morning or afternoon humidity
75.3%
73%
Humidity - Differences between morning and afternoon humidity
33%
32%
Humidity - Maximum monthly morning or afternoon humidity
86%
83%
Humidity - Minimum monthly morning or afternoon humidity
53%
51%
Precipitation - Yearly average
33.6 in
48.1 in
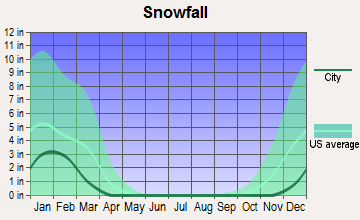
Snowfall - Yearly average
86.5 in
15.4 in
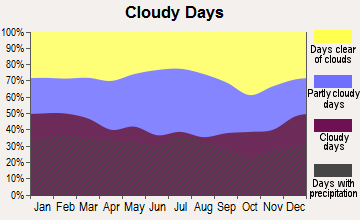
Clouds - Number of days clear of clouds
12.7%
17.6%
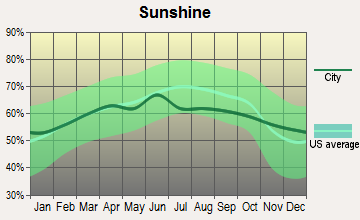
Sunshine amount - Average
56.8%
66.8%
Sunshine amount - Differences during a year
38%
14%
Sunshine amount - Maximum monthly
69%
67%
Sunshine amount - Minimum monthly
31%
53%
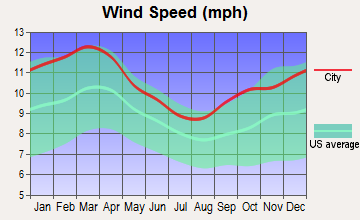
Wind speed - Average
10.2 mph
10.4 mph
Average climate in Detroit, Michigan
Average climate in Chesapeake, Virginia
Air pollution
Type
AQI
CO
NO2
OZONE
PB
PM25
SO2
Year
Detroit
Chesapeake
Detroit
Chesapeake
Detroit
Chesapeake
Detroit
Chesapeake
Detroit
Chesapeake
Detroit
Chesapeake
Detroit
Chesapeake
2018
90
57
0.44
0.29
12.9
6.7
25.8
30.8
N/A
0.002
10.1
6.1
1.1
0.3
2017
87
60
0.56
0.23
12.7
7.3
20.9
32.9
N/A
0.002
10.1
6.9
1.3
0.3
2016
86
66
0.47
0.22
13.2
7.0
22.0
31.3
N/A
0.002
10.9
6.1
0.8
0.3
2015
95
57
0.49
0.27
14.8
7.8
26.5
33.4
N/A
0.002
11.9
6.4
1.2
0.5
2014
95
59
0.48
0.28
14.2
8.0
24.2
33.4
N/A
0.002
12.0
6.8
1.7
1.2
2013
80
66
0.53
0.28
14.4
7.5
24.5
30.8
N/A
0.002
11.0
6.8
1.3
1.2
2012
99
76
0.49
0.29
14.6
8.2
25.7
34.1
N/A
0.002
6.6
8.1
1.7
1.1
2011
94
66
0.32
0.27
12.9
9.9
24.3
34.7
N/A
0.003
6.5
8.8
1.6
1.7
2010
96
71
0.28
0.24
11.8
4.8
24.7
38.1
0.006
0.004
12.1
N/A
1.6
2.2
2009
68
51
0.27
0.25
12.7
9.7
23.4
31.5
N/A
0.012
N/A
N/A
1.9
2.7
2008
67
77
0.27
0.24
12.8
10.3
N/A
36.2
N/A
0.004
N/A
N/A
2.0
3.4
2007
81
81
0.29
0.17
13.7
12.2
25.8
36.6
0.017
0.004
N/A
N/A
N/A
4.5
2006
63
62
0.31
0.33
14.0
N/A
19.8
36.8
0.022
0.004
N/A
N/A
3.2
3.4
2005
83
67
0.36
0.28
17.4
N/A
22.6
35.7
0.019
N/A
N/A
N/A
4.0
3.4
2004
70
80
0.43
0.29
15.0
15.9
N/A
33.6
0.014
N/A
N/A
N/A
3.7
4.3
2003
86
84
0.40
0.34
18.5
16.2
N/A
34.6
0.013
N/A
N/A
N/A
4.8
4.0
2002
88
99
0.36
0.40
18.3
17.8
N/A
38.2
0.019
N/A
N/A
N/A
4.3
6.1
2001
83
92
0.36
0.42
19.0
18.2
N/A
36.6
0.020
N/A
N/A
N/A
4.4
6.1
2000
71
85
0.35
0.44
18.2
15.7
N/A
36.9
0.027
N/A
N/A
N/A
5.2
6.6
Natural disasters
Type
Detroit
Chesapeake
Tornado activity compared to U.S. average
128.5%
72.4%
Earthquake activity compared to U.S. average
53.2%
36.3%
Natural disasters compared to U.S. average
14%
0%
Transportation
Detroit has an extensive public transport system with buses and the People Mover train system along with major expressways and Detroit Metropolitan Airport. Chesapeake’s smaller size means commutes can be shorter and less frustrating compared to larger cities.
Transport
Type
Detroit
Chesapeake
Amtrak stations
1
0
Amtrak stations nearby
3
3
FAA registered aircraft
93
168
FAA registered aircraft manufacturers and dealers
3
3
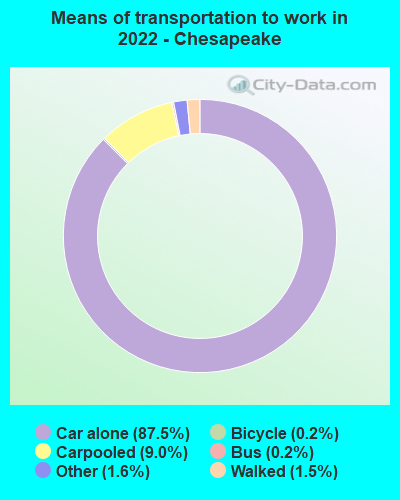
Means of transportation to work
Type
Detroit
Chesapeake
Bicycle
0.5%
0.1%
Bus
4%
0.3%
Carpooled
7.5%
9.9%
Car alone
83.4%
86.3%
Taxicab
0.5%
0.1%
Walked
2.7%
2.5%
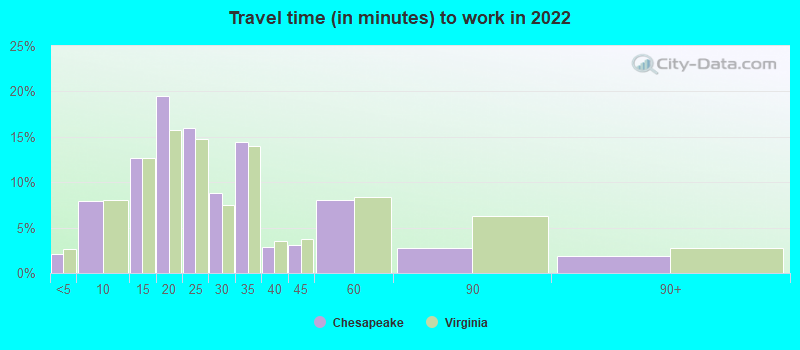
Average travel time to work
Type
Detroit
Chesapeake
Average
30.6 min
24.7 min
Other means
26 min
24.8 min
Public transportation
47.7 min
42 min
Private vehicle occupancy
Type
Detroit
Chesapeake
Average
1.2
1.1
Drove alone
87.1%
90.8%
In 2 person carpool
10.5%
7.5%
In 3 person carpool
1%
1.2%
In 4 person carpool
1%
0.4%
In 5-6 person carpool
0.3%
0.1%
In 7+ person carpool
0.2%
0.1%
How many people usually rode to work in the car, truck or van.
Real Estate
Real-estate prices in Detroit generally tend to be lower, making it a more accessible market for home ownership. Conversely, price tag in Chesapeake is higher but with the benefit of a steady real-estate market and higher-quality housing.
Neighborhoods
Both cities have diverse neighborhoods. Detroit offers a mix of historic and newly-developed neighborhoods. Chesapeake is well-regarded for family-friendly neighborhoods, which often provide lush green spaces and community amenities.
Houses and residents
Type
Detroit
Chesapeake
Houses
322,906
96,040
Average household size (people)
2.6
2.8
Median year apartment built
1953
1985
Median year house/condo built
1946
1990
Length of stay in the house since moving in
16.7 years
12.2 years
Houses occupied
251,729 (78%)
93,849 (97.7%)
Houses occupied by owners
129,084 (51.3%)
69,186 (73.7%)
Houses occupied by renters
122,645 (48.7%)
24,663 (26.3%)
Median rent asked for vacant for-rent units
$798.06
$1,502
Median monthly housing costs
$755
$1,483
Median price asked for vacant for-sale houses and condos
$86,452
$319,618
Estimated median house or condo value
$69,300
$320,600
Median numbers of rooms
5.7
6.7
Median number of rooms in apartments
5
4.4
Median number of rooms in houses and condos
6.3
7.5
Median house price - detached houses
$96,752
$345,910
Median house price - in 2-unit structures
$72,631
$123,576
Median house price - in 3-to-4-unit structures
$183,952
$136,311
Median house price - in 5 or more unit structures
$242,851
$134,590
Median house price - mobile homes
$43,864
$35,812
Median house price - Townhouses or other attached units
$128,652
$274,340
Median house price - All housing units
$101,554
$330,444
Median house age
74
33
Renting percentage
48.9%
27%
Housing density (houses/condos per square mile)
2,326.9
281.9
House value disparities
48.4%
27.1%
Household income disparities
49.3%
41%
Median household income for houses/condes with a mortgage
$61,259
$115,958
Median household income for apartments without a mortgage
$38,901
$71,224
Housing units without a mortgage
2,599 (5.6%)
1,697 (3.1%)
Housing units with both a second mortgage and home equity loan
2,270 (4.9%)
4,439 (8.2%)
Housing units with a mortgage
43,675 (94.4%)
52,330 (96.9%)
Housing units with a home equity loan
357 (0.8%)
61 (0.1%)
Housing units with a second mortgage
3,466 (7.5%)
5,413 (10%)
House/condo owner moved in on average (years ago)
16
9
House/condo renter moved in on average (years ago)
4
1
Housing units lacking complete kitchen facilities
17.1%
1.2%
Housing units in structures
Housing units in structures
Detroit
Chesapeake
One, detached
66.0%
69.6%
One, attached
6.1%
10.4%
Two
6.5%
2.3%
3 or 4
2.7%
2.9%
5 to 9
2.2%
4.6%
10 to 19
2.7%
3.6%
20 to 49
3.9%
2.5%
50 or more
9.4%
2.7%
Mobile homes
0.5%
1.4%
Median real estate property taxes paid for housing units
Self-employed workers in own not incorporated business
11,725
5,430
State government workers
8,763
3,079
Unpaid family workers
441
728
Industries and Occupations
Auto Industry still remains a significant industry in Detroit, but healthcare and technology are growing sectors. Chesapeake is home to many military personnel due to its proximity to military installations, but also has thriving healthcare and real estate sectors.
Both cities provide substantial healthcare service, with Detroit having an array of top-ranked hospitals, and Chesapeake offering quality healthcare through Chesapeake Regional Healthcare.
Health (county statistics)
Type
Detroit
Chesapeake
General health status score of residents in this county from 1 (poor) to 5 (excellent)
Detroit, being a larger city, has an extensive infrastructure with wide array of amenities. Chesapeake, a suburban-styled city, has its advantages too with its clean, well-maintained streets and residential areas.
Infrastructure
Type
Detroit
Chesapeake
Hospitals
41
5
TV stations
16
25
Bank branches located here
98
50
Bank institutions located here
12
15
Main business address for public companies
11
2
Drinking water stations with no reported violations in the past
5
3
Drinking water stations with reported violations in the past
HMDA - Conventional home purchase loans - Applications denied
Year
Detroit
Chesapeake
1999
2,901
0
2000
4,079
0
2001
3,815
0
2002
3,247
0
2003
5,511
461
2004
9,068
749
2005
13,958
820
2006
16,654
834
2007
10,742
561
2008
2,823
171
2009
484
75
Culture and Food
Culturally, Detroit has a vibrant art scene, a rich musical heritage, and a burgeoning food scene. Chesapeake has a more sedate and relaxed cultural vibe, but is close enough to places like Virginia Beach and Norfolk to offer easy access to larger cultural and culinary scenes.
Sports Teams
Sports enthusiasts would love Detroit, home to teams in all four major sports leagues. In contrast, Chesapeake doesn’t host any major sports teams but the city’s geography makes it a haven for outdoor sports and recreation.


 Detroit, MI
 Chesapeake, VA