Dallas, Texas, and Stockton, California, offer differing experiences for both residents and visitors alike, shaped by unique geographical, economical, and cultural factors. Dallas, the third-largest city in Texas, is known for its large economy, vibrant culture, and seasonally variable weather while Stockton, located in California's San Joaquin Valley, is recognized for its rich history, temperate climate, and its community-oriented environment. The differences in crime rates, cost of living, weather conditions, education, work opportunities, and transportation options between the two cities provide various considerations for potential relocators or tourists.
Distance between
Dallas, TX and
Stockton, CA : 1,421.7 miles
Dallas's population is larger by 300%. Its population has grown by 99,877 people (8.4%) since 2000. The population of Stockton has grown by 78,349 people (32.1%) during that time.
Although both cities have areas of high and low crime, Dallas has somewhat higher crime rates compared to the national average, with more incidences of violent and property crimes compared to Stockton. However, areas of both cities have seen improvements in reducing crime. Dallas has numerous community policing initiatives, while Stockton runs the Operation Peacekeeper program focusing on gang prevention. For tourists, it's recommended to be aware of your surroundings, particularly in crowded areas or after dark.
City-data.com crime index counts serious crimes and violent crime more heavily. It adjusts for the number of visitors and daily workers commuting into cities. (higher means more crime, U.S. average = 301.1)
City-data.com crime index counts serious crimes and violent crime more heavily. It adjusts for the number of visitors and daily workers commuting into cities. (higher means more crime, U.S. average = 301.1)
Sex Offenders
According to our data, there are 4,288 registered sex offenders living in Dallas and 1,026 registered sex offenders living in . The ratio of residents to sex offenders in Dallas is 307 to 1; the ratio in Stockton is 299 to 1. The number of registered sex offenders compared to the number of residents in Dallas is near to than in Stockton.
Cost of Living
The cost of living in Dallas is somewhat lower than in Stockton, due to Texas's overall lower cost of housing, goods and services, and healthcare. However, the city also has a slightly lower median household income. Meanwhile, Stockton's cost of living is higher, primarily due to more expensive housing and cost of goods. Potential residents or visitors should consider their income levels and budget when evaluating the living costs in each city.
Income Tax
Texas does not levy a state income tax, which can be an attractive feature for potential Dallas residents. California, however, does have a state income tax, which can range from 1% to 13.3% depending upon income. This can affect residents' overall earnings in Stockton versus Dallas.
Property Tax
Despite having no income tax, Texas has relatively high property tax rates, with Dallas County sitting at around 2.67%. On the other hand, California's property tax rate is generally lower, at around 0.76% in San Joaquin County, where Stockton is located.
Sales Tax
Texas has no state income tax, making Dallas attractive for those with higher incomes. The state sales tax is 6.25%, with Dallas adding an additional 2%. Stockton, in contrast, resides in California where the state sales tax is lower at 6%, but with a higher city rate of 3% for a total of 9% sales tax.
Income
Type
Dallas
Stockton
Estimated median household income
$57,995
$69,844
Estimated per capita income
$38,479
$26,811
Cost of living index (U.S. average is 100)
96.1
99.1
If you make $50,000 in Dallas, you will have to make $51,561 in Stockton to maintain the same standard of living.
Geographical Conditions
Dallas, part of the expansive Texas plains, is considered relatively flat, while Stockton is located in the California Central Valley, surrounded by scenic farmland and close to places offering hiking and outdoor activities in the Sierra Nevada mountains. Both cities are located near bodies of water, providing additional recreational opportunities.
Education opportunities in both Dallas and Stockton are robust. Dallas is home to a number of esteemed schools and universities such as the University of Texas at Dallas and Southern Methodist University, making it attractive for families and students. Stockton houses the University of the Pacific and San Joaquin Delta College. Both cities offer a wide range of primary/secondary school options with varying quality depending on the neighborhood.
Dallas has a strong economy, with several Fortune 500 companies headquartered there. The city's economy is diverse, with strong sectors in technology, healthcare, and finance. On the other hand, Stockton's economy is largely based on agriculture and retail, but it's been diversifying into areas like telecommunications and manufacturing. Unemployment rates can be higher in Stockton, but initiatives like the Renew Stockton program aim to boost job growth.
Biggest Employers
The biggest employers in Dallas are AT&T, Texas Health Resources, and Dallas ISD. Meanwhile, in Stockton, the top employers are St Joseph's Medical Center, Stockton Unified School District, and the City of Stockton. Both cities present a mix of private and public sector job opportunities.
There were 2,245 building permits issued in Dallas in 2012 (1436 more than in 2011) compared to 548 building permits issued in Stockton in 2012 (421 more than in 2011).
In Dallas (Dallas County), 57.3% voted for Democrats and 41.8% for Republicans in 2012 Presidential Election. In Stockton (San Joaquin County), 55.6% voted for Democrats and 41.9% for Republicans.
Elections
Type
Democrats
Republicans
Other
Year
Dallas
Stockton
Dallas
Stockton
Dallas
Stockton
2020
65.1%
55.6%
33.4%
41.8%
1.4%
2.6%
2016
60.8%
53.4%
34.7%
39.2%
4.5%
7.5%
2012
57.3%
55.6%
41.8%
41.9%
1.0%
2.5%
2008
57.4%
54.2%
42.0%
43.6%
0.6%
2.2%
2004
49.0%
46.3%
50.4%
53.7%
0.5%
0.0%
2000
45.0%
47.9%
52.7%
49.1%
2.4%
3.0%
1996
46.0%
46.3%
46.8%
44.9%
7.2%
8.8%
Breakdown of population affiliated with a religious congregation
Type
Adherents
Congregations
Religion
Dallas
Stockton
Dallas
Stockton
CATHOLIC CHURCH
18.9%
26.8%
2.4%
4.0%
SOUTHERN BAPTIST CONVENTION
11.0%
1.1%
31.1%
10.2%
MUSLIM ESTIMATE
3.6%
1.5%
1.1%
2.0%
EPISCOPAL CHURCH
1.0%
0.1%
1.5%
0.7%
SEVENTH DAY ADVENTIST CHURCH
0.5%
0.7%
1.7%
3.1%
EVANGELICAL LUTHERAN CHURCH IN AMERICA
0.3%
0.2%
0.9%
0.7%
LUTHERAN CHURCH
0.3%
0.4%
0.7%
1.1%
CHRISTIAN REFORMED CHURCH NORTH AMERICA
0.0%
0.4%
0.1%
1.3%
NORTH AMERICAN BAPTIST CONFERENCE
0.0%
0.6%
0.0%
1.3%
Weather
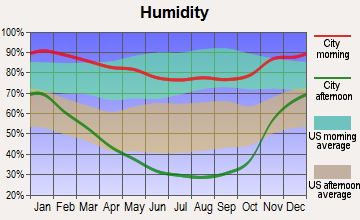
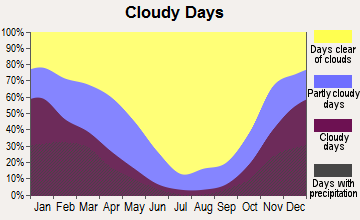
Dallas has a humid subtropical climate with hot summers and mild winters, making it a popular destination for sun-seekers. However, it also experiences occasional severe weather events such as tornadoes. Stockton, on the other hand, boasts a Mediterranean climate with hot, dry summers, and mild, rainy winters. It boasts a higher number of sunny days per year compared to the national average, making it an attractive spot for outdoor enthusiasts throughout the year.
Weather and climate
Type
Dallas
Stockton
Temperature - Average
66.6°F
60.9°F
Humidity - Average morning or afternoon humidity
71.3%
63.2%
Humidity - Differences between morning and afternoon humidity
34%
59%
Humidity - Maximum monthly morning or afternoon humidity
82%
86%
Humidity - Minimum monthly morning or afternoon humidity
48%
27%
Precipitation - Yearly average
37.3 in
16.6 in
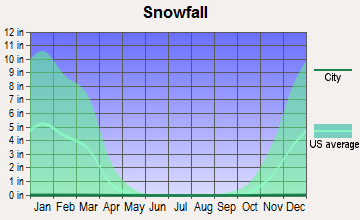
Snowfall - Yearly average
4.2 in
0 in
Clouds - Number of days clear of clouds
22.8%
30.7%
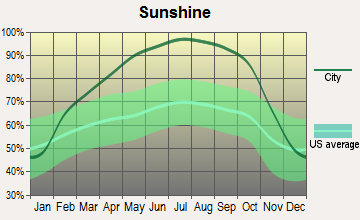
Sunshine amount - Average
66.6%
81.6%
Sunshine amount - Differences during a year
20%
44.4%
Sunshine amount - Maximum monthly
74%
91.9%
Sunshine amount - Minimum monthly
54%
47.5%
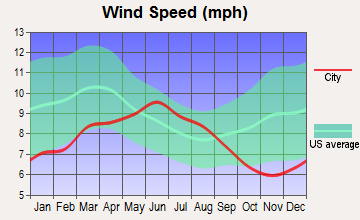
Wind speed - Average
10.3 mph
8.3 mph
Average climate in Dallas, Texas
Average climate in Stockton, California
Air pollution
Type
AQI
CO
NO2
OZONE
PB
PM10
PM25
SO2
Year
Dallas
Stockton
Stockton
Dallas
Stockton
Dallas
Stockton
Dallas
Stockton
Stockton
Dallas
Stockton
Dallas
Stockton
2018
86
124
0.30
N/A
5.7
12.2
28.7
23.2
N/A
0.006
30.5
N/A
9.7
16.5
0.4
0.8
2017
84
108
0.29
N/A
5.5
11.3
28.6
23.4
N/A
0.005
27.4
N/A
9.1
12.3
0.3
1.5
2016
81
111
0.26
N/A
6.1
12.2
27.2
21.7
N/A
0.005
22.2
N/A
8.4
12.7
0.2
1.5
2015
85
113
0.27
N/A
6.5
11.9
26.7
24.0
N/A
0.005
26.3
N/A
8.9
12.7
0.3
1.0
2014
83
109
0.26
N/A
6.3
13.4
27.6
26.1
N/A
0.005
26.9
N/A
9.9
11.5
0.3
0.8
2013
97
111
0.31
N/A
7.3
15.5
28.8
23.8
N/A
0.005
29.8
N/A
13.0
15.7
0.2
0.6
2012
116
114
0.19
N/A
8.6
14.4
31.0
24.2
N/A
0.005
24.0
N/A
12.0
12.4
0.3
0.7
2011
98
105
0.25
N/A
9.4
15.5
30.9
22.1
N/A
0.003
23.5
N/A
11.9
12.6
0.6
0.9
2010
79
96
0.14
N/A
9.4
13.9
28.3
21.9
N/A
0.003
14.0
N/A
N/A
9.1
0.7
1.1
2009
88
98
0.20
N/A
9.2
15.3
28.8
21.1
N/A
0.005
15.8
N/A
N/A
6.0
0.5
1.0
2008
88
107
0.26
N/A
9.8
16.8
29.2
22.7
0.121
N/A
24.7
N/A
N/A
10.2
0.5
1.1
2007
94
110
0.34
N/A
11.0
16.4
25.7
21.5
0.070
0.009
19.5
N/A
N/A
12.5
0.3
1.1
2006
107
94
0.41
N/A
10.8
18.4
30.6
22.1
0.106
N/A
N/A
N/A
N/A
N/A
0.7
2.1
2005
108
81
0.44
N/A
13.0
17.2
29.7
20.1
0.142
N/A
N/A
N/A
11.0
N/A
0.9
2.0
2004
96
82
0.47
N/A
12.3
17.1
26.0
19.9
0.099
N/A
25.2
N/A
N/A
N/A
0.8
1.6
2003
102
89
0.55
N/A
13.6
18.4
27.1
19.1
0.121
N/A
26.1
N/A
N/A
N/A
1.0
2.2
2002
100
86
0.53
N/A
14.0
20.5
25.2
18.9
0.080
0.007
29.2
N/A
N/A
N/A
0.4
2.5
2001
100
97
0.54
N/A
14.3
19.4
26.0
19.7
0.069
0.006
28.3
N/A
N/A
N/A
1.0
2.1
2000
109
99
0.64
N/A
14.5
21.2
27.0
18.9
0.092
0.007
25.9
N/A
N/A
N/A
1.1
1.6
Natural disasters
Type
Dallas
Stockton
Tornado activity compared to U.S. average
254.7%
10.1%
Earthquake activity compared to U.S. average
567%
8,060.1%
Natural disasters compared to U.S. average
21%
20%
Transportation
Public transport in Dallas is provided by DART (Dallas Area Rapid Transit), offering bus and light rail services. Dallas also has a strong road network for commuters. In comparison, Stockton offers public transit through the San Joaquin Regional Transit District, and also has a well-established road network. However, Dallas has more frequent public transportation and typically less traffic, making commuting somewhat easier.
Transport
Type
Dallas
Stockton
Amtrak stations
1
2
Amtrak stations nearby
1
3
FAA registered aircraft
2
146
FAA registered aircraft manufacturers and dealers
56
9
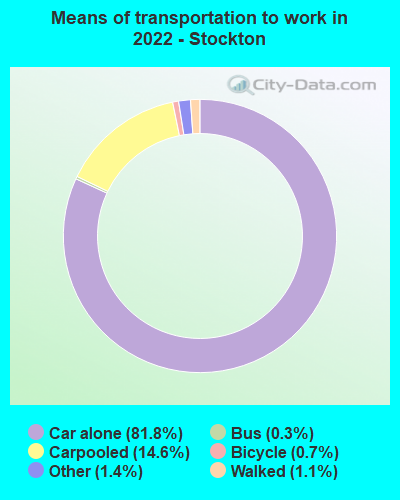
Means of transportation to work
Type
Dallas
Stockton
Bicycle
0.3%
0.2%
Bus
1.4%
0.6%
Carpooled
10.9%
13.3%
Car alone
83.9%
83.6%
Ferryboat
0%
0.1%
Railroad
0.2%
0.1%
Subway
0.2%
0.1%
Taxicab
0.1%
0%
Walked
1.6%
1%
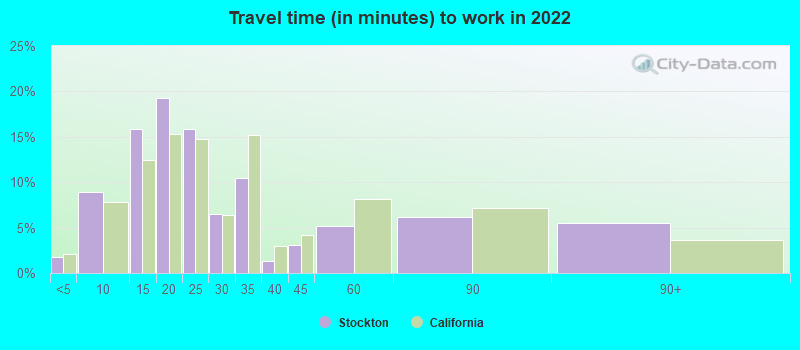
Average travel time to work
Type
Dallas
Stockton
Average
31.5 min
29.9 min
Other means
26.5 min
26.4 min
Public transportation
46 min
44.5 min
Private vehicle occupancy
Type
Dallas
Stockton
Average
1.2
1.2
Drove alone
86.8%
86.7%
In 2 person carpool
9%
8.9%
In 3 person carpool
2.6%
2.5%
In 4 person carpool
0.9%
0.7%
In 5-6 person carpool
0.5%
1%
In 7+ person carpool
0.2%
0.3%
How many people usually rode to work in the car, truck or van.
Real Estate
Dallas's real estate market is dynamic and competitive, driven by the city's population growth and economic strength. The housing market in Stockton is less competitive but has seen considerable growth in recent years. The median home price in Dallas is slightly higher than in Stockton, although both cities offer a variety of housing options, from apartments to single-family homes.
Neighborhoods
Dallas's neighborhoods range from the upscale, such as Highland Park and Uptown, to the trendy like Deep Ellum or the Bishop Arts District. The variability in neighborhood character provides options for a diverse range of lifestyles and budgets. Stockton also offers a mix of neighborhoods, from the suburban Brookside and Morada, to Downtown with its historical character and dynamic redevelopment projects.
Houses and residents
Type
Dallas
Stockton
Houses
591,773
102,642
Average household size (people)
2.6
3.2
Median year apartment built
1987
1977
Median year house/condo built
1969
1983
Length of stay in the house since moving in
13.9 years
13.2 years
Houses occupied
536,008 (90.6%)
97,447 (94.9%)
Houses occupied by owners
229,518 (42.8%)
53,081 (54.5%)
Houses occupied by renters
306,490 (57.2%)
44,366 (45.5%)
Median rent asked for vacant for-rent units
$1,403
$586.05
Median monthly housing costs
$1,225
$1,381
Median price asked for vacant for-sale houses and condos
$574,934
$363,278
Estimated median house or condo value
$267,600
$382,900
Median numbers of rooms
4.6
5.3
Median number of rooms in apartments
3.7
4.4
Median number of rooms in houses and condos
6.1
6.2
Median house price - detached houses
$410,272
$374,875
Median house price - in 2-unit structures
$255,160
$434,326
Median house price - in 3-to-4-unit structures
$230,927
$234,826
Median house price - in 5 or more unit structures
$444,589
$243,924
Median house price - mobile homes
$91,039
$146,499
Median house price - Townhouses or other attached units
$350,045
$256,924
Median house price - All housing units
$402,215
$367,426
Median house age
40
42
Renting percentage
55.9%
48.4%
Housing density (houses/condos per square mile)
1,727.6
1,876.1
House value disparities
41.3%
23.2%
Household income disparities
48.2%
42.3%
Median household income for houses/condes with a mortgage
$103,798
$102,856
Median household income for apartments without a mortgage
$61,909
$70,897
Housing units without a mortgage
1,309 (1%)
338 (0.9%)
Housing units with both a second mortgage and home equity loan
3,320 (2.6%)
2,064 (5.6%)
Housing units with a mortgage
124,846 (99%)
36,674 (99.1%)
Housing units with a home equity loan
204 (0.2%)
329 (0.9%)
Housing units with a second mortgage
5,351 (4.2%)
2,814 (7.6%)
House/condo owner moved in on average (years ago)
12
11
House/condo renter moved in on average (years ago)
1
4
Housing units lacking complete kitchen facilities
1.2%
2.3%
Housing units lacking complete plumbing facilities
0.9%
1%
Housing units in structures
Housing units in structures
Dallas
Stockton
One, detached
41.8%
68.0%
One, attached
4.3%
6.7%
Two
1.5%
2.6%
3 or 4
4.9%
5.0%
5 to 9
7.9%
4.2%
10 to 19
12.1%
4.3%
20 to 49
8.1%
3.3%
50 or more
18.4%
4.6%
Mobile homes
1.0%
1.3%
Boats, RVs, vans, etc.
0.0%
0.1%
Median real estate property taxes paid for housing units
Self-employed workers in own not incorporated business
43,703
7,637
State government workers
17,325
6,210
Unpaid family workers
754
95
Industries and Occupations
Dallas's largest industries include technology, financial services, and healthcare, offering a wide range of occupations. Stockton, on the other hand, is heavily oriented towards agriculture, retail, and manufacturing jobs. Both cities, however, have seen growth in technology-related jobs, presenting opportunities for professionals in this sector.
Dallas boasts some top-rated hospitals like the University of Texas Southwestern Medical Center and Baylor University Medical Center, making it an attractive destination for healthcare. Stockton also supports healthcare needs through organizations like St. Joseph's Medical Center and Dameron Hospital.
Dallas benefits from robust infrastructure, including a comprehensive motorway network and a large international airport, Dallas/Fort Worth International. Stockton also has a strategic location with access to several freeways, an airport, and a seaport. Both cities have seen significant investments in infrastructure in recent years, including public transport and urban development projects.
Infrastructure
Type
Dallas
Stockton
Hospitals
74
17
TV stations
25
14
Arenas or stadiums
2
2
Bank branches located here
394
54
Bank institutions located here
80
19
Main business address for public companies
122
2
Drinking water stations with no reported violations in the past
8
14
Drinking water stations with reported violations in the past
HMDA - Conventional home purchase loans - Applications denied
Year
Dallas
Stockton
1999
5,030
548
2000
3,390
606
2001
2,626
597
2002
2,657
622
2003
3,617
1,557
2004
5,460
2,481
2005
7,445
3,201
2006
7,397
3,075
2007
5,056
1,611
2008
2,200
744
2009
1,121
362
Culture and Food
Dallas is known for dynamic cultural scenes and world-class dining, with Southwestern and Mexican cuisine a particular highlight. Cultural institutions such as the Dallas Museum of Art and the AT&T Performing Arts Center showcase the city's vibrant arts scene. In contrast, Stockton offers unique cultural experiences like the historic Bob Hope Theatre and food heavily influenced by Central Valley produce and its diverse demographics.
Sports Teams
Sports are a big deal in Dallas, home to major sports franchises like the Dallas Cowboys (NFL), Dallas Mavericks (NBA), and Texas Rangers (MLB). Stockton has minor league teams like the Stockton Ports (baseball) and Stockton Heat (hockey) but is within reach of franchises in nearby San Francisco and Oakland.


 Dallas, TX
 Stockton, CA