Dallas and Plano are two attractive cities in the state of Texas, each with its own unique offerings. Dallas, a metropolis known for its vibrant cultural scene and economic prospects, presents various lifestyle opportunities. On the other hand, Plano, a suburb of Dallas, is recognized for its excellent education system and high standard of living. While both cities have their distinct advantages, their overall sense of community, economic prospects, and quality of life warrant careful consideration for those planning to relocate or visit.
Distance between
Dallas, TX and
Plano, TX : 17.5 miles
Dallas's population is larger by 347%. Its population has grown by 99,877 people (8.4%) since 2000. The population of Plano has grown by 66,223 people (29.8%) during that time.
Dallas has a higher crime rate compared to Plano. While Dallas is improving its crime rates yearly and investing in neighborhood security, it's still an aspect to consider. On the other hand, Plano consistently ranks as one of the safest cities in America, with a low crime rate which is particularly attractive for families or individuals valuing security highly. Both cities invest in community policing strategies and have responsive law enforcement agencies.
City-data.com crime index counts serious crimes and violent crime more heavily. It adjusts for the number of visitors and daily workers commuting into cities. (higher means more crime, U.S. average = 301.1)
City-data.com crime index counts serious crimes and violent crime more heavily. It adjusts for the number of visitors and daily workers commuting into cities. (higher means more crime, U.S. average = 301.1)
Sex Offenders
According to our data, there are 4,288 registered sex offenders living in Dallas and 131 registered sex offenders living in . The ratio of residents to sex offenders in Dallas is 307 to 1; the ratio in Plano is 2,184 to 1. The number of registered sex offenders compared to the number of residents is much larger in Dallas than that in Plano.
Cost of Living
The cost of living in Dallas is generally lower than in Plano. Dallas offers a wide range of housing options suitable for different budgets. However, Plano, known for its upscale residential areas and quality services, tends to have a higher average cost of living, but it's accompanied by the perceived increase in quality of life.
Income Tax
Texas is one of the states that does not impose a state income tax, which applies to both Dallas and Plano residents. This absence of state income tax can lead to significant financial savings for residents.
Property Tax
The property tax in Plano tends to be slightly higher than in Dallas, reflecting the higher home values in Plano. Both cities' rates are higher than the national average, yet they help fund public services, particularly in education, which is of high standard especially in Plano.
Sales Tax
Both Dallas and Plano have the same sales tax rate which is a combination of the Texas state sales tax and a district tax. Neither city has a unique sales tax, and the total rate is competitive relative to other states and cities.
Income
Type
Dallas
Plano
Estimated median household income
$57,995
$95,002
Estimated per capita income
$38,479
$49,792
Cost of living index (U.S. average is 100)
96.1
96.2
If you make $50,000 in Dallas, you will have to make $50,052 in Plano to maintain the same standard of living.
Geographical Conditions
Dallas is relatively flat with some hilly areas and is larger in terms of land area. The Trinity River is a notable geographical feature. Plano, also largely flat, is smaller and has a suburban layout.
Schools in Plano are highly rated, known for their outstanding academic performance, making it an enticing city for families. Dallas, while having some top-rated schools, has more variability in school district performance. Both cities have access to higher education with several universities and colleges in the vicinity.
Dallas, as a significant economic hub, offers a more diversified job market with opportunities in various sectors such as energy, healthcare, and information technology, while Plano's economy is primarily driven by sectors like retail, technology, and education. Although unemployment rates are relatively similar in both cities, this diversification could be advantageous for job seekers in Dallas.
Biggest Employers
While Dallas' largest employers include Baylor Health Care System and Dallas Independent School district, Plano's job market is dominated by large corporations like JC Penney and Frito-Lay which have their headquarters here.
There were 2,245 building permits issued in Dallas in 2012 (1436 more than in 2011) compared to 321 building permits issued in Plano in 2012 (28 less than in 2011).
In Dallas (Dallas County), 57.3% voted for Democrats and 41.8% for Republicans in 2012 Presidential Election. In Plano (Collin County), 33.6% voted for Democrats and 65.2% for Republicans.
Elections
Type
Democrats
Republicans
Other
Year
Dallas
Plano
Dallas
Plano
Dallas
Plano
2020
65.1%
47.1%
33.4%
51.4%
1.4%
1.5%
2016
60.8%
39.0%
34.7%
55.7%
4.5%
5.4%
2012
57.3%
33.6%
41.8%
65.2%
1.0%
1.2%
2008
57.4%
36.7%
42.0%
62.3%
0.6%
1.0%
2004
49.0%
28.2%
50.4%
71.3%
0.5%
0.6%
2000
45.0%
24.5%
52.7%
73.2%
2.4%
2.3%
1996
46.0%
28.5%
46.8%
63.0%
7.2%
8.5%
Breakdown of population affiliated with a religious congregation
Type
Adherents
Congregations
Religion
Dallas
Plano
Dallas
Plano
CATHOLIC CHURCH
18.9%
14.2%
2.4%
1.6%
SOUTHERN BAPTIST CONVENTION
11.0%
10.1%
31.1%
29.1%
MUSLIM ESTIMATE
3.6%
2.9%
1.1%
1.9%
EPISCOPAL CHURCH
1.0%
0.2%
1.5%
1.0%
SEVENTH DAY ADVENTIST CHURCH
0.5%
0.1%
1.7%
0.8%
EVANGELICAL LUTHERAN CHURCH IN AMERICA
0.3%
0.3%
0.9%
1.0%
LUTHERAN CHURCH
0.3%
0.8%
0.7%
1.4%
Weather
Both Dallas and Plano share similar weather patterns being in the same geographical locale. Expect hot, humid summers and mild to cool winters. Spring and fall offer the most pleasant weather, with temperatures comfortable for outdoor activities. Dallas can have slightly more polluted air due to higher industrial activity and traffic.
Weather and climate
Type
Dallas
Plano
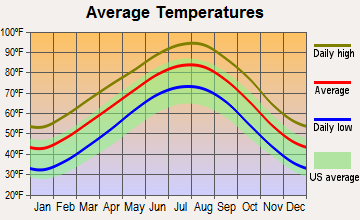
Temperature - Average
66.6°F
64.2°F
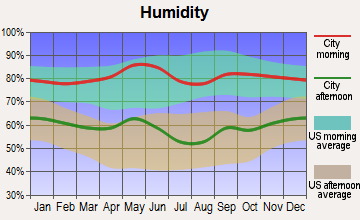
Humidity - Average morning or afternoon humidity
71.3%
71.3%
Humidity - Differences between morning and afternoon humidity
34%
34%
Humidity - Maximum monthly morning or afternoon humidity
82%
82%
Humidity - Minimum monthly morning or afternoon humidity
48%
48%
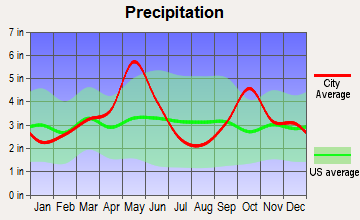
Precipitation - Yearly average
37.3 in
40.2 in
Snowfall - Yearly average
4.2 in
4.2 in
Clouds - Number of days clear of clouds
22.8%
22.8%
Sunshine amount - Average
66.6%
66.6%
Sunshine amount - Differences during a year
20%
20%
Sunshine amount - Maximum monthly
74%
74%
Sunshine amount - Minimum monthly
54%
54%
Wind speed - Average
10.3 mph
10.3 mph
Average climate in Dallas, Texas
Average climate in Plano, Texas
Air pollution
Type
AQI
NO2
OZONE
PB
PM25
SO2
Year
Dallas
Plano
Dallas
Plano
Dallas
Plano
Dallas
Plano
Dallas
Plano
Dallas
Plano
2018
86
85
5.7
5.8
28.7
30.1
N/A
N/A
9.7
9.7
0.4
0.4
2017
84
84
5.5
5.8
28.6
31.4
N/A
N/A
9.1
9.1
0.3
0.3
2016
81
77
6.1
6.4
27.2
29.9
N/A
N/A
8.4
8.4
0.2
0.2
2015
85
84
6.5
7.2
26.7
30.0
N/A
N/A
8.9
8.9
0.3
0.3
2014
83
83
6.3
6.1
27.6
30.9
N/A
N/A
9.9
9.9
0.3
0.3
2013
97
95
7.3
7.0
28.8
32.2
N/A
N/A
13.0
13.0
0.2
0.2
2012
116
112
8.6
8.5
31.0
34.3
N/A
N/A
12.0
12.0
0.3
0.3
2011
98
98
9.4
9.1
30.9
33.9
N/A
N/A
11.9
11.9
0.6
0.6
2010
79
78
9.4
9.7
28.3
30.8
N/A
N/A
N/A
N/A
0.7
0.7
2009
88
86
9.2
9.6
28.8
31.5
N/A
N/A
N/A
N/A
0.5
0.5
2008
88
82
9.8
9.9
29.2
32.3
0.121
0.121
N/A
N/A
0.5
0.5
2007
94
89
11.0
10.3
25.7
29.7
0.070
0.070
N/A
N/A
0.3
0.3
2006
107
103
10.8
10.5
30.6
33.7
0.106
0.106
N/A
N/A
0.7
0.7
2005
108
105
13.0
13.2
29.7
32.6
0.142
0.142
11.0
11.0
0.9
0.9
2004
96
92
12.3
11.8
26.0
29.2
0.099
0.099
N/A
N/A
0.8
0.8
2003
102
100
13.6
13.9
27.1
30.3
0.121
0.121
N/A
N/A
1.0
1.0
2002
100
96
14.0
14.3
25.2
29.1
0.080
0.080
N/A
N/A
0.4
0.4
2001
100
99
14.3
12.8
26.0
30.6
0.069
0.069
N/A
N/A
1.0
1.0
2000
109
107
14.5
14.5
27.0
31.7
0.092
0.092
N/A
N/A
1.1
1.1
Natural disasters
Type
Dallas
Plano
Tornado activity compared to U.S. average
254.7%
252.9%
Earthquake activity compared to U.S. average
567%
596.9%
Natural disasters compared to U.S. average
21%
14%
Transportation
Both cities offer public transit systems, with Dallas offering more extensive options due to its size, including light rail and buses. Plano is part of the Dallas Area Rapid Transit (DART) system, but reliance on cars is still significant due to its suburban nature.
Transport
Type
Dallas
Plano
Amtrak stations
1
0
Amtrak stations nearby
1
1
FAA registered aircraft
2
266
FAA registered aircraft manufacturers and dealers
56
11
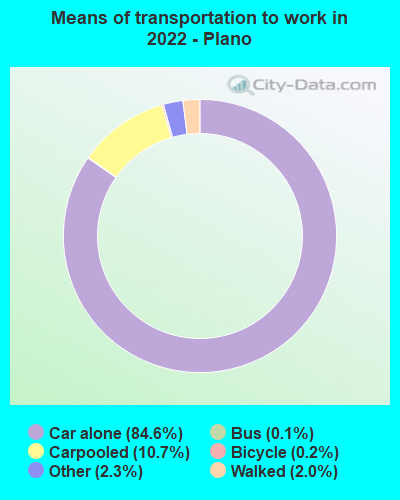
Means of transportation to work
Type
Dallas
Plano
Bicycle
0.3%
0.1%
Bus
1.4%
0.4%
Carpooled
10.9%
7.8%
Car alone
83.9%
89.2%
Railroad
0.2%
0%
Subway
0.2%
0%
Taxicab
0.1%
0%
Walked
1.6%
1.2%
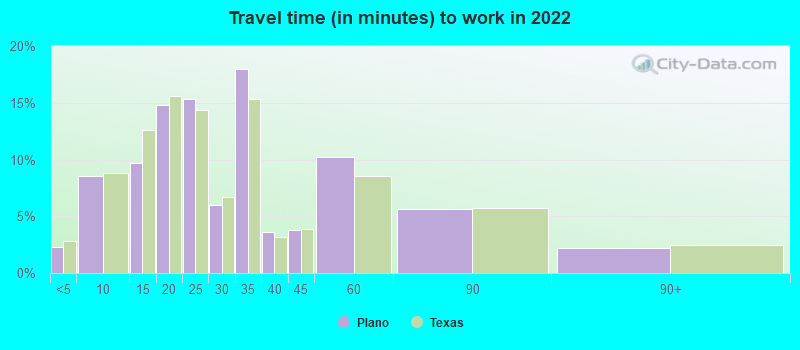
Average travel time to work
Type
Dallas
Plano
Average
31.5 min
28.8 min
Other means
26.5 min
28.4 min
Public transportation
46 min
59 min
Private vehicle occupancy
Type
Dallas
Plano
Average
1.2
1.1
Drove alone
86.8%
89.9%
In 2 person carpool
9%
8.8%
In 3 person carpool
2.6%
0.8%
In 4 person carpool
0.9%
0.2%
In 5-6 person carpool
0.5%
0.2%
In 7+ person carpool
0.2%
0%
How many people usually rode to work in the car, truck or van.
Real Estate
The real estate market in Dallas offers a broader range of options in terms of price and style, from urban lofts to suburban homes. However, Plano's real estate is more expensive on average, reflecting its higher average income, quality of lifestyle, and demand for properties in the city's top-rated school districts.
Neighborhoods
Dallas offers diverse neighborhoods, from the artsy Bishop Arts District to the upscale Uptown area. Plano's neighborhoods, on the other hand, are more homogeneous but are known for their safety, cleanliness, and family-friendly environment.
Houses and residents
Type
Dallas
Plano
Houses
591,773
114,797
Average household size (people)
2.6
2.6
Median year apartment built
1987
1996
Median year house/condo built
1969
1990
Length of stay in the house since moving in
13.9 years
13 years
Houses occupied
536,008 (90.6%)
108,472 (94.5%)
Houses occupied by owners
229,518 (42.8%)
60,883 (56.1%)
Houses occupied by renters
306,490 (57.2%)
47,589 (43.9%)
Median rent asked for vacant for-rent units
$1,403
$1,491
Median monthly housing costs
$1,225
$1,599
Median price asked for vacant for-sale houses and condos
$574,934
$1,044,402
Estimated median house or condo value
$267,600
$387,200
Median numbers of rooms
4.6
6.1
Median number of rooms in apartments
3.7
4
Median number of rooms in houses and condos
6.1
7.6
Median house price - detached houses
$410,272
$447,315
Median house price - in 2-unit structures
$255,160
$154,744
Median house price - in 3-to-4-unit structures
$230,927
$260,615
Median house price - in 5 or more unit structures
$444,589
$210,357
Median house price - mobile homes
$91,039
$112,806
Median house price - Townhouses or other attached units
$350,045
$325,999
Median house price - All housing units
$402,215
$437,302
Median house age
40
28
Renting percentage
55.9%
37%
Housing density (houses/condos per square mile)
1,727.6
1,604.1
House value disparities
41.3%
23.4%
Household income disparities
48.2%
41.5%
Median household income for houses/condes with a mortgage
$103,798
$134,911
Median household income for apartments without a mortgage
$61,909
$110,429
Housing units without a mortgage
1,309 (1%)
744 (2%)
Housing units with both a second mortgage and home equity loan
3,320 (2.6%)
1,681 (4.4%)
Housing units with a mortgage
124,846 (99%)
37,102 (98%)
Housing units with a home equity loan
204 (0.2%)
86 (0.2%)
Housing units with a second mortgage
5,351 (4.2%)
2,508 (6.6%)
House/condo owner moved in on average (years ago)
12
13
House/condo renter moved in on average (years ago)
1
1
Housing units lacking complete kitchen facilities
1.2%
1.9%
Housing units lacking complete plumbing facilities
0.9%
0%
Housing units in structures
Housing units in structures
Dallas
Plano
One, detached
41.8%
60.2%
One, attached
4.3%
3.5%
Two
1.5%
0.8%
3 or 4
4.9%
3.0%
5 to 9
7.9%
7.3%
10 to 19
12.1%
9.1%
20 to 49
8.1%
3.2%
50 or more
18.4%
12.1%
Mobile homes
1.0%
0.8%
Median real estate property taxes paid for housing units
Self-employed workers in own not incorporated business
43,703
7,541
State government workers
17,325
4,098
Unpaid family workers
754
57
Industries and Occupations
Dallas houses several Fortune 500 companies like Southwest Airlines and AT&T, driving its economy. Predominant industries involve telecommunications, financial services, and medical research. On the other hand, Plano is home to key players in the technology sector, with major employers like HP and Capital One.
Dallas has more health care facilities than Plano, boasting large hospitals like UT Southwestern and Parkland Hospital. Nonetheless, Plano offers high-quality health care services and has reputable facilities such as Texas Health Presbyterian Hospital.
Dallas' infrastructure is more developed due to its size and status as a major city. This development includes more hospitals, amusement parks, shopping centers, and restaurants. Plano, though smaller, has a well-maintained infrastructure suitable for its residential-centered appeal. Both cities have open parks and recreational areas for residents and tourists.
Infrastructure
Type
Dallas
Plano
Hospitals
74
15
TV stations
25
25
Bank branches located here
394
115
Bank institutions located here
80
42
Main business address for public companies
122
17
Drinking water stations with no reported violations in the past
8
0
Drinking water stations with reported violations in the past
HMDA - Conventional home purchase loans - Applications denied
Year
Dallas
Plano
1999
5,030
825
2000
3,390
258
2001
2,626
199
2002
2,657
204
2003
3,617
655
2004
5,460
921
2005
7,445
1,145
2006
7,397
1,104
2007
5,056
750
2008
2,200
384
2009
1,121
213
Culture and Food
Dallas boasts a rich cultural scene, with numerous museums, art galleries, and performance venues. Its culinary scene is also diverse, with renowned Tex-Mex and barbecue spots. Plano has a quieter cultural scene but offers a high-quality suburban lifestyle with excellent family-friendly dining options.
Sports Teams
Sports lovers would be more attracted to Dallas, home to the Dallas Cowboys (NFL), Dallas Mavericks (NBA), and Texas Rangers (MLB). Plano residents are quite close to these sporting events as well, thanks to the cities' proximity.


 Dallas, TX
 Plano, TX