Comparing Columbus and Worcester means looking at two distinct and vibrant American cities, each with their own appeal and advantages. Whether you're considering a relocation or just a visit, understanding the nuances of each city can help you make an informed decision. Factors such as crime rates, cost of living, education options, economic prospects, infrastructure, industries, employers, real estate market, neighborhoods, public transit, taxation, culture, sports, geography, and health care all play critical roles.
Distance between
Columbus, OH and
Worcester, MA : 602.6 miles
Columbus's population is larger by 340%. Its population has grown by 195,058 people (27.4%) since 2000. The population of Worcester has grown by 33,270 people (19.3%) during that time.
Columbus' overall crime rate is higher than the national average, making safety a concern for residents and visitors alike. While police presence is visible downtown and in crime hotspots, it remains a concern worth addressing. Comparatively, Worcester's crime rate is slightly lower than Columbus's, but still exceeds the national average. The city has been implementing measures to reduce crime, particularly in specific neighbourhoods.
City-data.com crime index counts serious crimes and violent crime more heavily. It adjusts for the number of visitors and daily workers commuting into cities. (higher means more crime, U.S. average = 301.1)
City-data.com crime index counts serious crimes and violent crime more heavily. It adjusts for the number of visitors and daily workers commuting into cities. (higher means more crime, U.S. average = 301.1)
Sex Offenders
According to our data, there are 1,576 registered sex offenders living in Columbus and 242 registered sex offenders living in . The ratio of residents to sex offenders in Columbus is 547 to 1; the ratio in Worcester is 762 to 1. The number of registered sex offenders compared to the number of residents is larger in Columbus than in Worcester.
Cost of Living
The cost of living in Columbus is generally lower than in Worcester. Essentials like housing, groceries, and transportation tend to be more affordable in Columbus. Worcester's cost of living falls above the national average, due in large part to the high housing costs in Massachusetts.
Income Tax
Both Ohioans (including Columbus residents) and Massachusetts residents (including Worcester) are obligated to pay state income tax, with Ohio's tax rates slightly lower than Massachusetts.
Property Tax
Property tax rates are higher in Worcester, aligning with Massachusetts' general level, while Columbus maintains below-average property tax rates.
Sales Tax
Columbus residents pay a city sales tax, but the combined amount is lower than the national average. Worcester has no city sales tax, but the state sales tax in Massachusetts is comparable to the national average.
Income
Type
Columbus
Worcester
Estimated median household income
$58,202
$63,194
Estimated per capita income
$32,392
$32,772
Cost of living index (U.S. average is 100)
96.1
128.3
If you make $50,000 in Columbus, you will have to make $66,753 in Worcester to maintain the same standard of living.
Geographical Conditions
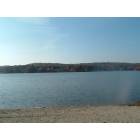
Columbus is predominantly flat, surrounded by farmland and featuring numerous parks and green spaces. Worcester, known as the "Heart of the Commonwealth," has a more hilly landscape lying between two prominent hills, offering views of the city and beyond.
Both cities feature respected educational institutions. Columbus is home to Ohio State University, one of the largest universities in the US. Worcester, on the other hand, hosts numerous colleges, including College of the Holy Cross and Worcester Polytechnic Institute, making it a noteworthy education hub.
Columbus has a robust economy with strengths in education, government, insurance, banking, fashion, defense, aviation, food, logistics, steel, energy, medical research, health care, hospitality, retail, and technology. Conversely, Worcester's economy is characterized by a mix of manufacturing, healthcare, and education sectors.
Biggest Employers
Columbus is home to many big employers like JP Morgan Chase, The Ohio State University, and Nationwide. Worcester has UMass Memorial Health Care, University of Massachusetts Medical School, and Saint Vincent Hospital as major employers.
There were 913 building permits issued in Columbus in 2012 (246 more than in 2011) compared to 66 building permits issued in Worcester in 2012 (2 more than in 2011).
In Columbus (Franklin County), 60.8% voted for Democrats and 37.9% for Republicans in 2012 Presidential Election. In Worcester (Worcester County), 53.7% voted for Democrats and 44.3% for Republicans.
Elections
Type
Democrats
Republicans
Other
Year
Columbus
Worcester
Columbus
Worcester
Columbus
Worcester
2020
64.7%
57.6%
33.4%
39.7%
1.9%
2.7%
2016
59.8%
51.0%
33.9%
40.5%
6.2%
8.5%
2012
60.8%
53.7%
37.9%
44.3%
1.3%
2.0%
2008
59.8%
55.8%
39.0%
42.0%
1.2%
2.2%
2004
54.5%
56.6%
45.2%
42.5%
0.3%
0.9%
2000
48.9%
56.2%
47.9%
36.9%
3.2%
6.9%
1996
48.1%
58.3%
44.5%
29.8%
7.3%
11.9%
Breakdown of population affiliated with a religious congregation
Type
Adherents
Congregations
Religion
Columbus
Worcester
Columbus
Worcester
CATHOLIC CHURCH
13.2%
38.4%
5.6%
20.1%
EVANGELICAL LUTHERAN CHURCH IN AMERICA
1.6%
0.8%
3.7%
2.2%
SOUTHERN BAPTIST CONVENTION
1.6%
0.2%
6.8%
3.3%
MUSLIM ESTIMATE
1.3%
0.1%
1.9%
0.3%
VINEYARD USA
1.3%
0.0%
1.2%
0.2%
AMERICAN BAPTIST CHURCHES IN THE USA
1.0%
0.7%
3.3%
4.6%
EPISCOPAL CHURCH
0.4%
1.2%
1.3%
4.8%
SEVENTH DAY ADVENTIST CHURCH
0.4%
0.8%
2.0%
4.6%
Weather
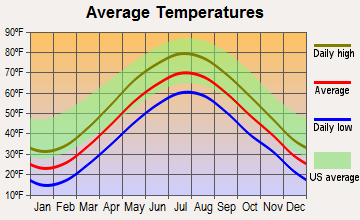
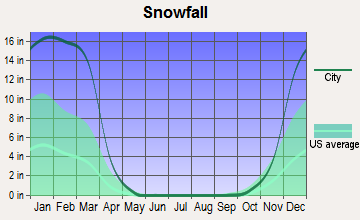
Columbus experiences a typical Midwest climate with hot, humid summers and cold, snowy winters. Spring and fall seasons tend to be pleasantly mild vis-à-vis weather. Worcester, located in the northeast, witnesses a more severe climate. Winters are notably colder and more prolonged, with considerable snowfall, while summers are typically warm and humid.
Weather and climate
Type
Columbus
Worcester
Temperature - Average
52.8°F
47.1°F
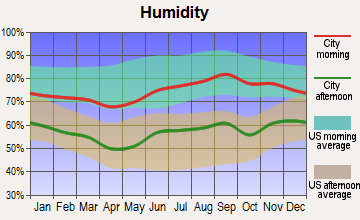
Humidity - Average morning or afternoon humidity
74.8%
71.5%
Humidity - Differences between morning and afternoon humidity
34%
32%
Humidity - Maximum monthly morning or afternoon humidity
86%
81%
Humidity - Minimum monthly morning or afternoon humidity
52%
49.1%
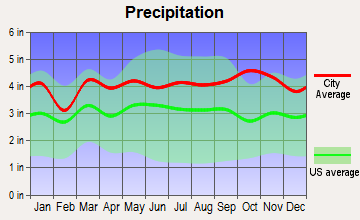
Precipitation - Yearly average
39.3 in
48.9 in
Snowfall - Yearly average
56.6 in
133.4 in
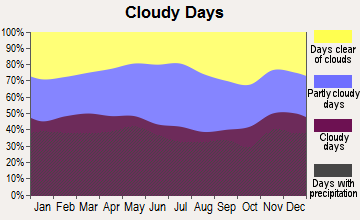
Clouds - Number of days clear of clouds
12%
15.2%
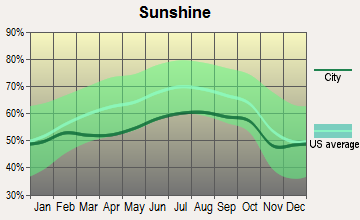
Sunshine amount - Average
49.7%
63%
Sunshine amount - Differences during a year
27%
18.5%
Sunshine amount - Maximum monthly
55%
66.3%
Sunshine amount - Minimum monthly
28%
47.8%
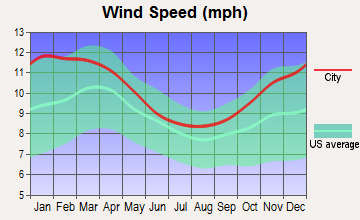
Wind speed - Average
8.2 mph
11 mph
Average climate in Columbus, Ohio
Average climate in Worcester, Massachusetts
Air pollution
Type
AQI
CO
NO2
OZONE
PM10
PM25
SO2
Year
Columbus
Worcester
Columbus
Worcester
Columbus
Worcester
Columbus
Worcester
Columbus
Columbus
Worcester
Columbus
Worcester
2018
69
71
0.11
0.28
10.0
11.2
33.8
31.5
N/A
N/A
6.0
6.8
0.0
0.6
2017
68
69
0.16
0.28
9.6
11.5
28.7
32.3
N/A
N/A
5.5
5.5
0.1
0.8
2016
76
73
0.17
0.25
10.6
12.2
28.5
33.6
N/A
N/A
5.6
6.2
0.1
0.7
2015
74
68
0.16
0.26
11.3
13.4
27.0
32.6
N/A
N/A
6.1
7.0
0.1
0.5
2014
82
71
0.20
0.32
11.0
13.1
28.5
33.2
N/A
N/A
7.4
7.7
0.5
1.5
2013
78
82
N/A
0.39
8.9
11.8
29.6
34.5
N/A
N/A
7.8
8.3
0.6
2.7
2012
87
84
N/A
0.51
N/A
12.8
32.9
37.5
N/A
N/A
8.9
7.7
N/A
3.2
2011
89
82
N/A
0.46
N/A
17.4
28.1
34.8
N/A
N/A
8.9
9.8
N/A
2.7
2010
90
88
N/A
0.50
N/A
13.9
30.5
37.4
N/A
N/A
9.1
9.9
N/A
2.1
2009
61
85
N/A
0.53
N/A
14.4
28.7
N/A
N/A
N/A
N/A
8.3
N/A
1.1
2008
65
94
N/A
0.54
N/A
14.9
31.2
38.5
N/A
N/A
N/A
8.0
1.8
2.6
2007
80
115
N/A
0.52
N/A
15.7
30.8
N/A
N/A
N/A
N/A
9.0
2.8
3.4
2006
75
98
N/A
0.53
N/A
15.2
30.0
38.7
23.7
N/A
N/A
8.8
3.3
2.8
2005
87
101
N/A
0.55
N/A
14.9
29.6
N/A
27.5
N/A
N/A
10.0
4.1
4.6
2004
77
92
N/A
0.41
N/A
15.8
27.8
N/A
24.6
N/A
N/A
11.6
4.4
2.6
2003
91
82
N/A
0.51
N/A
15.6
26.4
N/A
23.9
N/A
N/A
N/A
4.1
N/A
2002
93
87
N/A
0.52
N/A
17.4
31.3
39.0
25.7
N/A
N/A
N/A
4.1
N/A
2001
84
98
N/A
0.57
N/A
20.0
29.2
32.6
25.9
N/A
N/A
N/A
3.5
N/A
2000
57
76
N/A
0.52
N/A
18.6
N/A
31.2
23.5
N/A
N/A
N/A
3.7
N/A
Natural disasters
Type
Columbus
Worcester
Tornado activity compared to U.S. average
119.1%
79.8%
Earthquake activity compared to U.S. average
96.1%
28.4%
Natural disasters compared to U.S. average
16%
27%
Transportation
Columbus has a vast network of highways, making commuting by car common. The city also has bus and bikeshare systems. Worcester offers a decent bus system, commuter rail service to Boston, and walkable downtown areas.
Transport
Type
Columbus
Worcester
Amtrak stations
1
0
Amtrak stations nearby
1
2
FAA registered aircraft
415
21
FAA registered aircraft manufacturers and dealers
4
9
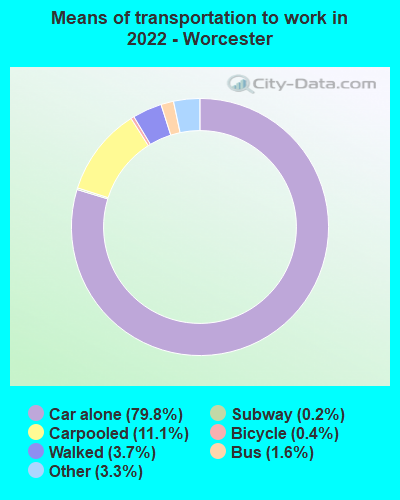
Means of transportation to work
Type
Columbus
Worcester
Bicycle
0.6%
0.4%
Bus
1.6%
1.3%
Carpooled
7.4%
9.8%
Car alone
86.7%
81.3%
Railroad
0%
0.4%
Taxicab
0.1%
0.4%
Walked
2.2%
4.6%
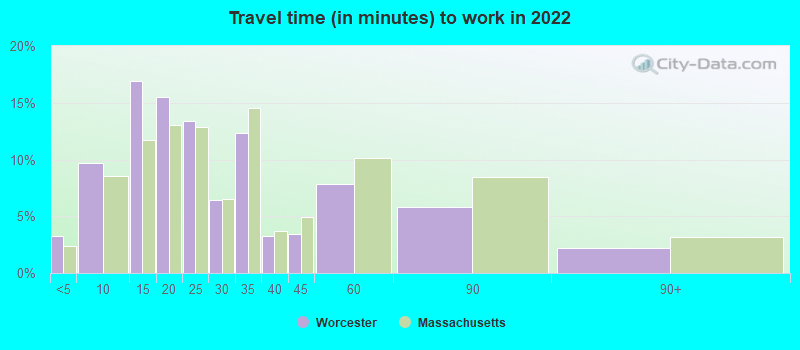
Average travel time to work
Type
Columbus
Worcester
Average
26.1 min
26.5 min
Other means
21.7 min
23.3 min
Public transportation
35.4 min
34 min
Private vehicle occupancy
Type
Columbus
Worcester
Average
1.1
1.2
Drove alone
90.7%
85.3%
In 2 person carpool
7.3%
11.9%
In 3 person carpool
1.4%
1.6%
In 4 person carpool
0.5%
0.6%
In 5-6 person carpool
0.1%
0.3%
In 7+ person carpool
0.1%
0.2%
How many people usually rode to work in the car, truck or van.
Real Estate
Columbus features a mix of suburban and urban housing options at a relatively affordable price point. Worcester's real estate encompasses a wider range, from modern condos in the city to historic homes in established neighborhoods, but houses tend to be pricier.
Neighborhoods
Each city offers distinct neighborhoods with unique characteristics. In Columbus, areas like German Village and Short North are popular. Worcester features neighborhoods like Salisbury Street and Westwood Hills, known for their charm and community feel.
Houses and residents
Type
Columbus
Worcester
Houses
422,120
82,375
Average household size (people)
2.3
2.5
Median year apartment built
1982
1960
Median year house/condo built
1977
1952
Length of stay in the house since moving in
12.6 years
15.8 years
Houses occupied
390,605 (92.5%)
76,065 (92.3%)
Houses occupied by owners
175,427 (44.9%)
32,714 (43%)
Houses occupied by renters
215,178 (55.1%)
43,351 (57%)
Median rent asked for vacant for-rent units
$1,371
$1,034
Median monthly housing costs
$1,110
$1,314
Median price asked for vacant for-sale houses and condos
$195,022
$425,443
Estimated median house or condo value
$219,200
$317,800
Median numbers of rooms
5
5.1
Median number of rooms in apartments
4.2
4.3
Median number of rooms in houses and condos
6.3
6.1
Median house price - detached houses
$233,452
$338,239
Median house price - in 2-unit structures
$121,729
$252,487
Median house price - in 3-to-4-unit structures
$215,337
$352,758
Median house price - in 5 or more unit structures
$240,711
$213,457
Median house price - Townhouses or other attached units
$218,726
$290,622
Median house price - All housing units
$229,736
$317,463
Median house age
42
67
Renting percentage
53%
55.5%
Housing density (houses/condos per square mile)
2,007.5
2,193.1
House value disparities
30.2%
25.3%
Household income disparities
42.4%
46.9%
Median household income for houses/condes with a mortgage
$89,058
$102,992
Median household income for apartments without a mortgage
$59,295
$78,632
Housing units without a mortgage
4,290 (3.3%)
687 (3%)
Housing units with both a second mortgage and home equity loan
10,651 (8.2%)
2,013 (8.8%)
Housing units with a mortgage
125,487 (96.7%)
22,130 (97%)
Housing units with a home equity loan
775 (0.6%)
289 (1.3%)
Housing units with a second mortgage
13,558 (10.4%)
2,828 (12.4%)
House/condo owner moved in on average (years ago)
10
15
House/condo renter moved in on average (years ago)
1
3
Housing units lacking complete kitchen facilities
1.6%
1.6%
Housing units lacking complete plumbing facilities
1.3%
1.1%
Housing units in structures
Housing units in structures
Columbus
Worcester
One, detached
45.8%
32.1%
One, attached
9.1%
6.4%
Two
4.0%
7.9%
3 or 4
8.6%
25.1%
5 to 9
11.8%
8.6%
10 to 19
8.6%
5.4%
20 to 49
4.5%
4.4%
50 or more
6.8%
10.0%
Mobile homes
0.8%
0.1%
Boats, RVs, vans, etc.
0.1%
0.0%
Median real estate property taxes paid for housing units
Self-employed workers in own not incorporated business
20,915
5,036
State government workers
31,881
5,706
Unpaid family workers
724
42
Industries and Occupations
In Columbus, major industries include finance, insurance, education, and healthcare. The services sector is notably thriving. Worcester's leading industries are healthcare, biotechnology, and education.
Columbus is home to some of the top hospitals in Ohio, providing excellent health care services. Worcester is similarly commended, with UMass Memorial serving as a leading health care provider in central Massachusetts.
Health (county statistics)
Type
Columbus
Worcester
General health status score of residents in this county from 1 (poor) to 5 (excellent)
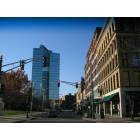
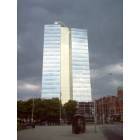
Columbus boasts modern infrastructure, with an impressive skyline highlighted by several high-rise buildings. The city maintains well-defined roads and robust public utilities. Worcester has a historic appeal with ample old buildings reflective of its rich history. Some areas, however, could benefit from infrastructural developments.
Infrastructure
Type
Columbus
Worcester
Hospitals
47
14
TV stations
14
24
Arenas or stadiums
3
2
Bank branches located here
200
47
Bank institutions located here
25
12
Main business address for public companies
23
2
Drinking water stations with no reported violations in the past
17
0
Drinking water stations with reported violations in the past
HMDA - Conventional home purchase loans - Applications denied
Year
Columbus
Worcester
1999
2,450
262
2000
2,376
328
2001
1,897
237
2002
1,483
312
2003
2,087
469
2004
3,216
822
2005
4,275
1,210
2006
4,662
1,134
2007
2,679
721
2008
1,015
375
2009
555
274
Culture and Food
Columbus offers a diverse cultural scene, including music festivals, a vibrant arts sector, and a food scene with influence from its immigrant communities. Worcester showcases its charm through historic architecture, cultural institutions, and diverse culinary offerings.
Sports Teams
Columbus sports fans cheer for the Blue Jackets (NHL) and Crew (MLS). Worcester lacks major sports teams but residents often support nearby Boston teams, including the Red Sox (MLB), Celtics (NBA), and Bruins (NHL).


 Columbus, OH
 Worcester, MA