The comparison between Columbus, OH and North Coast, CA provides an opportunity to contrast two distinctive American living experiences. While they differ significantly in culture, climate, cost of living, and lifestyle, both locations have unique appeal to visitors and potential residents alike. Columbus is a thriving Midwest city boasting a vibrant college sports scene and booming business sector, whereas North Coast, CA, known for its stunning coastal views and wine industry, offers a more laid-back lifestyle with a notably higher cost of living.
Columbus, OH has a slightly higher crime rate overall compared to the national average, while North Coast, CA tends to enjoy a lower crime rate due to its more rural and less densely populated characteristics. Both places offer safe neighborhoods, but potential residents and visitors are advised to research individual neighborhoods for specific safety details.
Cost of Living
The cost of living in Columbus, OH is significantly lower compared to North Coast, CA. The median home cost is much more affordable in Columbus. Similarly, other expenses such as groceries, healthcare, and transportation are also cheaper in Columbus. North Coast, with its prime location along the California coastline, commands a higher price tag for nearly everything, thus making it one of the expensive places to live in the country.
Income Tax
The state of Ohio has a progressive income tax, and the city of Columbus also imposes an income tax, resulting in a combined maximum rate of about 8%. California has one of the highest state income tax rates in the U.S., reaching as high as 13.3% depending on income.
Property Tax
Property taxes in Ohio are lower than the national average while in California they are higher, reflecting the higher overall cost of living in the Golden State.
Sales Tax
Ohio, including Columbus, has a combined state and local sales tax rate of around 7.5%. California's state tax rate is 7.25%, but local sales tax can push the combined rate up to 9% or more.
Income
Type
Columbus
North Coast
Estimated median household income
$58,202
$102,807
Estimated per capita income
$32,392
$50,809
Cost of living index (U.S. average is 100)
96.1
96.1
If you make $50,000 in North Coast, you will have to make $50,000 in Columbus to maintain the same standard of living.
Geographical Conditions
Columbus is located in the flat Midwestern region of the US, while North Coast, CA, is characterized by beautiful coastal cliffs, redwood forests, and rolling vineyards.
Geographical information
Type
Columbus
North Coast
Land area
210.3 sq. miles
59.4 sq. miles
Population density
4,311.3 people per sq. mile
6,335.5 people per sq. mile
Relative area comparison
Columbus, OH North Coast, CA
Education
Both Columbus, OH and North Coast, CA provide quality education options. Columbus is home to The Ohio State University, one of the country's largest universities. In contrast, North Coast offers several smaller colleges and hosts significant cultural and environmental education opportunities due to the region's biodiversity.
Columbus boasts a thriving economy with varied industries including finance, education, healthcare, and logistics. Conversely, the economy of North Coast, CA is more focused on farming, wine production, and tourism. Both regions offer good job opportunities, but the nature of the jobs varies considerably.
Biggest Employers
Some of Columbus's largest employers include Ohio State University, JP Morgan Chase, and Nationwide Insurance. In North Coast, CA, prominent employers typically consist of farming operations, wineries, and a myriad of tourism-related businesses.
In Columbus (Franklin County), 60.8% voted for Democrats and 37.9% for Republicans in 2012 Presidential Election. In North Coast (Orange County), 45.8% voted for Democrats and 52.0% for Republicans.
Elections
Type
Democrats
Republicans
Other
Year
Columbus
North Coast
Columbus
North Coast
Columbus
North Coast
2020
64.7%
53.6%
33.4%
44.6%
1.9%
1.8%
2016
59.8%
50.9%
33.9%
42.4%
6.2%
6.7%
2012
60.8%
45.8%
37.9%
52.0%
1.3%
2.3%
2008
59.8%
47.8%
39.0%
50.3%
1.2%
1.9%
2004
54.5%
39.3%
45.2%
60.2%
0.3%
0.5%
2000
48.9%
40.4%
47.9%
55.9%
3.2%
3.7%
1996
48.1%
37.9%
44.5%
51.7%
7.3%
10.5%
Breakdown of population affiliated with a religious congregation
Type
Adherents
Congregations
Religion
Columbus
North Coast
Columbus
North Coast
CATHOLIC CHURCH
13.2%
26.5%
5.6%
4.4%
EVANGELICAL LUTHERAN CHURCH IN AMERICA
1.6%
0.4%
3.7%
2.3%
SOUTHERN BAPTIST CONVENTION
1.6%
2.3%
6.8%
8.8%
MUSLIM ESTIMATE
1.3%
0.8%
1.9%
1.3%
VINEYARD USA
1.3%
0.2%
1.2%
0.7%
AMERICAN BAPTIST CHURCHES IN THE USA
1.0%
0.2%
3.3%
1.7%
EPISCOPAL CHURCH
0.4%
0.4%
1.3%
1.4%
SEVENTH DAY ADVENTIST CHURCH
0.4%
0.4%
2.0%
1.3%
LUTHERAN CHURCH
0.2%
0.6%
1.0%
2.0%
REFORMED CHURCH IN AMERICA
0.0%
0.3%
0.1%
0.2%
Weather
Residents in Columbus experience a traditional four-season climate with cold winters, warm summers, and mild spring and fall seasons. On the contrary, North Coast, CA experiences a Mediterranean-like climate with cool, wet winters and dry, warm summers. The coastal influence results in milder temperature fluctuations and offers breathtaking scenic beauty.
Weather and climate
Type
Columbus
North Coast
Temperature - Average
52.8°F
64.4°F
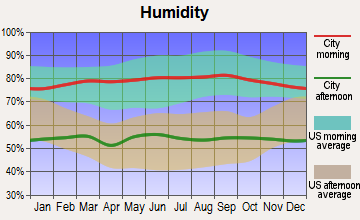
Humidity - Average morning or afternoon humidity
74.8%
70.2%
Humidity - Differences between morning and afternoon humidity
34%
26.7%
Humidity - Maximum monthly morning or afternoon humidity
86%
78.7%
Humidity - Minimum monthly morning or afternoon humidity
52%
52%
Precipitation - Yearly average
39.3 in
13 in
Snowfall - Yearly average
56.6 in
0 in
Clouds - Number of days clear of clouds
12%
26.5%
Sunshine amount - Average
49.7%
78.4%
Sunshine amount - Differences during a year
27%
21.9%
Sunshine amount - Maximum monthly
55%
84.9%
Sunshine amount - Minimum monthly
28%
62.9%
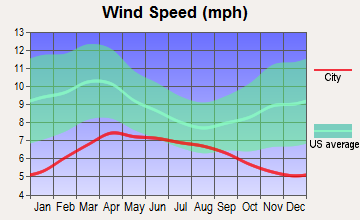
Wind speed - Average
8.2 mph
6 mph
Average climate in Columbus, Ohio
Average climate in North Coast, California
Air pollution
Type
AQI
CO
NO2
OZONE
PB
PM10
PM25
SO2
Year
Columbus
North Coast
Columbus
North Coast
Columbus
North Coast
Columbus
North Coast
North Coast
Columbus
North Coast
Columbus
North Coast
Columbus
North Coast
2018
69
119
0.11
0.35
10.0
14.4
33.8
26.1
N/A
N/A
N/A
27.5
6.0
12.6
0.0
0.7
2017
68
116
0.16
0.34
9.6
13.8
28.7
28.8
N/A
N/A
N/A
26.7
5.5
13.8
0.1
0.5
2016
76
102
0.17
0.33
10.6
12.2
28.5
29.3
N/A
N/A
N/A
24.1
5.6
12.5
0.1
0.2
2015
74
106
0.16
0.32
11.3
13.2
27.0
29.8
N/A
N/A
N/A
25.0
6.1
14.5
0.1
0.2
2014
82
110
0.20
0.29
11.0
12.9
28.5
28.6
N/A
N/A
N/A
26.7
7.4
15.5
0.5
0.4
2013
78
107
N/A
0.34
8.9
13.9
29.6
27.8
0.003
N/A
N/A
29.5
7.8
14.2
0.6
0.3
2012
87
103
N/A
0.30
N/A
12.7
32.9
26.8
0.004
N/A
N/A
28.2
8.9
14.3
N/A
0.1
2011
89
109
N/A
0.31
N/A
14.7
28.1
27.0
0.006
N/A
N/A
27.7
8.9
15.9
N/A
0.7
2010
90
102
N/A
0.33
N/A
14.3
30.5
26.2
0.011
N/A
N/A
23.6
9.1
14.0
N/A
0.6
2009
61
118
N/A
0.35
N/A
15.5
28.7
27.6
0.009
N/A
N/A
24.3
N/A
14.5
N/A
1.1
2008
65
124
N/A
0.39
N/A
16.5
31.2
28.2
0.010
N/A
N/A
29.5
N/A
21.6
1.8
1.1
2007
80
100
N/A
0.36
N/A
16.3
30.8
27.0
0.012
N/A
N/A
N/A
N/A
N/A
2.8
0.8
2006
75
114
N/A
0.40
N/A
17.2
30.0
26.4
0.007
N/A
23.7
N/A
N/A
N/A
3.3
1.3
2005
87
95
N/A
0.39
N/A
17.7
29.6
27.9
0.012
N/A
27.5
N/A
N/A
N/A
4.1
1.3
2004
77
119
N/A
0.50
N/A
19.2
27.8
30.5
0.014
N/A
24.6
N/A
N/A
N/A
4.4
1.6
2003
91
122
N/A
0.64
N/A
21.9
26.4
28.9
0.030
N/A
23.9
N/A
N/A
N/A
4.1
1.1
2002
93
106
N/A
0.65
N/A
22.0
31.3
25.5
0.018
N/A
25.7
N/A
N/A
N/A
4.1
1.8
2001
84
116
N/A
0.73
N/A
22.0
29.2
25.4
0.033
N/A
25.9
N/A
N/A
N/A
3.5
1.5
2000
57
125
N/A
0.80
N/A
24.4
N/A
24.0
0.027
N/A
23.5
N/A
N/A
N/A
3.7
1.9
Natural disasters
Type
Columbus
North Coast
Tornado activity compared to U.S. average
119.1%
18.6%
Earthquake activity compared to U.S. average
96.1%
6,843.6%
Natural disasters compared to U.S. average
16%
32%
Transportation
Public transportation and commuting are more accessible in Columbus, with a well-developed public bus system and shorter commuting times. North Coast, with its rural setting, relies heavily on private transportation, and there are longer distances to cover between destinations.
Transport
Type
Columbus
North Coast
Amtrak stations
1
0
Amtrak stations nearby
1
3
FAA registered aircraft
415
0
FAA registered aircraft manufacturers and dealers
4
0
Means of transportation to work
Type
Columbus
North Coast
Bicycle
0.6%
0.7%
Bus
1.6%
1.2%
Carpooled
7.4%
10.7%
Car alone
86.7%
81.4%
Motorcycle
0%
0.2%
Taxicab
0.1%
0%
Walked
2.2%
1.4%
Average travel time to work
Type
Columbus
North Coast
Average
26.1 min
28.8 min
Real Estate
Columbus has a vibrant real estate market with prices significantly lower than the national median. On the other hand, property in North Coast, CA is considerable more expensive due to the region's desirability and stunning natural environments.
Neighborhoods
Columbus boasts a variety of neighborhoods each one with its distinct features ranging from vibrant downtown spots to the quiet suburban areas. North Coast, CA is less urbanized, with small towns and rural communities dotting the picturesque coastline.
Houses and residents
Type
Columbus
North Coast
Houses
422,120
137,450
Average household size (people)
2.3
2.7
Houses occupied
390,605 (92.5%)
133,254 (96.9%)
Houses occupied by owners
175,427 (44.9%)
84,546 (63.4%)
Houses occupied by renters
215,178 (55.1%)
48,708 (36.6%)
Median rent asked for vacant for-rent units
$1,371
$2,340
Median price asked for vacant for-sale houses and condos
$195,022
$1,099,558
Estimated median house or condo value
$219,200
$883,291
Median number of rooms in apartments
4.2
3.9
Median number of rooms in houses and condos
6.3
6.1
Renting percentage
53%
37.7%
Housing density (houses/condos per square mile)
2,007.5
2,312.7
Household income disparities
42.4%
41.2%
Housing units without a mortgage
4,290 (3.3%)
13,396 (19.5%)
Housing units with both a second mortgage and home equity loan
10,651 (8.2%)
282 (0.4%)
Housing units with a mortgage
125,487 (96.7%)
55,188 (80.5%)
Housing units with a home equity loan
775 (0.6%)
6,297 (9.2%)
Housing units with a second mortgage
13,558 (10.4%)
7,643 (11.1%)
Housing units lacking complete kitchen facilities
1.6%
1%
Housing units lacking complete plumbing facilities
Self-employed workers in own not incorporated business
20,915
15,532
State government workers
31,881
5,751
Unpaid family workers
724
744
Industries and Occupations
In Columbus, the top sectors include education and health services, trade and transportation, and government. In North Coast, the principal industries are farming, especially wine production, and tourism-related services. Both places, therefore, offer different occupational opportunities.
Both areas offer excellent healthcare. Columbus houses several top-ranked hospitals, while the North Coast has a network of quality hospitals and unique holistic wellness opportunities, typical of California's focus on health and well-being.
Health (county statistics)
Type
Columbus
North Coast
General health status score of residents in this county from 1 (poor) to 5 (excellent)
Columbus, being a major city, enjoys a solid infrastructure with well-maintained roads, airports, public buildings, and other essential facilities. North Coast, CA, being more rural, has less developed but well-kept infrastructure, focused on serving the needs of local communities and the tourism industry.
Infrastructure
Type
Columbus
North Coast
TV stations
14
2
Culture and Food
Columbus boasts a robust cultural scene with a wide array of culinary options, arts, music, and famous college sports. North Coast, CA offers a laid-back, outdoors-focused culture with exquisite wine and food scenes, largely influenced by its agricultural bounty and wine industry.
Sports Teams
Columbus is home to several professional sports teams, including the Columbus Blue Jackets (NHL) and the Columbus Crew SC (MLS), and the beloved Ohio State Buckeyes. North Coast doesn't have professional sports teams but offers numerous outdoor recreational activities, such as hiking and water sports.
 Columbus, OH
 North Coast, CA