Columbus, OH, and Norfolk, VA, offer vibrant, unique lifestyles. Columbus, known for its rich culture, growing tech industry and reputable higher education facilities, tends to be more affordable with a serene Midwest ambiance. Norfolk, on the other hand, offers a coastal lifestyle, rich naval history, and a thriving arts scene. Whether you're considering relocating or planning a visit, understanding their differences in crime and safety, cost of living, and other vital factors can help make your decision easier.
Distance between
Columbus, OH and
Norfolk, VA : 422.5 miles
Columbus's population is larger by 286%. Its population has grown by 195,058 people (27.4%) since 2000. The population of Norfolk has grown by 686 people (0.3%) during that time.
The crime rate in Norfolk is comparatively higher than in Columbus. While both cities share concerns about crime, precautionary measures are recommended in certain neighborhoods. This fact doesn't necessarily make Norfolk less appealing; it only underscores the importance of understanding neighborhood safety scores, especially for potential residents. Tourists are typically safe in the cities' popular and tourist-friendly zones.
City-data.com crime index counts serious crimes and violent crime more heavily. It adjusts for the number of visitors and daily workers commuting into cities. (higher means more crime, U.S. average = 301.1)
City-data.com crime index counts serious crimes and violent crime more heavily. It adjusts for the number of visitors and daily workers commuting into cities. (higher means more crime, U.S. average = 301.1)
Sex Offenders
According to our data, there are 1,576 registered sex offenders living in Columbus and 841 registered sex offenders living in . The ratio of residents to sex offenders in Columbus is 547 to 1; the ratio in Norfolk is 291 to 1. The number of registered sex offenders compared to the number of residents is a smaller in Columbus than in Norfolk.
Cost of Living
In general, the cost of living tends to be lower in Columbus than in Norfolk. Housing is particularly more affordable in Columbus, making it more attractive for those looking to relocate. However, living expenses such as utilities, groceries, and health care are relatively comparable in both cities.
Income Tax
Virginia’s state income tax rates are progressive and range from 2% to 5.75%. Ohio also adopts progressive state income tax rates that range from 0% to 4.797%; however, Columbus applies an additional city income tax at 2.5%.
Property Tax
Virginia's average property tax rate is lower than Ohio's. Norfolk property owners pay an average effective property tax rate of 0.97%, compared to Columbus owners' average effective rate of 1.68%.
Sales Tax
Ohio's state sales tax, currently at 5.75%, is lower compared to Virginia at 5.3%. Whereas, the city sales tax for Columbus is 7.5% with Norfolk slightly higher at 6%.
Income
Type
Columbus
Norfolk
Estimated median household income
$58,202
$58,591
Estimated per capita income
$32,392
$33,362
Cost of living index (U.S. average is 100)
96.1
96.6
If you make $50,000 in Columbus, you will have to make $50,260 in Norfolk to maintain the same standard of living.
Geographical Conditions
Geographically, Columbus is a flat region with rivers and a significant urban forestation. Norfolk is coastal, with multiple beaches and waterfronts alongside urban areas—it's specifically located in the Hampton Roads region, which is susceptible to sea-level rise and flooding.
Both cities have a strong focus on education. Columbus is home to the renowned Ohio State University, and the overall quality of education, from primary to higher education institutions, is good. Norfolk boasts notable institutions as well, namely Old Dominion University and Eastern Virginia Medical School, but Columbus offers a stronger educational environment due to a larger number of educational institutions.
Economically, both cities have a strong base. Columbus’ economy is bolstered by the tech industry, higher education institutions, and government agencies. Norfolk's economy relies heavily on Naval facilities, shipping, and transportation industries. While Columbus has a more diverse job market, Norfolk offers unique opportunities in the maritime industry.
Biggest Employers
The largest employers in Columbus include the Ohio State University, state and federal government, and several large healthcare systems. Norfolk's biggest employer is the U.S. Department of Defense, followed by Norfolk City Public Schools and Sentara Healthcare.
There were 913 building permits issued in Columbus in 2012 (246 more than in 2011) compared to 303 building permits issued in Norfolk in 2012 (78 more than in 2011).
In Columbus (Franklin County), 60.8% voted for Democrats and 37.9% for Republicans in 2012 Presidential Election. In Norfolk (Norfolk city), 72.5% voted for Democrats and 26.8% for Republicans.
Elections
Type
Democrats
Republicans
Other
Year
Columbus
Norfolk
Columbus
Norfolk
Columbus
Norfolk
2020
64.7%
71.7%
33.4%
26.1%
1.9%
2.2%
2016
59.8%
68.4%
33.9%
25.8%
6.2%
5.8%
2012
60.8%
72.5%
37.9%
26.8%
1.3%
0.8%
2008
59.8%
71.5%
39.0%
28.2%
1.2%
0.3%
2004
54.5%
61.7%
45.2%
37.4%
0.3%
0.9%
2000
48.9%
61.8%
47.9%
35.5%
3.2%
2.7%
1996
48.1%
62.6%
44.5%
31.1%
7.3%
6.3%
Breakdown of population affiliated with a religious congregation
Type
Adherents
Congregations
Religion
Columbus
Norfolk
Columbus
Norfolk
CATHOLIC CHURCH
13.2%
4.7%
5.6%
2.6%
EVANGELICAL LUTHERAN CHURCH IN AMERICA
1.6%
0.6%
3.7%
1.1%
SOUTHERN BAPTIST CONVENTION
1.6%
6.3%
6.8%
11.6%
MUSLIM ESTIMATE
1.3%
4.2%
1.9%
1.1%
VINEYARD USA
1.3%
0.0%
1.2%
0.0%
AMERICAN BAPTIST CHURCHES IN THE USA
1.0%
3.4%
3.3%
3.7%
EPISCOPAL CHURCH
0.4%
2.0%
1.3%
3.7%
SEVENTH DAY ADVENTIST CHURCH
0.4%
0.4%
2.0%
0.7%
PRESBYTERIAN CHURCH IN AMERICA
0.0%
0.3%
0.3%
1.5%
Weather
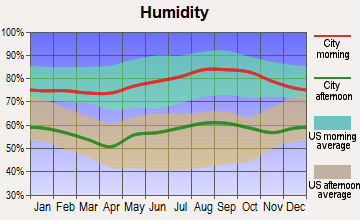
Weather is distinct in these two cities. Columbus has a typical Midwestern climate, with hot, humid summers and cold, snowy winters. On the other hand, Norfolk has a humid subtropical climate, enjoying milder winters and hot, humid summers. The coastal climate in Norfolk can be more appealing for those who enjoy outdoor activities year-round.
Weather and climate
Type
Columbus
Norfolk
Temperature - Average
52.8°F
59.6°F
Humidity - Average morning or afternoon humidity
74.8%
73%
Humidity - Differences between morning and afternoon humidity
34%
32%
Humidity - Maximum monthly morning or afternoon humidity
86%
83%
Humidity - Minimum monthly morning or afternoon humidity
52%
51%
Precipitation - Yearly average
39.3 in
46.3 in
Snowfall - Yearly average
56.6 in
15.4 in
Clouds - Number of days clear of clouds
12%
17.6%
Sunshine amount - Average
49.7%
66.8%
Sunshine amount - Differences during a year
27%
14%
Sunshine amount - Maximum monthly
55%
67%
Sunshine amount - Minimum monthly
28%
53%
Wind speed - Average
8.2 mph
10.4 mph
Average climate in Columbus, Ohio
Average climate in Norfolk, Virginia
Air pollution
Type
AQI
CO
NO2
OZONE
PB
PM10
PM25
SO2
Year
Columbus
Norfolk
Columbus
Norfolk
Columbus
Norfolk
Columbus
Norfolk
Norfolk
Columbus
Columbus
Norfolk
Columbus
Norfolk
2018
69
57
0.11
0.29
10.0
7.0
33.8
30.9
0.002
N/A
N/A
N/A
6.0
6.1
0.0
0.3
2017
68
60
0.16
0.23
9.6
7.6
28.7
33.0
0.002
N/A
N/A
N/A
5.5
6.9
0.1
0.3
2016
76
66
0.17
0.22
10.6
7.3
28.5
31.5
0.002
N/A
N/A
N/A
5.6
6.1
0.1
0.3
2015
74
57
0.16
0.27
11.3
8.1
27.0
33.5
0.002
N/A
N/A
N/A
6.1
6.4
0.1
0.5
2014
82
59
0.20
0.28
11.0
8.3
28.5
33.5
0.002
N/A
N/A
N/A
7.4
6.8
0.5
1.2
2013
78
66
N/A
0.28
8.9
7.8
29.6
30.9
0.002
N/A
N/A
N/A
7.8
6.8
0.6
1.2
2012
87
76
N/A
0.30
N/A
8.4
32.9
34.2
0.002
N/A
N/A
N/A
8.9
8.1
N/A
1.2
2011
89
66
N/A
0.27
N/A
10.2
28.1
34.8
0.003
N/A
N/A
N/A
8.9
8.8
N/A
1.7
2010
90
80
N/A
0.24
N/A
6.4
30.5
38.2
0.004
N/A
N/A
N/A
9.1
N/A
N/A
2.2
2009
61
54
N/A
0.24
N/A
9.8
28.7
31.5
0.012
N/A
N/A
N/A
N/A
N/A
N/A
2.5
2008
65
77
N/A
0.24
N/A
10.3
31.2
36.2
0.004
N/A
N/A
N/A
N/A
N/A
1.8
3.5
2007
80
81
N/A
0.17
N/A
12.2
30.8
36.4
0.004
N/A
N/A
N/A
N/A
N/A
2.8
4.6
2006
75
62
N/A
0.34
N/A
N/A
30.0
36.3
0.004
N/A
23.7
N/A
N/A
N/A
3.3
3.4
2005
87
67
N/A
0.28
N/A
N/A
29.6
35.5
N/A
N/A
27.5
N/A
N/A
N/A
4.1
3.5
2004
77
80
N/A
0.29
N/A
15.9
27.8
33.4
N/A
N/A
24.6
N/A
N/A
N/A
4.4
4.4
2003
91
84
N/A
0.33
N/A
16.2
26.4
34.3
N/A
N/A
23.9
N/A
N/A
N/A
4.1
4.1
2002
93
99
N/A
0.41
N/A
17.8
31.3
38.0
N/A
N/A
25.7
N/A
N/A
N/A
4.1
6.4
2001
84
92
N/A
0.41
N/A
18.2
29.2
36.4
N/A
N/A
25.9
N/A
N/A
N/A
3.5
6.3
2000
57
85
N/A
0.43
N/A
15.7
N/A
36.6
N/A
N/A
23.5
N/A
N/A
N/A
3.7
6.8
Natural disasters
Type
Columbus
Norfolk
Tornado activity compared to U.S. average
119.1%
69.9%
Earthquake activity compared to U.S. average
96.1%
36.4%
Natural disasters compared to U.S. average
16%
0%
Transportation
Both cities have efficient public transport systems, but Columbus offers more commute options, including buses, bikes, and car-sharing services. Norfolk also provides good public transit with a focus on bus and rail services, but with a higher reliance on cars for commuting.
Transport
Type
Columbus
Norfolk
Amtrak stations
1
1
Amtrak stations nearby
1
3
FAA registered aircraft
415
106
FAA registered aircraft manufacturers and dealers
4
4
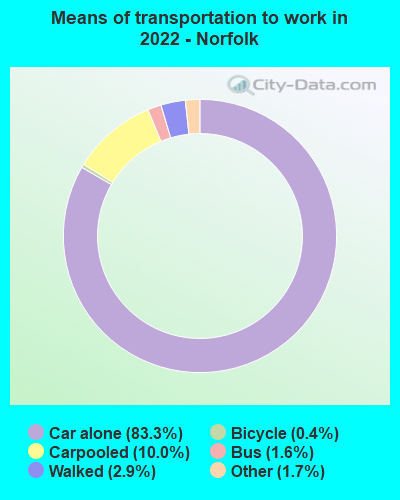
Means of transportation to work
Type
Columbus
Norfolk
Bicycle
0.6%
0.4%
Bus
1.6%
1.7%
Carpooled
7.4%
9.2%
Car alone
86.7%
83%
Motorcycle
0%
0.2%
Taxicab
0.1%
0.3%
Walked
2.2%
4.1%
Average travel time to work
Type
Columbus
Norfolk
Average
26.1 min
26.5 min
Other means
21.7 min
21.4 min
Public transportation
35.4 min
43.4 min
Private vehicle occupancy
Type
Columbus
Norfolk
Average
1.1
1.1
Drove alone
90.7%
89.2%
In 2 person carpool
7.3%
8.4%
In 3 person carpool
1.4%
1.6%
In 4 person carpool
0.5%
0.3%
In 5-6 person carpool
0.1%
0.4%
How many people usually rode to work in the car, truck or van.
Real Estate
When it comes to real estate, Columbus tends to be more affordable than Norfolk. Columbus offers lower home prices and rent than Norfolk, although waterfront properties in Norfolk can add considerable appeal for those desiring a coastal lifestyle.
Neighborhoods
Columbus is famous for its variety of neighborhoods, each with its character. From the German Village to Short North and Victorian Village, there is something for everyone. Despite being smaller, Norfolk also offers diverse neighborhoods, such as Downtown Norfolk and Ghent, each reflecting the city's rich history and coastal charm.
Houses and residents
Type
Columbus
Norfolk
Houses
422,120
102,423
Average household size (people)
2.3
2.4
Median year apartment built
1982
1970
Median year house/condo built
1977
1958
Length of stay in the house since moving in
12.6 years
12.3 years
Houses occupied
390,605 (92.5%)
97,596 (95.3%)
Houses occupied by owners
175,427 (44.9%)
44,867 (46%)
Houses occupied by renters
215,178 (55.1%)
52,729 (54%)
Median rent asked for vacant for-rent units
$1,371
$517.27
Median monthly housing costs
$1,110
$1,196
Median price asked for vacant for-sale houses and condos
$195,022
$166,683
Estimated median house or condo value
$219,200
$250,300
Median numbers of rooms
5
5.3
Median number of rooms in apartments
4.2
4.2
Median number of rooms in houses and condos
6.3
6.6
Median house price - detached houses
$233,452
$306,640
Median house price - in 2-unit structures
$121,729
$250,782
Median house price - in 3-to-4-unit structures
$215,337
$117,518
Median house price - in 5 or more unit structures
$240,711
$260,910
Median house price - mobile homes
$121,578
$23,245
Median house price - Townhouses or other attached units
$218,726
$267,013
Median house price - All housing units
$229,736
$296,270
Median house age
42
56
Renting percentage
53%
54.6%
Housing density (houses/condos per square mile)
2,007.5
1,906.3
House value disparities
30.2%
33.9%
Household income disparities
42.4%
44.5%
Median household income for houses/condes with a mortgage
$89,058
$101,012
Median household income for apartments without a mortgage
$59,295
$66,099
Housing units without a mortgage
4,290 (3.3%)
741 (2.2%)
Housing units with both a second mortgage and home equity loan
10,651 (8.2%)
1,418 (4.1%)
Housing units with a mortgage
125,487 (96.7%)
33,471 (97.8%)
Housing units with a home equity loan
775 (0.6%)
128 (0.4%)
Housing units with a second mortgage
13,558 (10.4%)
2,277 (6.7%)
House/condo owner moved in on average (years ago)
10
9
House/condo renter moved in on average (years ago)
1
1
Housing units lacking complete kitchen facilities
1.6%
1.8%
Housing units lacking complete plumbing facilities
1.3%
1%
Housing units in structures
Housing units in structures
Columbus
Norfolk
One, detached
45.8%
48.2%
One, attached
9.1%
7.7%
Two
4.0%
4.8%
3 or 4
8.6%
10.2%
5 to 9
11.8%
10.1%
10 to 19
8.6%
6.0%
20 to 49
4.5%
4.1%
50 or more
6.8%
8.2%
Mobile homes
0.8%
0.7%
Boats, RVs, vans, etc.
0.1%
0.0%
Median real estate property taxes paid for housing units
Self-employed workers in own not incorporated business
20,915
4,402
State government workers
31,881
5,009
Unpaid family workers
724
102
Industries and Occupations
Columbus is home to a wide range of industries including technology, education, healthcare, insurance, banking, defense, aviation, food, logistics, steel, energy, and medical research. On the flip side, Norfolk’s economy is driven primarily by defense (Naval Station Norfolk is a crucial employer), shipping, transportation, and healthcare.
Both cities are well-equipped in health care services. Columbus' health care system is renowned, with facilities like The Ohio State University Wexner Medical Center. Norfolk is known for Sentara Norfolk General Hospital and Children's Hospital of The King's Daughters.
Health (county statistics)
Type
Columbus
Norfolk
General health status score of residents in this county from 1 (poor) to 5 (excellent)
In terms of infrastructure, both cities are well-developed. Columbus with its freeway system and Norfolk with its significant port infrastructure. Both cities offer good internet connectivity and public facilities, but weather-related infrastructure challenges, such as flooding, are more common in Norfolk due to its coastal location.
Infrastructure
Type
Columbus
Norfolk
Hospitals
47
13
TV stations
14
26
Arenas or stadiums
3
1
Bank branches located here
200
59
Bank institutions located here
25
14
Main business address for public companies
23
4
Nuclear power plants nearby
0
2
Drinking water stations with no reported violations in the past
17
1
Drinking water stations with reported violations in the past
HMDA - Conventional home purchase loans - Applications denied
Year
Columbus
Norfolk
1999
2,450
0
2000
2,376
0
2001
1,897
0
2002
1,483
0
2003
2,087
520
2004
3,216
804
2005
4,275
854
2006
4,662
929
2007
2,679
604
2008
1,015
223
2009
555
92
Culture and Food
Columbus boasts a melting pot of cultures, with many cultural festivals and a diverse food scene. Norfolk, being a coastal city, has a rich maritime culture and an impressive range of seafood offerings. Both cities have ample galleries, museums, and live music venues.
Sports Teams
Columbus is home to several professional sports teams, including the Columbus Blue Jackets (NHL) and Columbus Crew SC (MLS). Norfolk has minor league teams like the Norfolk Tides (Baseball) and the Norfolk Admirals (Hockey).


 Columbus, OH
 Norfolk, VA