Columbus, OH vs Lincoln, NE - Advanced U.S. city comparison tool

Columbus, OH vs Lincoln, NE

Comparing Columbus, Ohio, and Lincoln, Nebraska, reveals stark contrasts in the demographic and lifestyle aspects of these regions. Both cities offer unique experiences in terms of crime and safety, weather patterns, living costs, educational opportunities, and more. Diversified economies provide a plenitude of diverse employment opportunities, with robust infrastructural networks supporting thriving industries. Differences also exist in real estate, neighborhoods, transportation options, tax rates, food and cultural events, sports teams, and healthcare systems.
 
 
Distance between Columbus, OH and Lincoln, NE : 721.5 miles

Columbus's population is larger by 210%. Its population has grown by 195,058 people (27.4%) since 2000. The population of Lincoln has grown by 67,076 people (29.7%) during that time.

Population
Type Columbus Lincoln
Population 906,528 292,657
Female / male percentage 50.7% / 49.3%
50.7%
49.3%
49.5% / 50.5%
49.5%
50.5%
Racial makeup - percentage
Ethnicity ColumbusLincoln
White Non-Hispanic 52.9% 77.4%
Black 29.0% 4.2%
Hispanic 6.9% 8.5%
Asian 5.7% 3.5%
Two or more 5.0% 5.6%
American Indian 0.1% 0.4%
Racial makeup - absolute values
Ethnicity ColumbusLincoln
White Non-Hispanic 479,734 226,548
Black 262,859 12,267
Hispanic 62,657 24,758
Asian 51,849 10,347
Two or more 45,592 16,261
American Indian 677 1,034
Pacific Islander 199 87

Crime and Safety

Columbus has a slightly higher crime rate than the national average, which could be important when considering safety. In contrast, Lincoln's crime rate is somewhat lower than the national average, offering a potentially safer environment. Tourists are advised to take the usual precautions in both cities.

Crime by year per 100,000 residents
Type City-data.com crime indexRobberies per 100,000Murders per 100,000Rapes per 100,000Assaults per 100,000Burglaries per 100,000Theft per 100,000Auto theft per 100,000Arson per 100,000
Year ColumbusLincolnColumbusLincolnColumbusLincolnColumbusLincolnColumbusLincolnColumbusLincolnColumbusLincolnColumbusLincolnColumbusLincoln
2020 376.1 221.6 197.1 43.4 19.1 1.7 89.5 74.5 250.1 222.8 609.1 252.2 2,180.6 1,774.8 340.7 154.1 1.3 16.7
2019 366.2 278.4 200.6 57.0 9.5 1.7 99.0 110.9 198.6 213.3 643.0 339.4 2,286.8 2,255.4 394.8 155.9 1.2 14.4
2018 391.5 274.0 219.9 56.1 12.3 2.1 100.6 98.1 182.1 205.8 726.4 409.6 2,437.8 2,319.6 445.2 149.3 1.2 15.2
2017 427.9 228.7 227.6 56.7 16.4 0.0 112.2 76.4 168.7 171.4 820.0 368.6 2,681.7 2,054.8 482.8 103.5 1.3 12.0
2016 426.3 274.8 250.7 67.9 12.1 3.6 105.9 79.0 175.6 207.4 901.8 448.5 2,775.5 2,531.5 412.3 125.2 47.0 21.0
2015 418.9 274.6 267.1 77.4 9.8 0.4 105.2 69.8 179.2 223.1 857.3 480.1 2,738.9 2,655.2 370.4 130.5 47.8 32.9
2014 430.6 266.7 254.2 75.6 10.2 2.6 94.7 56.0 199.3 204.3 1,095.3 481.2 2,828.0 2,747.7 355.0 119.8 34.4 24.0
2013 465.9 277.5 301.7 79.2 9.6 1.9 84.8 53.1 148.6 235.8 1,444.1 531.8 3,111.8 2,849.8 414.4 114.4 45.2 15.0
2012 513.5 307.4 380.1 74.6 8.9 1.1 74.0 68.9 140.0 252.9 1,865.9 611.7 3,235.8 3,120.7 430.3 117.7 65.0 9.8
2011 567.0 299.9 412.8 67.9 11.0 1.5 75.4 63.7 164.5 237.5 1,934.0 537.4 3,888.5 3,231.5 461.5 139.6 30.2 9.6
2010 582.4 319.6 428.1 70.4 12.1 0.8 72.9 55.3 182.2 360.3 1,938.7 566.6 3,926.9 3,253.4 528.4 134.7 51.2 1.2
2009 591.1 313.7 447.6 77.4 10.8 2.0 78.9 49.5 170.5 329.4 1,924.7 635.9 3,977.4 3,181.5 552.0 115.5 56.9 0.4
2008 624.5 326.1 478.9 84.7 13.3 1.6 85.7 44.9 200.7 378.5 1,962.1 623.7 3,788.5 3,280.1 708.2 138.3 62.5 0.0
2007 673.2 372.1 523.8 71.1 10.7 2.5 92.8 46.5 228.9 424.7 1,960.5 782.8 4,233.9 3,876.0 849.3 173.9 86.7 0.8
2006 664.5 374.5 499.5 67.4 11.6 2.1 81.7 41.6 220.8 411.2 2,031.6 799.1 4,243.2 4,109.6 873.6 179.2 76.4 1.7
2005 576.1 346.1 521.7 94.7 14.1 1.7 76.3 47.1 237.3 430.4 2,014.7 796.3 4,406.4 4,370.0 1,097.3 177.5 63.7 8.4
2004 575.7 349.6 460.1 81.5 10.7 2.5 81.9 55.4 261.0 382.8 2,002.6 802.4 4,673.3 4,574.4 1,168.9 183.8 69.5 8.9
2003 587.3 340.7 458.9 65.5 15.0 2.1 84.7 40.2 297.3 368.8 2,017.5 838.2 4,591.7 4,727.4 1,149.2 204.9 22.3 3.9

City-data.com crime index counts serious crimes and violent crime more heavily. It adjusts for the number of visitors and daily workers commuting into cities. (higher means more crime, U.S. average = 301.1)


Crime per year
Type City-data.com crime indexRobberiesMurdersRapesAssaultsBurglariesTheftAuto theftArson
Year ColumbusLincolnColumbusLincolnColumbusLincolnColumbusLincolnColumbusLincolnColumbusLincolnColumbusLincolnColumbusLincolnColumbusLincoln
2019 366.2 278.4 1,818 166 86 5 897 323 1,800 621 5,826 988 20,721 6,566 3,577 454 11 42
2018 391.5 274.0 1,963 162 110 6 898 283 1,625 594 6,484 1,182 21,759 6,694 3,974 431 11 44
2017 427.9 228.7 1,985 161 143 0 979 217 1,471 487 7,152 1,047 23,390 5,837 4,211 294 11 34
2016 426.3 274.8 2,162 191 104 10 913 222 1,515 583 7,778 1,261 23,939 7,117 3,556 352 405 59
2015 418.9 274.6 2,264 214 83 1 892 193 1,519 617 7,268 1,328 23,219 7,344 3,140 361 405 91
2014 430.6 266.7 2,112 205 85 7 787 152 1,656 554 9,100 1,305 23,495 7,452 2,949 325 286 65
2013 465.9 277.5 2,463 212 78 5 692 142 1,213 631 11,789 1,423 25,404 7,625 3,383 306 369 40
2012 513.5 307.4 3,031 197 71 3 590 182 1,116 668 14,878 1,616 25,802 8,244 3,431 311 518 26
2011 567.0 299.9 3,251 177 87 4 594 166 1,296 619 15,232 1,401 30,626 8,424 3,635 364 238 25
2010 582.4 319.6 3,369 182 95 2 574 143 1,434 931 15,258 1,464 30,906 8,406 4,159 348 403 3
2009 591.1 313.7 3,399 197 82 5 599 126 1,295 838 14,616 1,618 30,204 8,095 4,192 294 432 1
2008 624.5 326.1 3,601 213 100 4 644 113 1,509 952 14,753 1,569 28,485 8,251 5,325 348 470 0
2007 673.2 372.1 3,855 173 79 6 683 113 1,685 1,033 14,429 1,904 31,161 9,428 6,251 423 638 2
2006 664.5 374.5 3,654 162 85 5 598 100 1,615 989 14,862 1,922 31,041 9,884 6,391 431 559 4
2005 576.1 346.1 3,810 225 103 4 557 112 1,733 1,023 14,714 1,893 32,181 10,388 8,014 422 465 20
2004 575.7 349.6 3,358 193 78 6 598 131 1,905 906 14,617 1,899 34,111 10,826 8,532 435 507 21
2003 587.3 340.7 3,332 153 109 5 615 94 2,159 862 14,650 1,959 33,343 11,049 8,345 479 162 9

City-data.com crime index counts serious crimes and violent crime more heavily. It adjusts for the number of visitors and daily workers commuting into cities. (higher means more crime, U.S. average = 301.1)

Sex Offenders

According to our data, there are 1,576 registered sex offenders living in Columbus and 880 registered sex offenders living in .
The ratio of residents to sex offenders in Columbus is 547 to 1; the ratio in Lincoln is 319 to 1.
The number of registered sex offenders compared to the number of residents is a smaller in Columbus than in Lincoln.

Cost of Living

The cost of living in Columbus is close to the national average with affordability in housing making it desirable for many people. Lincoln generally has a lower cost of living, which attracts both residents and tourists looking for affordable vacation spots.

Income Tax

City and state income tax rates in Columbus are generally higher than in Lincoln. Ohio state’s income tax rates range from 0% to 4.797%, while Nebraska ranges from 2.46% to 6.84%.

Property Tax

Property taxes in Columbus are generally lower than in Lincoln, which may influence homeownership.

Sales Tax

Sales tax in Columbus, Ohio is 7.5%, while in Lincoln, Nebraska, it is 7.25%. This slight difference may affect the overall cost of goods and services.
Income
Type Columbus Lincoln
Estimated median household income $58,202 $62,294
Estimated per capita income $32,392 $34,008
Cost of living index (U.S. average is 100) 96.1 84.5

If you make $50,000 in Lincoln, you will have to make $56,864 in Columbus to maintain the same standard of living.

Geographical Conditions

Columbus is centrally located in Ohio with a variety of landscapes, including forests, rivers, and plains. Lincoln is seated in the Great Plains region, characterized by its flat terrain.
Geographical information
Type Columbus Lincoln
Land area 210.3 sq. miles 74.6 sq. miles
Population density 4,311.3 people per sq. mile 3,920.8 people per sq. mile
Elevation 800 feet 1,189 feet
Relative area comparison
Columbus, OH Lincoln, NE
First ancestry reported - percentage
Ancestry ColumbusLincoln
German 7.8% 28.7%
English 5.2% 5.5%
Irish 4.2% 4.5%
Italian 3.2% 1.1%
Polish 1.2% 1.3%
Scottish 0.7% 0.7%
Welsh 0.5% 0.1%
Scotch-Irish 0.5% 0.4%
Russian 0.3% 0.3%
Dutch 0.3% 0.9%
Slovak 0.3% 0.0%
Ukrainian 0.2% 0.9%
Swedish 0.2% 1.7%
Lithuanian 0.2% 0.0%
Norwegian 0.2% 1.2%
Hungarian 0.2% 0.1%
French 0.2% 0.5%
French Canadian 0.1% 0.2%
Czech 0.1% 2.9%
Danish 0.0% 0.7%
Population origin - absolute values
Ancestry ColumbusLincoln
German 39,093 35,078
English 25,954 6,658
Irish 21,227 5,512
Italian 15,939 1,389
Polish 5,799 1,555
Scottish 3,493 817
Scotch-Irish 2,642 494
Welsh 2,395 145
Slovak 1,547 27
Russian 1,502 417
Dutch 1,361 1,100
Hungarian 1,088 122
Ukrainian 1,081 1,093
Lithuanian 1,020 51
Norwegian 937 1,412
Greek 847 195
French 789 573
Swedish 763 2,064
Swiss 757 150
Czech 673 3,594
Foreign born residents - absolute values
Type Count
Region ColumbusLincoln
All 125,304 26,604
Africa 42,208 2,399
Asia 44,859 14,228
Europe 8,129 2,799
Latin America 23,931 7,002
North America 1,235 214
Oceania 245 56
Foreign born residents - percentage
Type Percentage
Region ColumbusLincoln
All 13.9% 9.1%
Africa 4.7% 0.8%
Asia 5.0% 4.9%
Europe 0.9% 1.0%
Latin America 2.6% 2.4%
North America 0.1% 0.1%

Education

In terms of quality of education, both cities house reputable schools and universities. Columbus is home to The Ohio State University, one of the largest universities in the US. Lincoln is home to the University of Nebraska, a respected institution offering excellent educational opportunities.
School enrollment
Type Columbus Lincoln
Nursery, preschool 8,473 (3.8%) 5,398 (6.2%)
Kindergarten 10,536 (4.7%) 3,151 (3.6%)
Grade 1 to 4 40,173 (17.9%) 13,863 (16%)
Grade 5 to 8 41,603 (18.5%) 13,997 (16.2%)
Grade 9 to 12 40,616 (18.1%) 14,273 (16.5%)
College undergrad 63,955 (28.4%) 26,731 (30.9%)
Graduate or professional 19,575 (8.7%) 9,158 (10.6%)
Students in private schools - absolute values
Type Count
Grade ColumbusLincoln
Grades 1 to 8 (elementary and middle school) 15,679 3,668
Grades 9 to 12 (high school) 5,030 1,875
Undergraduate colleges 8,811 4,412
Students in private schools - percentage
Type Percentage
Grade ColumbusLincoln
Grades 1 to 8 (elementary and middle school) 19.2% 13.2%
Grades 9 to 12 (high school) 12.4% 13.1%
Undergraduate colleges 13.8% 16.5%
Educational attainment
Type Columbus Lincoln
Less than high school 9.2% 6.2%
High school or equiv. 24.9% 20.3%
Less than 1 year of college 6.3% 6.9%
1 or more years of college 13.6% 12.7%
Associate degree 7.6% 10.9%
Bachelor's degree 25% 26.7%
Master's degree 9.8% 11.1%
Profess. school degree 2% 2.3%
Doctorate degree 1.6% 3%
Education level (25-year-olds and older)
Type Columbus Lincoln
Bachelor's degree or higher 38.4% 43%
Graduate or professional degree 13.4% 16.3%
High school or higher 90.8% 93.8%

Work and Economy

Columbus boasts a diverse economy with industries spanning education, healthcare, technology, and finance. Lincoln's economy also has diverse sectors like education, information technology, and the service industry.

Biggest Employers

Columbus's biggest employers include the Wexner Medical Center at Ohio State University and JP Morgan Chase. Lincoln's major employers are University of Nebraska-Lincoln and the State of Nebraska.
Employment and residency - absolute values
Kind ColumbusLincoln
Work and live in this city 254,193 112,346
Work and live in this county 412,410 152,609
Workers who work outside the city they live in 457,277 113,235
Workers who work outside the county they live in 56,853 7,363
Working at home 111,379 22,126
Not working at home 357,884 137,846
Daytime population change due to commuting 82,520 10,220
Employment and residency - percentage
Kind ColumbusLincoln
Work and live in this city 69.2% 90.0%
Work and live in this county 87.9% 95.4%
Workers who work outside the city they live in 30.8% 10.0%
Workers who work outside the county they live in 12.1% 4.6%
Working at home 23.7% 13.8%
Not working at home 76.3% 86.2%
Daytime population change due to commuting 11.6% 4.5%
Geographical mobility: all
Type all
Mobility ColumbusLincoln
Same house 1 year ago 79.0% 80.9%
Moved from abroad 0.8% 0.6%
Moved within same county 13.5% 12.1%
Moved from different state 2.7% 2.5%
Moved within same state 4.0% 3.9%
Geographical mobility: Asian
Type Asian
Mobility ColumbusLincoln
Same house 1 year ago 72.4% 75.3%
Moved from abroad 3.5% 3.8%
Moved within same county 13.7% 13.6%
Moved from different state 8.9% 2.5%
Moved within same state 1.6% 4.1%
Geographical mobility: Black
Type Black
Mobility ColumbusLincoln
Same house 1 year ago 78.9% 65.8%
Moved from abroad 1.6% 8.2%
Moved within same county 14.7% 16.4%
Moved from different state 1.9% 3.5%
Moved within same state 2.8% 6.1%
Geographical mobility: White
Type White
Mobility ColumbusLincoln
Same house 1 year ago 79.8% 83.5%
Moved from abroad 0.4% 0.3%
Moved within same county 12.6% 11.0%
Moved from different state 2.7% 2.1%
Moved within same state 4.5% 3.1%
Building permits
Type Average valueCount
City ColumbusLincolnColumbusLincoln
1997 $74,900 $120,000 1,822 1,019
1998 $78,200 $133,100 1,979 1,156
1999 $105,800 $138,200 2,871 1,080
2000 $128,300 $134,000 2,903 1,202
2001 $130,400 $137,700 3,058 1,305
2002 $133,600 $139,900 3,196 1,407
2003 $137,900 $139,300 3,188 1,870
2004 $141,300 $157,300 2,687 1,688
2005 $160,500 $163,100 2,360 1,232
2006 $168,800 $176,200 1,223 958
2007 $163,200 $169,900 1,008 829
2008 $169,200 $170,100 686 539
2009 $162,500 $156,900 852 558
2010 $164,100 $180,800 716 501
2011 $160,000 $188,400 667 544
2012 $163,700 $192,000 723 704
2013 $174,000 $191,600 770 844
2014 $211,100 $191,400 724 854
2015 $244,000 $205,100 729 895
2016 $243,500 $206,300 649 928
2017 $257,700 $206,000 650 994
2018 $226,600 $229,600 555 859
2019 $259,300 $220,100 512 863
2020 $266,700 $221,800 834 964
2021 $306,700 $296,900 913 1,093

There were 913 building permits issued in Columbus in 2012 (246 more than in 2011) compared to 1,093 building permits issued in Lincoln in 2012 (549 more than in 2011).

In Columbus (Franklin County), 60.8% voted for Democrats and 37.9% for Republicans in 2012 Presidential Election. In Lincoln (Lancaster County), 48.7% voted for Democrats and 49.0% for Republicans.

Elections
Type DemocratsRepublicansOther
Year ColumbusLincolnColumbusLincolnColumbusLincoln
2020 64.7% 52.3% 33.4% 44.6% 1.9% 3.1%
2016 59.8% 45.4% 33.9% 45.2% 6.2% 9.4%
2012 60.8% 48.7% 37.9% 49.0% 1.3% 2.3%
2008 59.8% 51.6% 39.0% 46.6% 1.2% 1.9%
2004 54.5% 42.6% 45.2% 56.3% 0.3% 1.1%
2000 48.9% 41.7% 47.9% 51.9% 3.2% 6.4%
1996 48.1% 44.4% 44.5% 45.9% 7.3% 9.8%
Breakdown of population affiliated with a religious congregation
Type AdherentsCongregations
Religion ColumbusLincolnColumbusLincoln
CATHOLIC CHURCH 13.2% 14.9% 5.6% 6.8%
EVANGELICAL LUTHERAN CHURCH IN AMERICA 1.6% 5.0% 3.7% 6.4%
SOUTHERN BAPTIST CONVENTION 1.6% 0.7% 6.8% 3.0%
MUSLIM ESTIMATE 1.3% 0.2% 1.9% 0.8%
VINEYARD USA 1.3% 0.0% 1.2% 0.0%
AMERICAN BAPTIST CHURCHES IN THE USA 1.0% 0.1% 3.3% 1.3%
EPISCOPAL CHURCH 0.4% 0.4% 1.3% 1.7%
SEVENTH DAY ADVENTIST CHURCH 0.4% 1.4% 2.0% 3.4%
LUTHERAN CHURCH 0.2% 4.6% 1.0% 5.9%
SALVATION ARMY 0.1% 0.4% 0.4% 0.4%
REFORMED CHURCH IN AMERICA 0.0% 0.4% 0.1% 1.3%

Weather

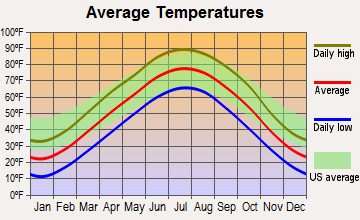
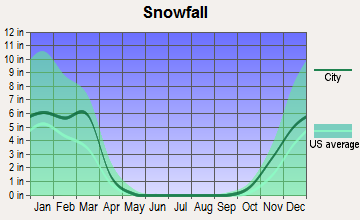
The weather in Columbus tends to be variable with a humid continental climate featuring hot, muggy summers and cold, dry winters. Lincoln also experiences a changing climate with hot summers and moderately cold winters, often with more snowfall than Columbus.
Weather and climate
Type Columbus Lincoln
Temperature - Average 52.8°F 51.1°F
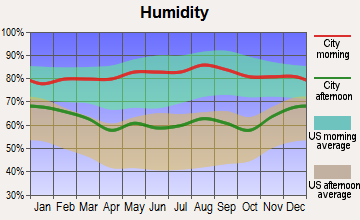
Humidity - Average morning or afternoon humidity 74.8% 75.2%
Humidity - Differences between morning and afternoon humidity 34% 35%
Humidity - Maximum monthly morning or afternoon humidity 86% 87%
Humidity - Minimum monthly morning or afternoon humidity 52% 52%
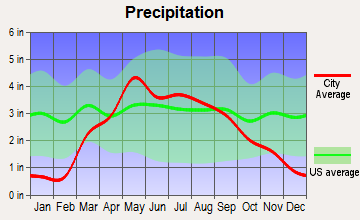
Precipitation - Yearly average 39.3 in 29.1 in
Snowfall - Yearly average 56.6 in 53 in
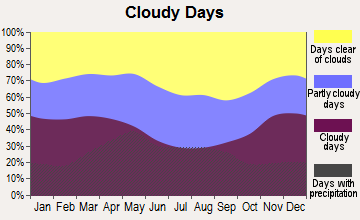
Clouds - Number of days clear of clouds 12% 19.6%
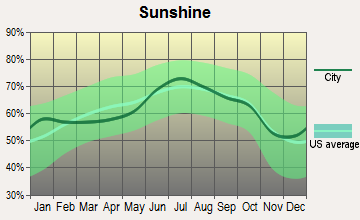
Sunshine amount - Average 49.7% 65.4%
Sunshine amount - Differences during a year 27% 23%
Sunshine amount - Maximum monthly 55% 73%
Sunshine amount - Minimum monthly 28% 50%
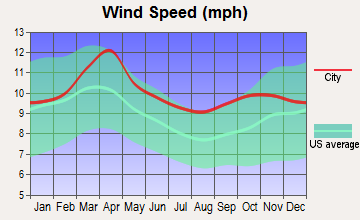
Wind speed - Average 8.2 mph 10.6 mph

Average climate in Columbus, Ohio

Chicago, Illinois average temperatures Chicago, Illinois average precipitation Chicago, Illinois humidity Chicago, Illinois wind speed Chicago, Illinois snowfall Chicago, Illinois sunshine Chicago, Illinois clear and cloudy days
 

Average climate in Lincoln, Nebraska

Chicago, Illinois average temperatures Chicago, Illinois average precipitation Chicago, Illinois humidity Chicago, Illinois wind speed Chicago, Illinois snowfall Chicago, Illinois sunshine Chicago, Illinois clear and cloudy days
 

Air pollution
Type AQICONO2OZONEPM10PM25SO2
Year ColumbusLincolnColumbusLincolnColumbus ColumbusLincolnColumbus Columbus Columbus 
2018 69 46 0.11 N/A 10.0 N/A 33.8 28.8 N/A N/A 6.0 N/A 0.0 N/A
2017 68 47 0.16 N/A 9.6 N/A 28.7 27.6 N/A N/A 5.5 N/A 0.1 N/A
2016 76 48 0.17 N/A 10.6 N/A 28.5 30.4 N/A N/A 5.6 N/A 0.1 N/A
2015 74 54 0.16 N/A 11.3 N/A 27.0 31.3 N/A N/A 6.1 N/A 0.1 N/A
2014 82 54 0.20 N/A 11.0 N/A 28.5 29.1 N/A N/A 7.4 N/A 0.5 N/A
2013 78 46 N/A N/A 8.9 N/A 29.6 29.1 N/A N/A 7.8 N/A 0.6 N/A
2012 87 41 N/A N/A N/A N/A 32.9 32.7 N/A N/A 8.9 N/A N/A N/A
2011 89 30 N/A 0.32 N/A N/A 28.1 26.3 N/A N/A 8.9 N/A N/A N/A
2010 90 31 N/A 0.39 N/A N/A 30.5 25.0 N/A N/A 9.1 N/A N/A N/A
2009 61 58 N/A 0.42 N/A N/A 28.7 23.4 N/A N/A N/A N/A N/A N/A
2008 65 31 N/A 0.40 N/A N/A 31.2 25.4 N/A N/A N/A N/A 1.8 N/A
2007 80 35 N/A 0.47 N/A N/A 30.8 27.8 N/A N/A N/A N/A 2.8 N/A
2006 75 38 N/A 0.55 N/A N/A 30.0 26.7 23.7 N/A N/A N/A 3.3 N/A
2005 87 40 N/A 0.62 N/A N/A 29.6 28.2 27.5 N/A N/A N/A 4.1 N/A
2004 77 37 N/A 0.68 N/A N/A 27.8 27.1 24.6 N/A N/A N/A 4.4 N/A
2003 91 43 N/A 0.63 N/A N/A 26.4 29.2 23.9 N/A N/A N/A 4.1 N/A
2002 93 39 N/A 0.62 N/A N/A 31.3 27.3 25.7 N/A N/A N/A 4.1 N/A
2001 84 41 N/A 0.73 N/A N/A 29.2 26.5 25.9 N/A N/A N/A 3.5 N/A
2000 57 40 N/A 0.71 N/A N/A N/A 27.8 23.5 N/A N/A N/A 3.7 N/A
Natural disasters
Type Columbus Lincoln
Tornado activity compared to U.S. average 119.1% 199.3%
Earthquake activity compared to U.S. average 96.1% 471.2%
Natural disasters compared to U.S. average 16% 12%

Transportation

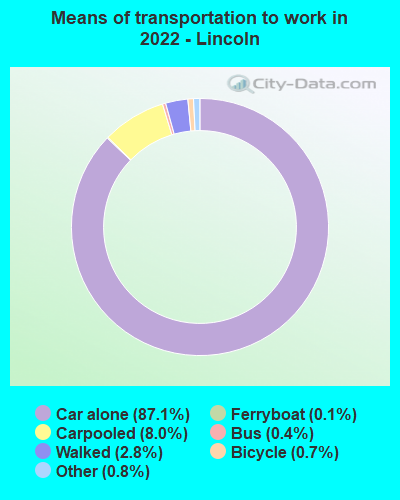
Columbus offers a variety of transportation options, including buses, bikes, and taxis. Lincoln also has a reliable public transportation system and biking routes, but Columbus has a larger and more developed network.
Transport
Type Columbus Lincoln
Amtrak stations 1 1
Amtrak stations nearby 1 1
FAA registered aircraft 415 240
FAA registered aircraft manufacturers and dealers 4 3
Means of transportation to work
Type Columbus Lincoln
Bicycle 0.6% 0.8%
Bus 1.6% 1.1%
Carpooled 7.4% 10.2%
Car alone 86.7% 83.4%
Motorcycle 0% 0.1%
Taxicab 0.1% 0%
Walked 2.2% 3.4%
Means of transportation to work
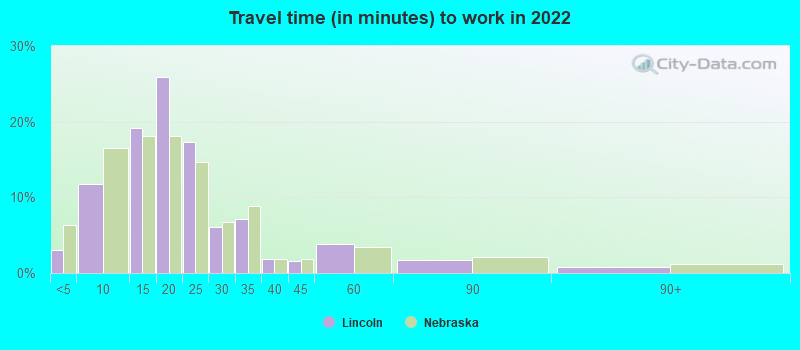
Average travel time to work
Type Columbus Lincoln
Average 26.1 min 21.5 min
Other means 21.7 min 18.8 min
Public transportation 35.4 min 28.9 min
Travel time to work
Time leaving to work
Travel time to work
Time leaving to work
Private vehicle occupancy
Type Columbus Lincoln
Average 1.1 1.1
Drove alone 90.7% 88.3%
In 2 person carpool 7.3% 10%
In 3 person carpool 1.4% 1.1%
In 4 person carpool 0.5% 0.3%
In 5-6 person carpool 0.1% 0.3%

How many people usually rode to work in the car, truck or van.

Real Estate

Columbus's real estate market is dynamic with median home values being slightly above the national average. Lincoln has an affordable housing market with home values below the national average.

Neighborhoods

Columbus offers diverse neighborhoods ranging from vibrant downtown areas to serene suburbs. Lincoln offers a range of options from bustling city dwellings to quieter residential areas.
Houses and residents
Type Columbus Lincoln
Houses 422,120 126,262
Average household size (people) 2.3 2.4
Median year apartment built 1982 1983
Median year house/condo built 1977 1979
Length of stay in the house since moving in 12.6 years 12.1 years
Houses occupied 390,605 (92.5%) 120,407 (95.4%)
Houses occupied by owners 175,427 (44.9%) 70,003 (58.1%)
Houses occupied by renters 215,178 (55.1%) 50,404 (41.9%)
Median rent asked for vacant for-rent units $1,371 $849.83
Median monthly housing costs $1,110 $1,000
Median price asked for vacant for-sale houses and condos $195,022 $413,349
Estimated median house or condo value $219,200 $228,000
Median numbers of rooms 5 5.7
Median number of rooms in apartments 4.2 3.9
Median number of rooms in houses and condos 6.3 7
Median house price - detached houses $233,452 $244,409
Median house price - in 2-unit structures $121,729 $146,009
Median house price - in 3-to-4-unit structures $215,337 $318,993
Median house price - in 5 or more unit structures $240,711 $99,016
Median house price - mobile homes $121,578 $14,649
Median house price - Townhouses or other attached units $218,726 $282,955
Median house price - All housing units $229,736 $242,537
Median house age 42 40
Renting percentage 53% 41.4%
Housing density (houses/condos per square mile) 2,007.5 1,691.6
House value disparities 30.2% 29.7%
Household income disparities 42.4% 43.1%
Median household income for houses/condes with a mortgage $89,058 $97,001
Median household income for apartments without a mortgage $59,295 $72,157
Housing units without a mortgage 4,290 (3.3%) 1,686 (3.6%)
Housing units with both a second mortgage and home equity loan 10,651 (8.2%) 3,489 (7.5%)
Housing units with a mortgage 125,487 (96.7%) 44,764 (96.4%)
Housing units with a home equity loan 775 (0.6%) 0 (0%)
Housing units with a second mortgage 13,558 (10.4%) 4,382 (9.4%)
House/condo owner moved in on average (years ago) 10 10
House/condo renter moved in on average (years ago) 1 1
Housing units lacking complete kitchen facilities 1.6% 0.8%
Housing units lacking complete plumbing facilities 1.3% 0.3%
Housing units in structures
Housing units in structures ColumbusLincoln
One, detached 45.8% 58.3%
One, attached 9.1% 8.0%
Two 4.0% 2.3%
3 or 4 8.6% 2.9%
5 to 9 11.8% 5.6%
10 to 19 8.6% 7.4%
20 to 49 4.5% 7.6%
50 or more 6.8% 6.4%
Mobile homes 0.8% 1.5%
Boats, RVs, vans, etc. 0.1% 0.0%
Median real estate property taxes paid for housing units
Type Columbus Lincoln
With mortgages $3,145 (1.4%) $3,710 (1.6%)
With no mortgages $2,472 (1.3%) $3,546 (1.6%)
Marital status
Type Columbus Lincoln
Divorced 10.2% 9.6%
Never married 45.1% 39.2%
Now married 38.4% 46.4%
Separated 2.3% 0.9%
Widowed 4% 3.9%
Class of workers - percentage
Class of Workers ColumbusLincoln
Employee of private company 70.7% 62.7%
Private not-for-profit wage and salary workers 8.8% 10.9%
State government workers 6.7% 9.1%
Local government workers 5.4% 6.6%
Self-employed workers in own not incorporated business 4.4% 5.7%
Self-employed in own incorporated business 2.2% 2.4%
Federal government workers 1.7% 2.3%
Unpaid family workers 0.2% 0.2%
Class of workers - absolute values
Class of Workers ColumbusLincoln
Employee of private company 337,898 102,076
Federal government workers 7,961 3,806
Local government workers 25,846 10,698
Private not-for-profit wage and salary workers 42,209 17,809
Self-employed in own incorporated business 10,584 3,960
Self-employed workers in own not incorporated business 20,915 9,332
State government workers 31,881 14,738
Unpaid family workers 724 298

Industries and Occupations

In Columbus, the education and healthcare sectors dominate the job market. Lincoln's leading industries include education, information technology, and finance.
Most common male industries
Industry ColumbusLincoln
Retail trade 11.9% 13.2%
Manufacturing 11.3% 10.3%
Transportation and warehousing 10.4% 6.0%
Professional, scientific, and technical services 8.2% 8.6%
Construction 7.8% 10.7%
Accommodation and food services 7.5% 5.5%
Health care and social assistance 7.0% 6.0%
Finance and insurance 6.8% 7.2%
Educational services 6.3% 10.4%
Administrative and support and waste management services 5.1% 3.4%
Public administration 4.0% 5.4%
Other services, except public administration 3.6% 3.7%
Wholesale trade 3.0% 2.4%
Information 2.5% 1.8%
Arts, entertainment, and recreation 2.0% 1.9%
Real estate and rental and leasing 1.2% 0.6%
Utilities 1.0% 0.6%
Management of companies and enterprises 0.2% 0.0%
Agriculture, forestry, fishing and hunting 0.2% 2.0%
Mining, quarrying, and oil and gas extraction 0.1% 0.0%
Most common female industries
Industry ColumbusLincoln
Health care and social assistance 23.8% 22.2%
Retail trade 11.7% 12.3%
Educational services 10.9% 15.4%
Finance and insurance 9.3% 9.1%
Professional, scientific, and technical services 6.7% 6.4%
Accommodation and food services 6.5% 5.7%
Manufacturing 4.8% 6.1%
Transportation and warehousing 4.7% 0.7%
Other services, except public administration 4.3% 4.0%
Administrative and support and waste management services 4.2% 3.5%
Public administration 3.8% 7.1%
Arts, entertainment, and recreation 1.8% 1.8%
Construction 1.8% 1.7%
Information 1.7% 0.9%
Real estate and rental and leasing 1.4% 1.1%
Wholesale trade 1.2% 0.6%
Utilities 0.9% 0.6%
Agriculture, forestry, fishing and hunting 0.2% 0.8%
Management of companies and enterprises 0.2% 0.1%
Most common male occupations
Occupation ColumbusLincoln
Management occupations 10.7% 9.6%
Material moving occupations 9.2% 3.7%
Office and administrative support occupations 9.1% 6.1%
Sales and related occupations 8.0% 11.1%
Computer and mathematical occupations 6.9% 4.9%
Production occupations 6.2% 8.6%
Construction and extraction occupations 6.1% 8.3%
Food preparation and serving related occupations 5.8% 5.6%
Transportation occupations 5.7% 3.6%
Business and financial operations occupations 5.5% 7.3%
Educational instruction, and library occupations 3.5% 6.2%
Building and grounds cleaning and maintenance occupations 3.4% 3.4%
Installation, maintenance, and repair occupations 3.2% 4.5%
Architecture and engineering occupations 2.8% 2.6%
Arts, design, entertainment, sports, and media occupations 2.3% 1.7%
Health diagnosing and treating practitioners and other technical occupations 1.9% 1.1%
Firefighting and prevention, and other protective service workers including supervisors 1.8% 1.6%
Life, physical, and social science occupations 1.7% 2.1%
Community and social service occupations 1.4% 1.3%
Personal care and service occupations 1.2% 1.1%
Most common female occupations
Occupation ColumbusLincoln
Office and administrative support occupations 17.1% 17.5%
Management occupations 9.2% 7.2%
Business and financial operations occupations 8.8% 8.9%
Sales and related occupations 7.3% 11.0%
Educational instruction, and library occupations 7.1% 11.3%
Health diagnosing and treating practitioners and other technical occupations 7.0% 8.7%
Healthcare support occupations 6.1% 5.8%
Food preparation and serving related occupations 4.8% 6.0%
Material moving occupations 4.4% 1.2%
Production occupations 3.7% 3.3%
Health technologists and technicians 3.3% 2.3%
Building and grounds cleaning and maintenance occupations 3.3% 2.3%
Personal care and service occupations 3.1% 4.2%
Computer and mathematical occupations 2.9% 2.0%
Arts, design, entertainment, sports, and media occupations 2.6% 2.1%
Community and social service occupations 2.5% 1.8%
Legal occupations 1.5% 0.8%
Transportation occupations 1.5% 0.3%
Life, physical, and social science occupations 1.4% 0.9%
Food environment data per 10,000 residents
Food environment statistics ColumbusLincoln
Number of convenience stores (no gas) 2.6 3.6
Number of convenience stores (with gas) 1.3 0.2
Number of full-service restaurants 6.5 6.2
Number of grocery stores 2.3 1.5
Number of supercenters and club stores 0.1 0.2
Food environment - absolute values
Food environment statistics ColumbusLincoln
Number of convenience stores (no gas) 285 100
Number of convenience stores (with gas) 146 4
Number of full-service restaurants 730 171
Number of grocery stores 251 42
Number of supercenters and club stores 11 4
Obesity and diabetes
Food environment statistics rate ColumbusLincoln
Adult diabetes rate 9.5% 6.9%
Adult obesity rate 30.2% 26.3%
Low-income preschool obesity rate 13.3% 10.6%

Health Care

Both Columbus and Lincoln offer quality healthcare facilities. However, Columbus has a larger concentration of top-rated hospitals.
Health (county statistics)
Type Columbus Lincoln
General health status score of residents in this county from 1 (poor) to 5 (excellent) 3.5 3.6
Average weight of females (lbs) 167.2 lbs 165.6 lbs
Average weight of males (lbs) 201.7 lbs 201.3 lbs
Residents visited a dentist within the past year 72.1% 74.4%
Residents exercised in the past month 71.6% 79.1%
Adult residents drank alcohol in the past 30 days 52.4% 63.1%
Residents smoked 100+ cigarettes in their lives 41.6% 38.6%

Fatal vehicle accidents per 100,000 residents
Type Total count per 100,000Drunk per 100,000Fatal count per 100,000Pedestrian count per 100,000Person count per 100,000Vehicle count per 100,000
Year ColumbusLincolnColumbusLincolnColumbusLincolnColumbusLincolnColumbusLincolnColumbusLincoln
2021 10.5 4.1 0.0 0.0 11.3 4.4 3.5 0.3 24.2 14.7 18.1 8.9
2020 9.6 3.8 2.9 3.1 10.0 4.1 2.8 0.7 20.4 6.2 15.5 5.1
2019 8.6 6.9 2.8 2.8 9.4 6.9 3.6 1.0 18.4 15.3 13.4 11.1
2018 7.5 3.1 2.5 1.4 8.2 3.1 2.2 0.7 16.4 7.7 11.4 4.5
2017 7.1 2.8 2.3 0.4 7.4 3.2 2.4 0.4 15.3 11.9 11.6 7.4
2016 7.0 2.5 3.2 1.1 7.0 2.5 2.5 0.4 15.3 4.6 11.2 3.9
2015 6.5 5.8 2.6 1.1 7.1 5.8 1.9 1.1 15.0 11.9 11.0 9.7
2014 6.0 4.4 2.5 1.8 6.3 4.4 2.2 0.0 12.4 10.3 10.3 7.3
2013 5.3 2.2 1.6 0.4 6.1 2.2 1.3 0.7 12.6 3.3 8.8 3.0
2012 6.9 1.9 2.8 0.4 7.9 2.3 2.1 0.8 16.5 4.1 11.6 3.8
2011 7.4 3.8 1.9 0.4 7.8 3.8 3.1 0.8 15.2 6.1 11.5 4.6
2010 6.6 1.9 2.2 0.4 6.9 1.9 1.8 0.0 15.9 2.7 11.4 2.7
2009 7.3 2.4 2.9 0.4 7.7 2.4 1.8 0.8 18.6 5.1 12.0 3.5
2008 8.6 2.0 3.6 0.0 9.2 2.0 2.9 0.4 25.5 4.4 14.9 2.8
2007 7.3 4.4 3.1 2.0 7.9 4.8 1.7 0.0 16.1 13.3 11.1 6.9
2006 6.3 3.7 2.6 2.5 6.7 3.7 1.3 0.4 16.0 6.9 11.4 5.7
2005 8.3 3.7 2.8 1.2 8.4 4.1 1.8 0.4 21.7 10.7 13.7 6.6
2004 7.7 3.3 1.9 1.7 8.3 4.2 1.5 0.4 19.3 8.4 12.1 5.4
2003 7.6 8.0 3.5 4.2 8.2 8.8 1.8 0.4 24.1 18.5 13.1 13.5
2002 7.7 4.3 2.6 2.1 8.5 4.7 1.2 0.0 17.7 16.7 11.4 9.4
2001 9.7 5.6 3.0 1.7 10.2 6.9 2.9 1.3 28.2 19.1 16.0 11.7
2000 6.5 5.3 1.5 4.0 6.5 6.2 1.4 0.4 16.4 16.4 10.0 10.6
1999 9.4 3.2 3.6 0.9 9.8 3.7 2.2 0.5 25.2 10.2 14.6 5.6
1998 7.6 7.5 2.2 4.7 8.8 7.5 2.1 2.3 22.7 26.7 12.5 11.7
1997 7.5 3.8 2.7 0.5 8.2 3.8 2.7 2.8 19.0 11.3 11.7 6.6
1996 7.4 1.9 2.9 0.5 7.5 1.9 1.7 1.0 22.3 4.3 11.8 2.4
1995 6.8 1.4 1.5 0.5 7.1 1.4 2.0 0.5 16.5 3.9 9.5 2.4
1994 5.0 4.4 1.4 2.0 5.2 4.4 2.1 1.0 11.7 16.6 7.3 7.3
1993 6.9 2.5 2.4 1.0 7.3 2.5 2.9 1.0 17.5 6.4 9.9 3.0
1992 5.5 2.5 0.3 1.0 5.7 2.5 1.5 0.0 13.5 6.0 8.6 4.0
1991 7.3 3.1 1.5 0.5 8.4 3.1 1.1 3.1 18.1 8.2 10.7 3.6
1990 5.3 4.1 1.4 2.1 5.3 4.1 0.0 0.0 12.1 18.1 7.2 8.3
1989 8.8 7.9 1.1 4.2 9.6 8.9 0.0 0.0 23.8 31.1 14.5 20.5
1988 10.0 2.7 4.8 1.1 11.6 2.7 0.0 0.0 23.7 7.4 14.9 4.3
1987 10.4 5.4 3.8 2.7 10.8 5.4 0.0 0.0 27.8 15.6 17.8 8.1
1986 8.9 3.8 5.4 4.3 9.2 3.8 0.0 0.0 19.8 10.9 12.2 7.1
1985 8.7 6.0 4.2 2.7 9.3 6.6 0.0 0.0 22.2 11.0 13.7 7.1
1984 11.5 3.3 4.9 0.6 12.2 3.3 0.0 0.0 27.2 11.1 17.1 5.6
1983 7.7 3.9 3.8 0.0 8.4 3.9 0.0 0.0 18.6 13.5 11.8 8.4
1982 10.7 4.0 4.1 1.7 11.2 4.0 0.0 0.0 25.6 8.0 15.2 4.5
1981 12.1 5.2 3.0 2.9 13.5 5.7 0.0 0.0 30.4 15.5 18.2 9.2
1980 13.6 6.4 3.2 1.7 14.7 7.0 0.0 0.0 30.8 17.4 19.1 10.5
1979 11.2 5.9 2.3 1.8 12.8 6.5 0.0 0.0 27.0 14.7 17.4 10.0
1978 10.2 7.8 2.9 4.2 11.4 9.0 0.0 0.0 24.8 20.3 14.3 13.1
1977 9.5 3.0 2.5 2.4 10.2 3.6 0.0 0.0 20.8 6.7 12.9 4.2
1976 8.3 6.8 0.0 1.8 9.4 7.4 0.0 0.0 21.3 19.6 11.9 10.4
1975 8.3 6.8 0.0 1.9 9.4 7.5 0.0 0.0 21.4 19.9 11.9 10.6

Fatal vehicle accidents
Type Total countDrunkFatal countPedestrian countPerson countVehicle count
Year ColumbusLincolnColumbusLincolnColumbusLincolnColumbusLincolnColumbusLincolnColumbusLincoln
1975 46 11 0 3 52 12 0 0 118 32 66 17
1976 46 11 0 3 52 12 0 0 118 32 66 17
1977 53 5 14 4 57 6 0 0 116 11 72 7
1978 57 13 16 7 64 15 0 0 139 34 80 22
1979 63 10 13 3 72 11 0 0 152 25 98 17
1980 77 11 18 3 83 12 0 0 174 30 108 18
1981 69 9 17 5 77 10 0 0 174 27 104 16
1982 62 7 24 3 65 7 0 0 148 14 88 8
1983 45 7 22 0 49 7 0 0 109 24 69 15
1984 68 6 29 1 72 6 0 0 161 20 101 10
1985 52 11 25 5 56 12 0 0 133 20 82 13
1986 54 7 33 8 56 7 0 0 120 20 74 13
1987 64 10 23 5 66 10 0 0 170 29 109 15
1988 62 5 30 2 72 5 0 0 147 14 92 8
1989 55 15 7 8 60 17 0 0 149 59 91 39
1990 34 8 9 4 34 8 0 0 77 35 46 16
1991 47 6 10 1 54 6 7 6 117 16 69 7
1992 36 5 2 2 37 5 10 0 88 12 56 8
1993 45 5 16 2 48 5 19 2 115 13 65 6
1994 33 9 9 4 34 9 14 2 77 34 48 15
1995 45 3 10 1 47 3 13 1 109 8 63 5
1996 49 4 19 1 50 4 11 2 148 9 78 5
1997 50 8 18 1 55 8 18 6 127 24 78 14
1998 51 16 15 10 59 16 14 5 152 57 84 25
1999 63 7 24 2 66 8 15 1 169 22 98 12
2000 46 12 11 9 46 14 10 1 117 37 71 24
2001 70 13 22 4 74 16 21 3 204 44 116 27
2002 56 10 19 5 62 11 9 0 129 39 83 22
2003 56 19 26 10 60 21 13 1 177 44 96 32
2004 57 8 14 4 61 10 11 1 142 20 89 13
2005 61 9 21 3 62 10 13 1 160 26 101 16
2006 47 9 19 6 50 9 10 1 119 17 85 14
2007 55 11 23 5 59 12 13 0 121 33 83 17
2008 65 5 27 0 70 5 22 1 194 11 113 7
2009 56 6 22 1 59 6 14 2 143 13 92 9
2010 52 5 17 1 54 5 14 0 125 7 90 7
2011 59 10 15 1 62 10 25 2 121 16 92 12
2012 56 5 23 1 64 6 17 2 134 11 94 10
2013 44 6 13 1 50 6 11 2 104 9 72 8
2014 50 12 21 5 53 12 18 0 104 28 86 20
2015 56 16 22 3 61 16 16 3 128 33 94 27
2016 61 7 28 3 61 7 22 1 133 13 97 11
2017 63 8 20 1 65 9 21 1 135 34 102 21
2018 67 9 22 4 73 9 20 2 146 22 102 13
2019 77 20 25 8 85 20 32 3 166 44 121 32
2020 87 11 26 9 91 12 25 2 185 18 140 15
2021 95 12 0 0 102 13 32 1 219 43 164 26
Police full-time law enforcement employees
Year ColumbusLincoln
2021 0 490
2020 2,277 481
2019 0 480
2018 2,255 479
2017 1,937 466
2016 0 465
2015 2,205 481
2014 2,203 460
2013 2,181 456
2012 2,138 414
2011 2,114 421
2010 0 410
2009 2,179 414
2008 0 414
2007 0 403
2006 2,178 409
2005 2,136 414
2004 0 421
2003 2,150 407
Police full-time law enforcement employees (per 1,000 residents)
Year ColumbusLincoln
2021 0.0 1.7
2020 2.5 1.6
2019 0.0 1.6
2018 2.5 1.7
2017 2.2 1.6
2016 0.0 1.7
2015 2.6 1.7
2014 2.7 1.7
2013 2.7 1.7
2012 2.7 1.6
2011 2.7 1.6
2010 0.0 1.6
2009 2.9 1.6
2008 0.0 1.6
2007 0.0 1.7
2006 3.0 1.7
2005 2.9 1.7
2004 0.0 1.8
2003 3.0 1.7
Local government: full-time employees
Job ColumbusLincoln
Correction 71 0
Financial administration 312 66
Firefighters 1,574 268
Fire - other 50 36
Health 431 135
Judicial and legal 453 31
Other and unallocable 408 50
Other government administration 571 67
Parks and recreation 326 145
Police - other 368 149
Police protection - officers 1,925 339
Sewerage 429 34
Solid waste management 199 69
Streets and highways 461 216
Totals for government 8,465 2,497
Transit 0 130
Water supply 412 100
Welfare 309 70
Local government: part-time employees
Job ColumbusLincoln
Correction 4 0
Financial administration 9 1
Fire - other 7 3
Health 45 32
Judicial and legal 32 1
Other and unallocable 33 3
Other government administration 33 8
Parks and recreation 398 171
Police - other 10 8
Sewerage 2 0
Solid waste management 0 3
Streets and highways 7 1
Totals for government 608 369
Water supply 11 5
Welfare 15 41
Place of birth - Foreign born
Residents ColumbusLincoln
All residents 15.1% 8.2%
American Indian / Alaska Native residents 44.9% 4.4%
Asian residents 76.3% 70.5%
Black or African American residents 20.9% 21.5%
Native Hawaiian / Pacific Islander residents 5.8% 12.9%
Other race residents 38.8% 33.3%
Two or more races residents 13.7% 13.9%
White residents 3.5% 2.4%
White alone, not Hispanic / Latino residents 3.4% 2.8%
Place of birth - Native, outside of US
Residents ColumbusLincoln
All residents 1.6% 0.9%
American Indian / Alaska Native residents 3.4% 0.0%
Asian residents 0.7% 0.0%
Black or African American residents 1.6% 0.9%
Native Hawaiian / Pacific Islander residents 0.0% 20.5%
Other race residents 4.8% 2.5%
Two or more races residents 2.4% 2.2%
White residents 1.0% 0.6%
White alone, not Hispanic / Latino residents 0.6% 0.6%
Place of birth - Born in state of residence
Residents ColumbusLincoln
All residents 62.5% 64.3%
American Indian / Alaska Native residents 37.9% 63.7%
Asian residents 14.2% 14.6%
Black or African American residents 59.3% 43.6%
Native Hawaiian / Pacific Islander residents 82.5% 20.9%
Other race residents 38.8% 38.0%
Two or more races residents 65.3% 63.5%
White residents 71.0% 70.0%
White alone, not Hispanic / Latino residents 71.2% 71.0%
Place of birth - Born in other state
Residents ColumbusLincoln
All residents 20.8% 26.6%
American Indian / Alaska Native residents 13.7% 31.9%
Asian residents 8.8% 14.8%
Black or African American residents 18.2% 34.0%
Native Hawaiian / Pacific Islander residents 11.7% 45.7%
Other race residents 17.6% 26.2%
Two or more races residents 18.6% 20.4%
White residents 24.5% 27.0%
White alone, not Hispanic / Latino residents 24.8% 25.6%
English speakers (speaking English at home)
Type Columbus Lincoln
Born in the United States residents 93.7% 93.9%
Foreign born residents 16.6% 15%
Native, born elsewhere residents 56.3% 72.6%
Total residents 83.6% 87.3%
Mechanisms of homicide
Mechanism ColumbusLincoln
Homicides from 2000 to 2006 650 30
Cut / Pierce 68 0
Firearm 455 0
Mechanisms of homicide per 1,000,000 residents
Mechanism ColumbusLincoln
Homicides from 2000 to 2006 85.1 16.4
Cut / Pierce 8.9 0
Firearm 59.6 0
Mechanisms of suicide per 1,000,000 residents
Mechanism ColumbusLincoln
Suicides from 2000 to 2006 100.0 120.4
Fall 2.9 0
Firearm 47.6 48.7
Poisoning 19.6 34.5
Suffocation 24.0 33.4

Infrastructure

Both Columbus and Lincoln have made significant investments in infrastructure. Columbus features modern amenities, roads, bridges, and parks. Lincoln also maintains well-developed infrastructure, including roads, railways, libraries, and parks.
Infrastructure
Type Columbus Lincoln
Hospitals 47 11
TV stations 14 16
Arenas or stadiums 3 3
Bank branches located here 200 123
Bank institutions located here 25 21
Main business address for public companies 23 8
Drinking water stations with no reported violations in the past 17 6
Drinking water stations with reported violations in the past 40 12

Schools

School facilities
Type Columbus Lincoln
Private elementary/middle schools 34 16
Private high schools 12 5
Public elementary/middle schools 162 50
Public high schools 64 9
Colleges/Universities 37 12
HMDA - Conventional home purchase loans - Applications denied
Year ColumbusLincoln
1999 2,450 563
2000 2,376 394
2001 1,897 262
2002 1,483 246
2003 2,087 334
2004 3,216 357
2005 4,275 416
2006 4,662 374
2007 2,679 223
2008 1,015 149
2009 555 97

Culture and Food

Columbus offers a rich cultural scene with numerous theaters, arts venues, and diverse food options. Lincoln also has a vibrant culture with a thriving music scene and a variety of local and international cuisines.

Sports Teams

Columbus is home to professional sports teams including the Columbus Blue Jackets (NHL) and Columbus Crew (MLS). Lincoln doesn’t host any major professional sports teams, but collegiate sports, especially football at the University of Nebraska, are very popular.